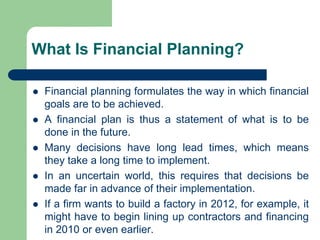
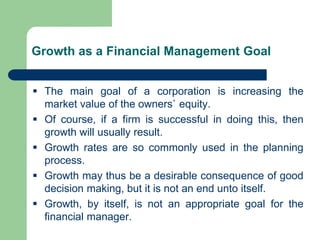
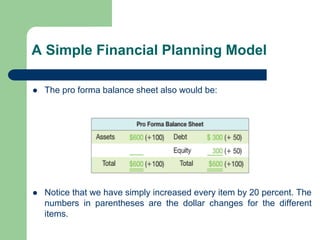
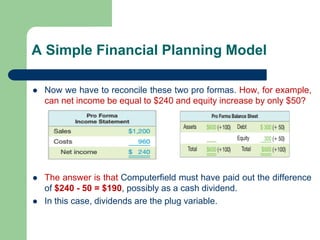
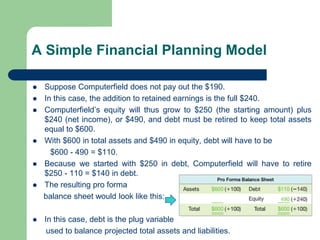
Lecture 4
Long-term Financial Planning
Principles of Corporate Finance
Dr. Abdullah Hamoud
Main source: Ross, Westerfield and Jordan (2010). Fundamentals of Corporate Finance, 9th ed. McGraw-Hill
What Is Financial Planning?
⚫ Financial planning formulates the way in which financial
goals are to be achieved.
⚫ A financial plan is thus a statement of what is to be
done in the future.
⚫ Many decisions have long lead times, which means
they take a long time to implement.
⚫ In an uncertain world, this requires that decisions be
made far in advance of their implementation.
⚫ If a firm wants to build a factory in 2012, for example, it
might have to begin lining up contractors and financing
in 2010 or even earlier.
Growth as a Financial Management Goal
▪ The main goal of a corporation is increasing the
market value of the owners` equity.
▪ Of course, if a firm is successful in doing this, then
growth will usually result.
▪ Growth rates are so commonly used in the planning
process.
▪ Growth may thus be a desirable consequence of good
decision making, but it is not an end unto itself.
▪ Growth, by itself, is not an appropriate goal for the
financial manager.
Lesson from Real Cases
1- Clothing retailer J. Peterman Co. Case
⚫ Clothing retailer J. Peterman Co., whose catalogs
were made famous on the TV show Seinfeld,
learned a lesson the hard way.
⚫ Despite its strong brand name and years of
explosive revenue growth, the company was
ultimately forced to file for bankruptcy—the victim
of an overly ambitious, growth-oriented expansion
plan.
Lesson from Real Cases
2- Amazon Com. Case
⚫ Amazon.com, the big online retailer, is another
example. At one time, Amazon’s motto seemed to be
“growth at any cost.”
⚫ Unfortunately, what really grew rapidly for the
company were losses.
⚫ Amazon refocused its business, explicitly sacrificing
growth in the hope of achieving profitability.
⚫ The plan worked, as Amazon.com turned a profit for
the first time in the third quarter of 2003.
Dimensions of financial planning
1. Planning Horizon:
▪ It is often useful for planning purposes to
think of the future as having a short run and
a long run.
▪ The short run, in practice, is usually the
coming 12 months.
▪ We focus our attention on financial planning
over the long run, which is usually taken to
be the coming two to five years.
Dimensions of financial planning
2. Aggregation:
is the process by which the smaller
investment proposals of each of a firm’s
operational units are added up and treated as
one big project.
Dimensions of financial planning
Financial planning usually requires three
alternative plans:
⚫ A worst case
⚫ A normal case and
⚫ A best case
Important Questions
It is important to remember that we are working with
accounting numbers, and we should ask ourselves some
important questions as we go through the planning
process. For example:
⚫ How does our plan affect the timing and risk of
our cash flows?
⚫ Does the plan point out inconsistencies in our
goals?
⚫ If we follow this plan, will we maximize owners’
wealth?
Accomplishments of Planning
➢ Examining interactions: linkages between
investment proposals and financing choices.
➢ Exploring options: the firm can develop,
analyze and compare different scenarios.
➢ Avoiding surprises: development of
contingency plans.
➢ Ensuring feasibility and internal
consistency: develops a structure for
reconciling different objectives.
Components of Financial Plan
The main components of a financial plan are:
1. Sales Forecast .
2. Pro Forma Statements.
3. Asset Requirements.
4. Financial Requirements.
5. The Plug.
6. Economic Assumptions.
A Simple Financial Planning Model
The Computerfield Corporation’s financial statements from the most
recent year are as follows:
• Unless otherwise stated, the financial planners at Computerfield
assume that all variables are tied directly to sales and current
relationships are optimal.
• This means that all items will grow at exactly the same rate as sales.
• This is obviously oversimplified; we use this assumption only to make
a point.
A Simple Financial Planning Model
⚫ Suppose sales increase by 20 percent, rising from $1,000 to
$1,200. Planners would then also forecast a 20 percent increase in
costs, from $800 to $800 x 1.2 = $960.
⚫ The pro forma income statement would thus be:
A Simple Financial Planning Model
⚫ The pro forma balance sheet also would be:
⚫ Notice that we have simply increased every item by 20 percent. The
numbers in parentheses are the dollar changes for the different
items.
A Simple Financial Planning Model
⚫ Now we have to reconcile these two pro formas. How, for example,
can net income be equal to $240 and equity increase by only $50?
⚫ The answer is that Computerfield must have paid out the difference
of $240 - 50 = $190, possibly as a cash dividend.
⚫ In this case, dividends are the plug variable.
A Simple Financial Planning Model
⚫ Suppose Computerfield does not pay out the $190.
⚫ In this case, the addition to retained earnings is the full $240.
⚫ Computerfield’s equity will thus grow to $250 (the starting amount) plus
$240 (net income), or $490, and debt must be retired to keep total assets
equal to $600.
⚫ With $600 in total assets and $490 in equity, debt will have to be
$600 - 490 = $110.
⚫ Because we started with $250 in debt, Computerfield will have to retire
$250 - 110 = $140 in debt.
⚫ The resulting pro forma
balance sheet would look like this:
⚫ In this case, debt is the plug variable
used to balance projected total assets and liabilities.
A Simple Financial Planning Model
⚫ This example shows the interaction between sales growth
and financial policy.
⚫ As sales increase, so do total assets.
⚫ This occurs because the firm must invest in net working
capital and fixed assets to support higher sales levels.
⚫ Because assets are growing, total liabilities and equity (the
right side of the balance sheet) will grow as well.
A Simple Financial Planning Model
⚫ The thing to notice from our simple example is that the way
the liabilities and owners’ equity change depends on the
firm’s financing policy and its dividend policy.
⚫ The growth in assets requires that the firm decide on how to
finance that growth.
⚫ This is strictly a managerial decision.
⚫ Note that in our example, the firm needed no outside funds.
⚫ This won’t usually be the case, so we explore a more detailed
situation in the next section.
The Percentage of Sales Approach
⚫ The logic of the percentage of sales method is to
assume that many items on the income statement
and balance sheet increase (decrease)
proportionally with sales.
⚫ You should not be afraid to refine the estimates
from this method if you have better information.
Starting with Sales Forecasts
⚫ Pro forma analysis starts with a sales forecast.
⚫ For outside investors, there are at least 2 methods
for obtaining sales forecasts:
▪ Use analysts’ forecasts. I/B/E/S regularly
surveys analysts about their expectations on
publicly held companies. See
finance.yahoo.com.
▪ Use companies’ forecasts. Many companies
provide sales estimates in their 10-Ks.
Usually, better (worse) companies provide
conservative (aggressive) estimates.
⚫ These forecasts serve as starting points.
Pro Forma Income Statement
⚫ We start out with the most recent income
statement for the Rosengarten Corporation, as
that shown in Table 4.1.
Pro Forma Income Statement
⚫ Rosengarten has projected a 25 percent
increase in sales for the coming year, so we are
anticipating sales of $1,000 x 1.25 = $1,250.
⚫ To generate a pro forma income statement, we
assume that total costs will continue to run at
$800/1,000 = 80% of sales.
Pro Forma Income Statement
⚫ With this assumption, Rosengarten’s pro forma
income statement is shown in Table 4.2 .
Pro Forma Income Statement
⚫ The effect here of assuming that costs are a
constant percentage of sales is to assume that
the profit margin is constant.
⚫ To check this, notice that the profit margin was
$132/1,000 = 13.2%.
Pro Forma Income Statement
⚫ In our pro forma, the profit margin is $165/1,250
= 13.2%; so it is unchanged.
⚫ Next, we need to project the dividend payment. This
amount is up to Rosengarten’s management. We will
assume Rosengarten has a policy of paying out a
constant fraction of net income in the form of a cash
dividend.
⚫ For the most recent year, the dividend payout ratio
was this: Dividend payout ratio Cash dividends/Net
income
$44/132 = 33.33%
Pro Forma Income Statement
⚫ We can also calculate the ratio of the addition to
retained earnings to net income:
⚫ Addition to retained earnings/Net income
$88/132 = 66.66%
⚫ This ratio is called the retention ratio or plowback
ratio, and it is equal to 1 minus the dividend payout ratio
because everything not paid out is retained.
⚫ Assuming that the payout ratio is constant, here are the
projected dividends and addition to retained earnings:
Pro Forma Income Statement
⚫ Assuming that the payout ratio is constant, here are the
projected dividends and addition to retained earnings:
Pro Forma Balance Sheet
⚫ To generate a pro forma balance sheet, we start with
the most recent statement, as shown in Table 4.3.
Pro Forma Balance Sheet
⚫ On our balance sheet, we assume that some items vary directly
with sales and others do not.
⚫ For items that vary with sales, we express each as a percentage
of sales for the year just completed.
⚫ When an item does not vary directly with sales, we write “n/a” for
“not applicable.”
⚫ For example, on the asset side, inventory is equal to 60 percent
of sales (= $600/1,000) for the year just ended.
⚫ We assume this percentage applies to the coming year, so for
each $1 increase in sales, inventory will rise by $.60.
⚫ More generally, the ratio of total assets to sales for the year just
ended is $3,000/1,000 = 3, or 300%.
Pro Forma Balance Sheet
⚫ For Rosengarten, assuming that this ratio is constant, it takes
$3 in total assets to generate $1 in sales (apparently
Rosengarten is in a relatively capital-intensive business).
⚫ Therefore, if sales are to increase by $100, Rosengarten will
have to increase total assets by three times this amount, or
$300.
⚫ On the liability side of the balance sheet, we show accounts
payable varying with sales. The reason is that we expect to
place more orders with our suppliers as sales volume
increases, so payables will change “spontaneously” with
sales.
Pro Forma Balance Sheet
⚫ Notes payable, on the other hand, represent short-term debt
such as bank borrowing. This item will not vary unless we
take specific actions to change the amount, so we mark it as
“n/a.”
⚫ Similarly, we use “n/a” for long-term debt because it won’t
automatically change with sales.
⚫ The same is true for common stock and paid-in surplus.
⚫ The last item on the right side, retained earnings, will vary
with sales, but it won’t be a simple percentage of sales.
⚫ Instead, we will explicitly calculate the change in retained
earnings based on our projected net income and dividends.
Pro Forma Balance Sheet
⚫ We can now construct a partial pro forma balance sheet for
Rosengarten.
⚫ We do this by using the percentages we have just calculated
wherever possible to calculate the projected amounts.
⚫ For example,
Net fixed assets are 180 percent of sales; so, with a new
sales level of $1,250, the net fixed asset amount will be 1.80
X $1,250 = $2,250, representing an increase of $2,250 -
1,800 = $450 in plant and equipment.
⚫ It is important to note that for items that don’t vary directly
with sales, we initially assume no change and simply write in
the original amounts.
Pro Forma Balance Sheet
⚫ The result is shown in Table 4.4.
Pro Forma Balance Sheet
⚫ Inspecting our pro forma balance sheet, we notice that
assets are projected to increase by $750.
⚫ However, without additional financing, liabilities and
equity will increase by only $185, leaving a shortfall of
$750 - 185 = $565.
⚫ This called “Additional Funds Needed” (AFN) or
External Funds Needed/ External Financing Needed
(EFN)
EFN
⚫ The “additional funds needed” (AFN) or external funds
needed/ external financing needed (EFN), is the
difference between the right-hand-side and the left-
hand-side of the statement.
⚫ If this number is positive, this means that the firm
needs to raise money externally to support the firm’s
growth.
⚫ This amount can be financed by an increase in notes
payable, long-term bonds, preferred stock, common
stock, or a combination of the above.

Principle corporate finance

  • 1.
    Lecture 4 Long-term FinancialPlanning Principles of Corporate Finance Dr. Abdullah Hamoud Main source: Ross, Westerfield and Jordan (2010). Fundamentals of Corporate Finance, 9th ed. McGraw-Hill
  • 2.
    What Is FinancialPlanning? ⚫ Financial planning formulates the way in which financial goals are to be achieved. ⚫ A financial plan is thus a statement of what is to be done in the future. ⚫ Many decisions have long lead times, which means they take a long time to implement. ⚫ In an uncertain world, this requires that decisions be made far in advance of their implementation. ⚫ If a firm wants to build a factory in 2012, for example, it might have to begin lining up contractors and financing in 2010 or even earlier.
  • 3.
    Growth as aFinancial Management Goal ▪ The main goal of a corporation is increasing the market value of the owners` equity. ▪ Of course, if a firm is successful in doing this, then growth will usually result. ▪ Growth rates are so commonly used in the planning process. ▪ Growth may thus be a desirable consequence of good decision making, but it is not an end unto itself. ▪ Growth, by itself, is not an appropriate goal for the financial manager.
  • 4.
    Lesson from RealCases 1- Clothing retailer J. Peterman Co. Case ⚫ Clothing retailer J. Peterman Co., whose catalogs were made famous on the TV show Seinfeld, learned a lesson the hard way. ⚫ Despite its strong brand name and years of explosive revenue growth, the company was ultimately forced to file for bankruptcy—the victim of an overly ambitious, growth-oriented expansion plan.
  • 5.
    Lesson from RealCases 2- Amazon Com. Case ⚫ Amazon.com, the big online retailer, is another example. At one time, Amazon’s motto seemed to be “growth at any cost.” ⚫ Unfortunately, what really grew rapidly for the company were losses. ⚫ Amazon refocused its business, explicitly sacrificing growth in the hope of achieving profitability. ⚫ The plan worked, as Amazon.com turned a profit for the first time in the third quarter of 2003.
  • 6.
    Dimensions of financialplanning 1. Planning Horizon: ▪ It is often useful for planning purposes to think of the future as having a short run and a long run. ▪ The short run, in practice, is usually the coming 12 months. ▪ We focus our attention on financial planning over the long run, which is usually taken to be the coming two to five years.
  • 7.
    Dimensions of financialplanning 2. Aggregation: is the process by which the smaller investment proposals of each of a firm’s operational units are added up and treated as one big project.
  • 8.
    Dimensions of financialplanning Financial planning usually requires three alternative plans: ⚫ A worst case ⚫ A normal case and ⚫ A best case
  • 9.
    Important Questions It isimportant to remember that we are working with accounting numbers, and we should ask ourselves some important questions as we go through the planning process. For example: ⚫ How does our plan affect the timing and risk of our cash flows? ⚫ Does the plan point out inconsistencies in our goals? ⚫ If we follow this plan, will we maximize owners’ wealth?
  • 10.
    Accomplishments of Planning ➢Examining interactions: linkages between investment proposals and financing choices. ➢ Exploring options: the firm can develop, analyze and compare different scenarios. ➢ Avoiding surprises: development of contingency plans. ➢ Ensuring feasibility and internal consistency: develops a structure for reconciling different objectives.
  • 11.
    Components of FinancialPlan The main components of a financial plan are: 1. Sales Forecast . 2. Pro Forma Statements. 3. Asset Requirements. 4. Financial Requirements. 5. The Plug. 6. Economic Assumptions.
  • 14.
    A Simple FinancialPlanning Model The Computerfield Corporation’s financial statements from the most recent year are as follows: • Unless otherwise stated, the financial planners at Computerfield assume that all variables are tied directly to sales and current relationships are optimal. • This means that all items will grow at exactly the same rate as sales. • This is obviously oversimplified; we use this assumption only to make a point.
  • 15.
    A Simple FinancialPlanning Model ⚫ Suppose sales increase by 20 percent, rising from $1,000 to $1,200. Planners would then also forecast a 20 percent increase in costs, from $800 to $800 x 1.2 = $960. ⚫ The pro forma income statement would thus be:
  • 16.
    A Simple FinancialPlanning Model ⚫ The pro forma balance sheet also would be: ⚫ Notice that we have simply increased every item by 20 percent. The numbers in parentheses are the dollar changes for the different items.
  • 17.
    A Simple FinancialPlanning Model ⚫ Now we have to reconcile these two pro formas. How, for example, can net income be equal to $240 and equity increase by only $50? ⚫ The answer is that Computerfield must have paid out the difference of $240 - 50 = $190, possibly as a cash dividend. ⚫ In this case, dividends are the plug variable.
  • 18.
    A Simple FinancialPlanning Model ⚫ Suppose Computerfield does not pay out the $190. ⚫ In this case, the addition to retained earnings is the full $240. ⚫ Computerfield’s equity will thus grow to $250 (the starting amount) plus $240 (net income), or $490, and debt must be retired to keep total assets equal to $600. ⚫ With $600 in total assets and $490 in equity, debt will have to be $600 - 490 = $110. ⚫ Because we started with $250 in debt, Computerfield will have to retire $250 - 110 = $140 in debt. ⚫ The resulting pro forma balance sheet would look like this: ⚫ In this case, debt is the plug variable used to balance projected total assets and liabilities.
  • 19.
    A Simple FinancialPlanning Model ⚫ This example shows the interaction between sales growth and financial policy. ⚫ As sales increase, so do total assets. ⚫ This occurs because the firm must invest in net working capital and fixed assets to support higher sales levels. ⚫ Because assets are growing, total liabilities and equity (the right side of the balance sheet) will grow as well.
  • 20.
    A Simple FinancialPlanning Model ⚫ The thing to notice from our simple example is that the way the liabilities and owners’ equity change depends on the firm’s financing policy and its dividend policy. ⚫ The growth in assets requires that the firm decide on how to finance that growth. ⚫ This is strictly a managerial decision. ⚫ Note that in our example, the firm needed no outside funds. ⚫ This won’t usually be the case, so we explore a more detailed situation in the next section.
  • 21.
    The Percentage ofSales Approach ⚫ The logic of the percentage of sales method is to assume that many items on the income statement and balance sheet increase (decrease) proportionally with sales. ⚫ You should not be afraid to refine the estimates from this method if you have better information.
  • 22.
    Starting with SalesForecasts ⚫ Pro forma analysis starts with a sales forecast. ⚫ For outside investors, there are at least 2 methods for obtaining sales forecasts: ▪ Use analysts’ forecasts. I/B/E/S regularly surveys analysts about their expectations on publicly held companies. See finance.yahoo.com. ▪ Use companies’ forecasts. Many companies provide sales estimates in their 10-Ks. Usually, better (worse) companies provide conservative (aggressive) estimates. ⚫ These forecasts serve as starting points.
  • 23.
    Pro Forma IncomeStatement ⚫ We start out with the most recent income statement for the Rosengarten Corporation, as that shown in Table 4.1.
  • 24.
    Pro Forma IncomeStatement ⚫ Rosengarten has projected a 25 percent increase in sales for the coming year, so we are anticipating sales of $1,000 x 1.25 = $1,250. ⚫ To generate a pro forma income statement, we assume that total costs will continue to run at $800/1,000 = 80% of sales.
  • 25.
    Pro Forma IncomeStatement ⚫ With this assumption, Rosengarten’s pro forma income statement is shown in Table 4.2 .
  • 26.
    Pro Forma IncomeStatement ⚫ The effect here of assuming that costs are a constant percentage of sales is to assume that the profit margin is constant. ⚫ To check this, notice that the profit margin was $132/1,000 = 13.2%.
  • 27.
    Pro Forma IncomeStatement ⚫ In our pro forma, the profit margin is $165/1,250 = 13.2%; so it is unchanged. ⚫ Next, we need to project the dividend payment. This amount is up to Rosengarten’s management. We will assume Rosengarten has a policy of paying out a constant fraction of net income in the form of a cash dividend. ⚫ For the most recent year, the dividend payout ratio was this: Dividend payout ratio Cash dividends/Net income $44/132 = 33.33%
  • 28.
    Pro Forma IncomeStatement ⚫ We can also calculate the ratio of the addition to retained earnings to net income: ⚫ Addition to retained earnings/Net income $88/132 = 66.66% ⚫ This ratio is called the retention ratio or plowback ratio, and it is equal to 1 minus the dividend payout ratio because everything not paid out is retained. ⚫ Assuming that the payout ratio is constant, here are the projected dividends and addition to retained earnings:
  • 29.
    Pro Forma IncomeStatement ⚫ Assuming that the payout ratio is constant, here are the projected dividends and addition to retained earnings:
  • 30.
    Pro Forma BalanceSheet ⚫ To generate a pro forma balance sheet, we start with the most recent statement, as shown in Table 4.3.
  • 31.
    Pro Forma BalanceSheet ⚫ On our balance sheet, we assume that some items vary directly with sales and others do not. ⚫ For items that vary with sales, we express each as a percentage of sales for the year just completed. ⚫ When an item does not vary directly with sales, we write “n/a” for “not applicable.” ⚫ For example, on the asset side, inventory is equal to 60 percent of sales (= $600/1,000) for the year just ended. ⚫ We assume this percentage applies to the coming year, so for each $1 increase in sales, inventory will rise by $.60. ⚫ More generally, the ratio of total assets to sales for the year just ended is $3,000/1,000 = 3, or 300%.
  • 32.
    Pro Forma BalanceSheet ⚫ For Rosengarten, assuming that this ratio is constant, it takes $3 in total assets to generate $1 in sales (apparently Rosengarten is in a relatively capital-intensive business). ⚫ Therefore, if sales are to increase by $100, Rosengarten will have to increase total assets by three times this amount, or $300. ⚫ On the liability side of the balance sheet, we show accounts payable varying with sales. The reason is that we expect to place more orders with our suppliers as sales volume increases, so payables will change “spontaneously” with sales.
  • 33.
    Pro Forma BalanceSheet ⚫ Notes payable, on the other hand, represent short-term debt such as bank borrowing. This item will not vary unless we take specific actions to change the amount, so we mark it as “n/a.” ⚫ Similarly, we use “n/a” for long-term debt because it won’t automatically change with sales. ⚫ The same is true for common stock and paid-in surplus. ⚫ The last item on the right side, retained earnings, will vary with sales, but it won’t be a simple percentage of sales. ⚫ Instead, we will explicitly calculate the change in retained earnings based on our projected net income and dividends.
  • 34.
    Pro Forma BalanceSheet ⚫ We can now construct a partial pro forma balance sheet for Rosengarten. ⚫ We do this by using the percentages we have just calculated wherever possible to calculate the projected amounts. ⚫ For example, Net fixed assets are 180 percent of sales; so, with a new sales level of $1,250, the net fixed asset amount will be 1.80 X $1,250 = $2,250, representing an increase of $2,250 - 1,800 = $450 in plant and equipment. ⚫ It is important to note that for items that don’t vary directly with sales, we initially assume no change and simply write in the original amounts.
  • 35.
    Pro Forma BalanceSheet ⚫ The result is shown in Table 4.4.
  • 36.
    Pro Forma BalanceSheet ⚫ Inspecting our pro forma balance sheet, we notice that assets are projected to increase by $750. ⚫ However, without additional financing, liabilities and equity will increase by only $185, leaving a shortfall of $750 - 185 = $565. ⚫ This called “Additional Funds Needed” (AFN) or External Funds Needed/ External Financing Needed (EFN)
  • 37.
    EFN ⚫ The “additionalfunds needed” (AFN) or external funds needed/ external financing needed (EFN), is the difference between the right-hand-side and the left- hand-side of the statement. ⚫ If this number is positive, this means that the firm needs to raise money externally to support the firm’s growth. ⚫ This amount can be financed by an increase in notes payable, long-term bonds, preferred stock, common stock, or a combination of the above.