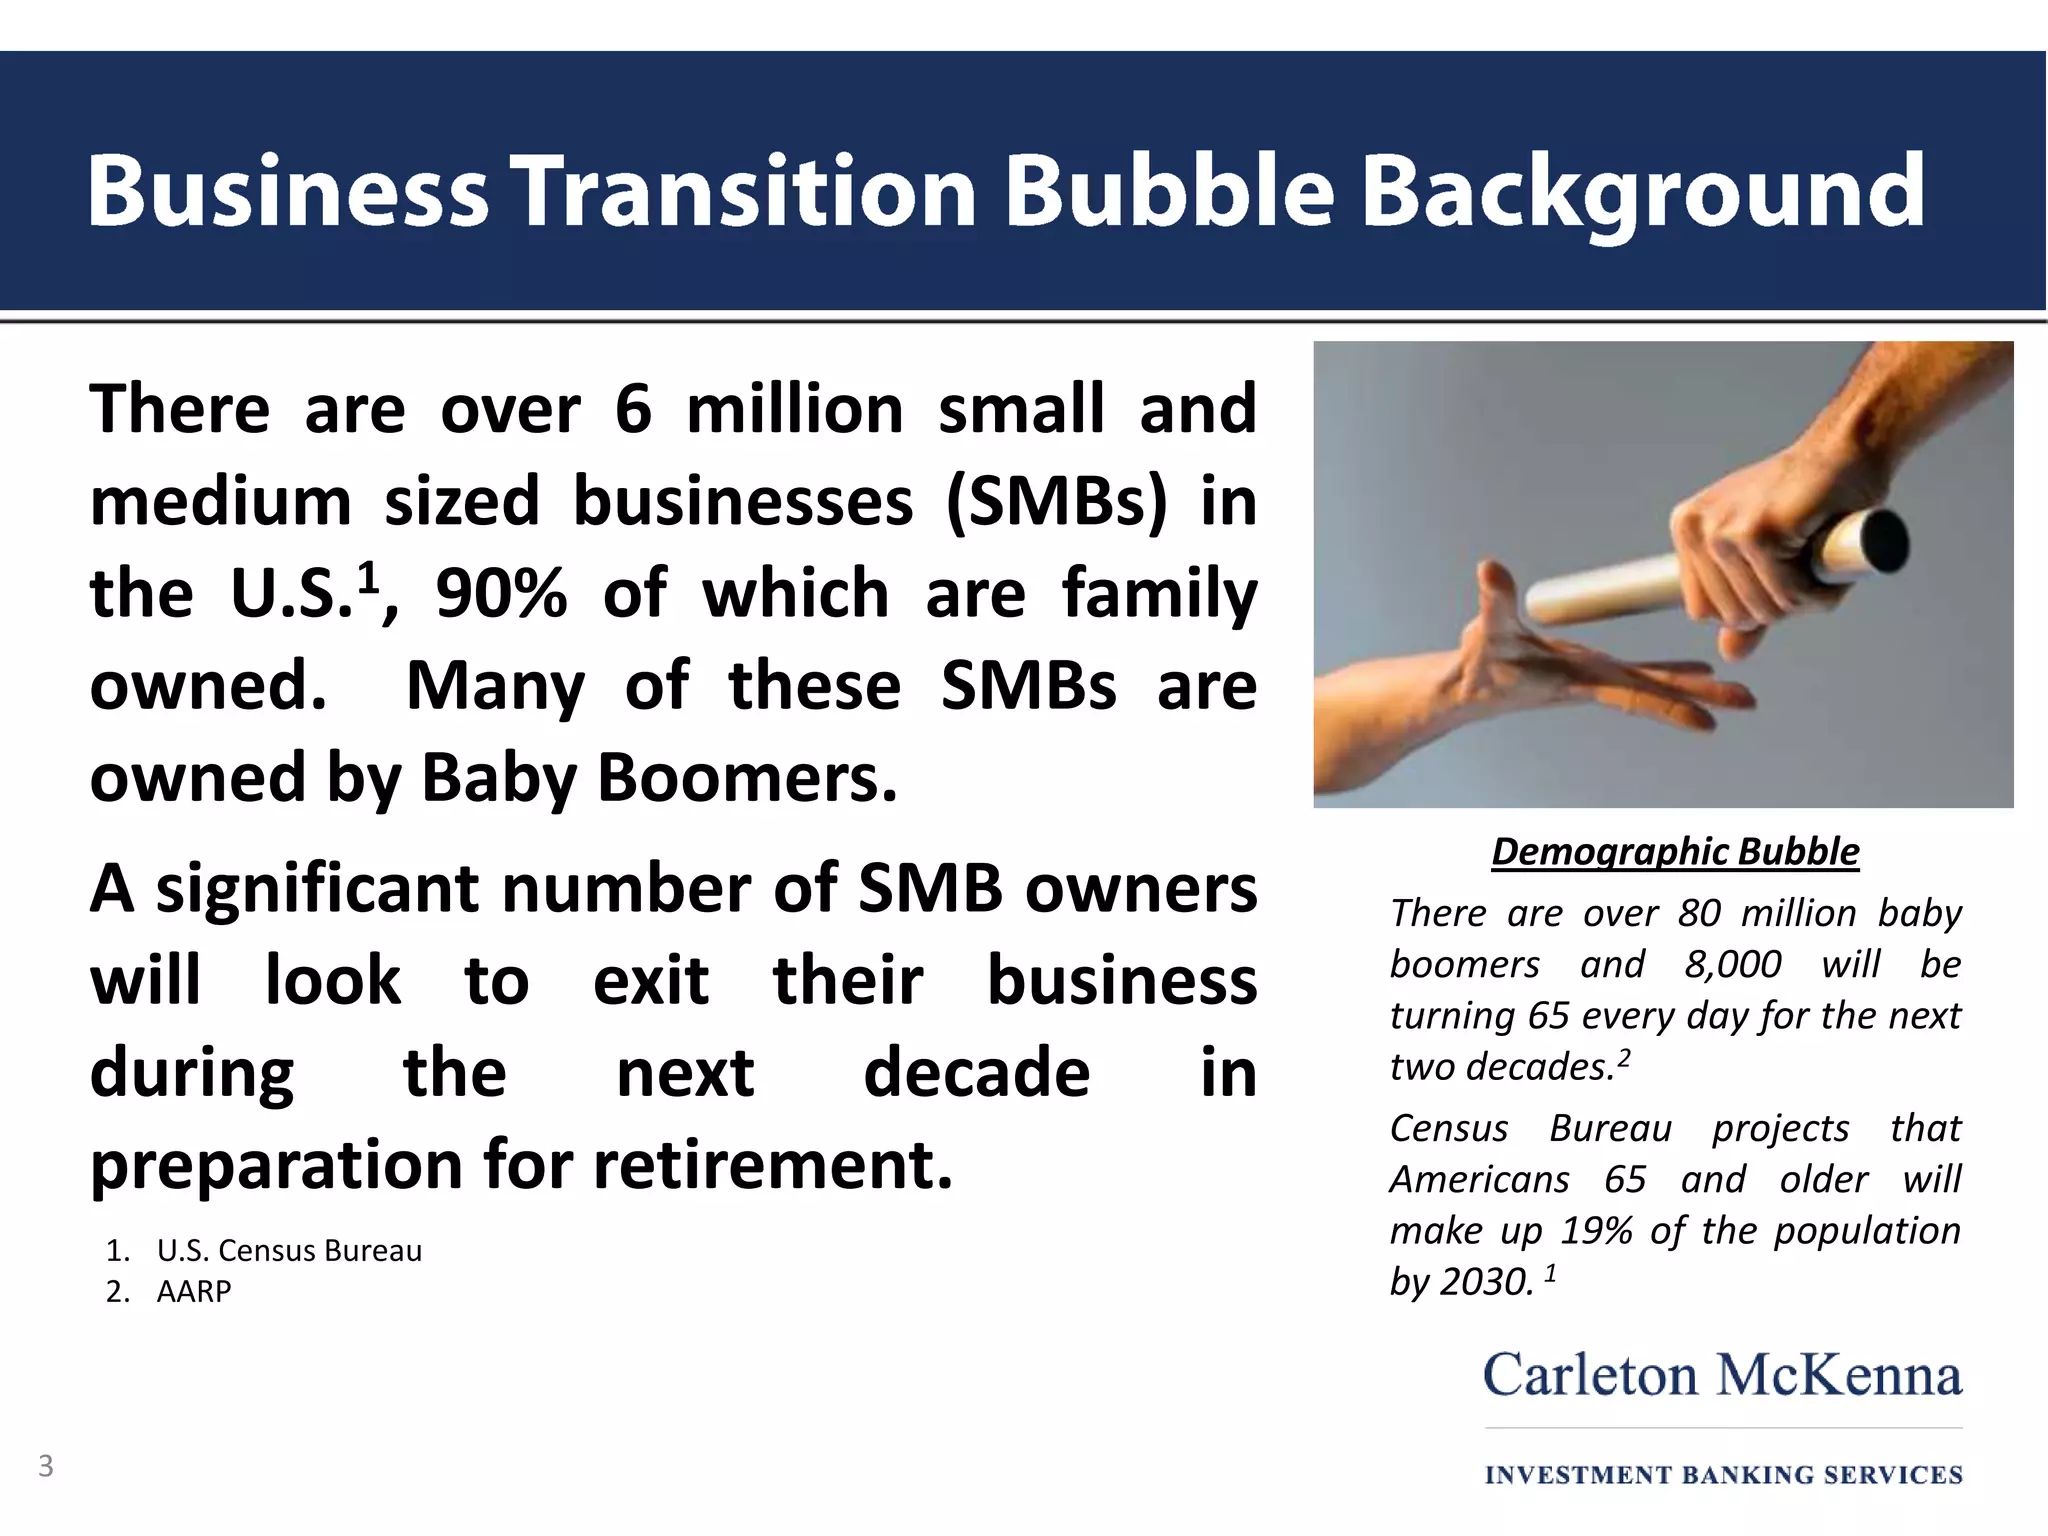
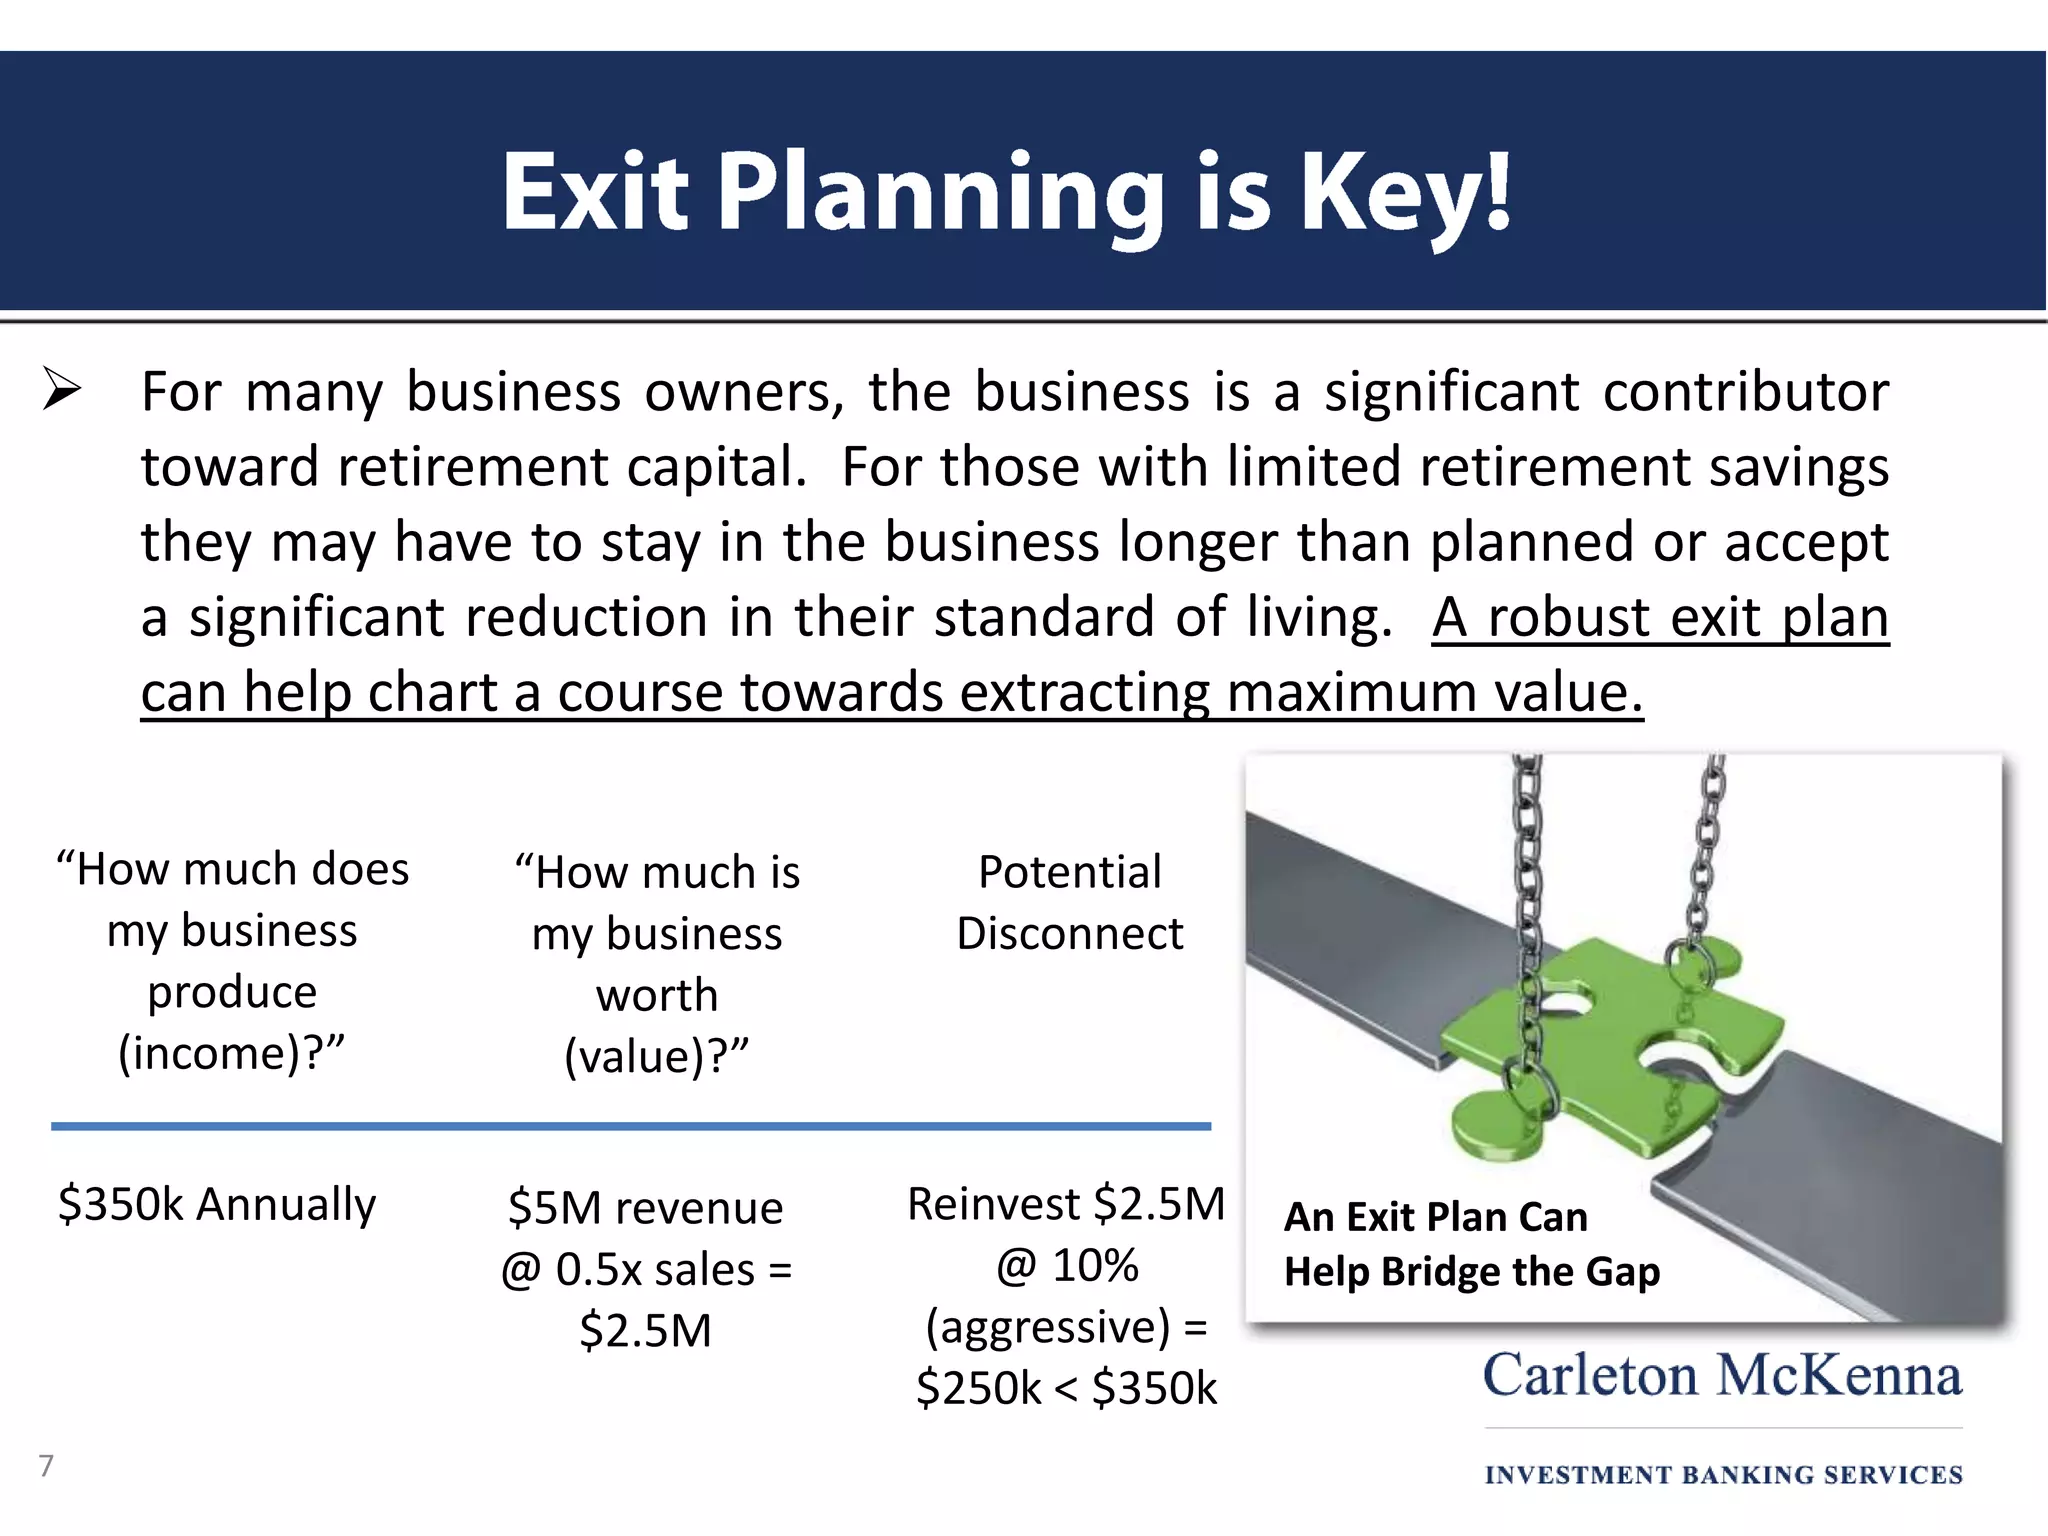
 Understand the drivers and need for business exit
planning
 Understand the components of a robust exit plan
 Understand the roles that professional service firms
can play in business exit planning
Capitalize on the Succession Bubble!
2
There are over 6 million small and
medium sized businesses (SMBs) in
the U.S.1, 90% of which are family
owned. Many of these SMBs are
owned by Baby Boomers.
A significant number of SMB owners
will look to exit their business
during the next decade in
preparation for retirement.
1. U.S. Census Bureau
2. AARP
Demographic Bubble
There are over 80 million baby
boomers and 8,000 will be
turning 65 every day for the next
two decades.2
Census Bureau projects that
Americans 65 and older will
make up 19% of the population
by 2030. 1
3
 How many are going to sell?
• 75% of business owners ultimately plan to sell or pass along their
business.1
• One out of every two company owners plan to sell their business within
the next 10 years.2
• Demand may outstrip supply  potentially lower sale prices.
 How many are ready to sell?
• Some have delayed a sale due to the ‘08-’09 recession, while others have
re-evaluated their lifestyles and may be more likely to sell earlier than
was the case 10+ years ago.
• Most (many estimate 70%+) do not have any plan for what will be the
most significant event of their lives. 1
1. Northwestern Mutual
2. PricewaterhouseCoopers
4
Other Facts
 Of the family owned businesses, only 30% of such companies
succeed in the second generation and just 15% make it to the
third generation = Sale > Transfer
 Most will seek advice on the sale of their business =
Opportunity
 According to SunTrust Bank, 42% indicated that maximizing
their business’s value is the most important part of an exit1 =
ironic since most do not have a plan to chart a course toward
increasing value
 To maintain a sustainable business, scale is becoming
increasingly important. Technology is allowing larger
businesses to drive down into smaller segments, thereby
increasing competition = Growth through acquisitions
1. SunTrust Bank
5
Opportunity Estimate
Number of SMBs 6,000,000
% Family Owned 90%
# Family Owned SMBs 5,400,000
% That Will Sell 50%
# That Will Sell 2,700,000
Average Revenue $5,000,000
Total Average Revenue Sold $13.5 Trillion
Estimated Sales Multiple 0.5x
Business Value Transferred $6.75T
Annual Opportunity (Est. 10 Yrs.) $675 Billion
Assuming a 2%
variable fee, a
$13.5 billion
annual revenue
opportunity
exists for
service
providers in this
space!!
6
 For many business owners, the business is a significant contributor
toward retirement capital. For those with limited retirement savings
they may have to stay in the business longer than planned or accept
a significant reduction in their standard of living. A robust exit plan
can help chart a course towards extracting maximum value.
An Exit Plan Can
Help Bridge the Gap
“How much does
my business
produce
(income)?”
“How much is
my business
worth
(value)?”
Potential
Disconnect
7
$350k Annually $5M revenue
@ 0.5x sales =
$2.5M
Reinvest $2.5M
@ 10%
(aggressive) =
$250k < $350k
 Succession planning is important for owners transferring
leadership from one generation to the next and/or to
management
• Focuses on business continuity, skills of next generation/management,
relational issues, family dynamics, etc.
 Exit planning focuses on transferring ownership
• Succession planning can be a part of exit planning, since a “self sustaining”
business (i.e., doesn’t require the owner to assure it generates the level of profit
desired) is worth more than one with key man risks (owner wears a lot of
“hats”).
• A plan should be initiated at least a year or more in advance of a potential sale
process.
8
 Understand The Owner’s
Objectives
 Assemble a Team
 Understand Your Business’
Worth
9
 Make the Business Look Desirable to Buyers
 Improve Business Operations and Profitability
 Understand the owner’s personal and financial goals
• How much money is needed to sustain retirement?
• Is that feasible? If an owner wants $10 million on an exit but the business is
likely worth $7 million, significant business and market improvements may be
needed in order to increase profits and the exit multiple; or the owner’s
expectations will need to change.
• When does the owner want to retire?
• Certain buyers may require the owner to transition the business over a period of
time (18 months +/-). In addition, the sale process can take up to 12 months. As
such, planning should begin at least 3 years before the owner wants to retire.
• Who does the owner want to sell to?
• Strategic buyers can pay premiums due to synergies. However, some sellers
prefer to take a lower price in order to ensure status quo – same culture, name,
people, etc.
10
 Before initiating a sale process, a team of experts with
diverse skill sets should be assembled to help steer a sale
to a positive end.
• A deal team should include attorneys, accountants and an investment banker or
business broker, all of whom can help navigate the tax and deal landscape. No
one professional has all the answers.
11
• Post-transaction estate and retirement
needs should also be addressed (such as
an estate attorney, insurance planner
and/or wealth manager).
A good team allows the owner to continue to focus on growing the business throughout
the sale process, thereby maximizing the sale price and minimizing business disruption.
 Establishing parameters on business value is an important
step in the process.
 A formal valuation gives a realistic idea of what a business
is worth and help assess financial and non-financial
status, including current industry dynamics and market
position.
12
Traditional
Valuation
Methodologies
Income Method
Discounted Cash
Flow Approach
Capitalization of
Cash Flow
Approach
Market Method
Comparable
Public Company
Approach
Precedent
Transaction
Approach
Asset Method
Net Asset Value
Approach
Leveraged
Buyout
Approach
 Working capital considerations - examine efficiency
 Tangible assets – quality of assets or deferred capex
 Contract backlog – confidence to near-term projections
 Customer relationships – repeat customers with low
concentration
 Proprietary, patented technology/formulations/process
 Brand name
 Proven management team and skilled assembled workforce –
employee retention
 Supplier relationships
 Growth strategy – scalable growth at sustainable margins
 Tax attributes
14
Strategic Control Premium
Financial Control Premium Lack of Control Discount
Lack of Marketability Discount
Strategic Control Value
Financial Control Value
Marketable Minority
Nonmarketable Minority
Strategic value is the
highest level of value
related to potential
synergies. The next
level, financial control,
is value expected from
a financial buyer.
Oftentimes, financial
control and
marketable minority
levels of value
converge in efficiently
run businesses.
Strategic Control Benefits
Reduction in competition
Revenue or profit enhancement
through synergies
Cost savings or economies of
scale
Financial Control Benefits
Ability to change management or
compensation
Ability to sell or acquire assets
Ability to change capital structure
Ability to make distributions
Ability to control capex decisions
 Goal is to “measure up” and realize a higher “price per
square foot” for the business
• Physical assets should be clean and attractive
• Companies sell for more that also present an attractive story with
supporting documentation
• Is there remaining upside runway?
• Are the financial records well maintained?
• Is there a history of financial forecasting/budgeting?
• Do the reported financials provide an incomplete picture of how
profitable the Company really is or have you prepared and justified
appropriate earnings adjustments?
• How strong are the external and internal agreements?
• Do you have well documented policies and processes?
• Have you mitigated litigation or environmental issues?
• Are you complying with all necessary regulations?
17
 It is key to focus on the business’ core operations and
underlying profitability
 There are many things an owner can do to legitimately
make his/her business more profitable/valuable/less risky
to a new owner including:
• Diversifying the customer base
• Filling management holes
• Upgrading systems/processes
• Closing down less profitable business lines
• Culling unprofitable customers
• Keeping the work force lean
18
 Sale to a strategic buyer (typically highest valuation due to
synergies)
 Sale to a financial buyer
 Sale to management (buy/sell agreements)
 Transfer/sale to family members/trust (potential discounts for
lack of control and marketability)
 Sale to employees (ESOP – Fair Market Value)
 IPO (at least > $100 million revenue)
 Shut down
19
Exit alternative will impact taxes, timing, and cash considerations
Financing
Expansion
/ Recap
2003 2004 2005 2006 2007 2008 2009 2010 2011 2012 Jul-12 Jul-13
# of Transactions – Middle-Market 3,692 3,956 3,848 3,867 3,640 3,604 3,322 5,401 4,561 4,427 2,618 1,728
# of Transactions – $500M - $1B 106 134 143 178 227 120 78 173 152 169 91 80
# of Transactions – $100M – $499M 620 781 796 864 853 600 432 691 760 719 413 357
# of Transactions – <$100M 2,966 3,041 2,909 2,825 2,560 2,884 2,812 4,537 3,649 3,539 2,114 1,291
Deal Value (In Billions) 270$ 338$ 350$ 401$ 423$ 278$ 196$ 342$ 346$ 346$ 195$ 162$
U.S. Middle Market M&A Activity
$-
$50
$100
$150
$200
$250
$300
$350
$400
$450
-
1,000
2,000
3,000
4,000
5,000
6,000
2003 2004 2005 2006 2007 2008 2009 2010 2011 2012 Jul-12 Jul-13
# of Transactions – <$100M # of Transactions – $100M – $499M # of Transactions – $500M - $1B Deal Value (In Billions)
 2011: Fewer deals versus 2010, but the value of these transactions trended higher
 2012: Essentially flat with 2011 related to political uncertainty (fiscal cliff) and a U.S. economy entrenched in low
growth mode
 2013: Meager M&A volume despite easy debt and giant corporate balance sheets due in part to risk adverse CEOs &
boards
 Going forward M&A drivers: cash on corporate balance sheets, ongoing recovery, pent-up demand, robust credit
markets
• Cash levels of S&P 500 >$1 trillion
• Private equity buyout funds are sitting on nearly $400 billion of cash
20
Financing
Expansion
/ Recap
 Valuation multiples hovering in the range of 5-8x EBITDA for most mid-
sized companies, with higher outliers seen in unique, niche markets
 Positive trend: strategics and financial sponsors are willing to pay
significant values for firms that show scale, growth and a prominent
position in the marketplace; S&P 500 up 18% since the beginning of
the year
LTM
Transaction Size 2003 2004 2005 2006 2007 2008 2009 2010 2011 2012 2013
<$100M 6.8x 7.6x 9.2x 8.1x 8.5x 7.8x 7.0x 7.0x 8.3x 7.1x 7.4x
$100M-$499M 8.2x 9.0x 9.9x 9.2x 11.2x 11.1x 8.1x 10.1x 9.3x 9.1x 9.1x
$500M-$1B 9.6x 10.3x 10.1x 12.0x 10.8x 10.6x 7.8x 9.0x 9.9x 8.7x 8.6x
Middle-Market 7.5x 8.6x 9.7x 9.2x 9.9x 9.5x 7.6x 8.6x 9.2x 8.1x 8.5x
Middle Market EV / EBITDA Multiples
21
Financing
Expansion
/ Recap
Low interest rate environment
• Lower cost of capital (e.g., “cheap debt”) that may lend itself to higher
prices
• Reinvestment risk
More predictable estate planning environment (e.g.,
continuation of the $5.25 million lifetime gift tax exemption)
• Presents more opportunities to make informed decisions
22
23
Company A Company B
• Light Manufacturing • Light Manufacturing
• Revenue at $20M,
growing 3%/yr.
• Revenue at $18M,
growing 8.5%/yr.
• $2M EBITDA • $2.5M EBITDA
• Older equipment needing
frequent maintenance
• Equipment in good
condition
• $1M inventory
• (poor controls)
• $500K inventory
• Good controls
• Loyal employees
• Loyal employees
• Limited management
team
• Good management team
Valued at 5.0x EBITDA, or
$10M
Valued at 6x EBITDA, or
$15M
Two businesses, similar size, similar
industry. However Company B
performed exit planning and
executed on areas of improvement
including culling unprofitable
customers, improving working
capital efficiency and filling
management holes. Company B also
presented an exciting growth story
to potential buyers (i.e., better
packaging). As such, Company B
realized a higher multiple on higher
earnings at exit, resulting in a 50%
higher sale price.
 Carleton McKenna advised a company in a sale process
that did not perform exit planning
 Discovered capital structure issues as company had an
“underwater” class of common shareholders
• Certain shareholders would receive nothing in the sale due to a heavy
liquidation preference from preferred shareholders
• Added time and uncertainty to the deal as the buyer was hesitant to
structure the transaction as a merger and common shareholders could
dissent and elect appraisal rights
• Added cost as a fairness opinion was needed
• Issue could have been resolved via exit planning as the shares could have
been redeemed for some nominal amount
24
 Carleton McKenna advised a company in a sale process
that did not perform exit planning
 Discovered issue with contracts of a large customer
• Company had a customer with multiple contracts that represented over
20% of profits (customer concentration)
• Only one contract was structured appropriately regarding economic
terms
• Buyer wanted the contracts restructured to reflect economic reality
• Customer had leverage and was able to negotiate better terms in
exchange for shifting contract compensation
• Issue could have been resolved via exit planning as the contracts could
have been modified in the normal course of operations
25
 Carleton McKenna advised a company in a sale process
that did not perform exit planning
 Key employees did not have non-competes in place
• Company had several key regional managers that maintained customer
relationships but did not have non-compete agreements
• Buyer wanted non-competes
• Key managers held significant bargaining power since they knew they
could hold the deal hostage; owner agreed to pay the managers a
significant sum to sign the non-competes
• Issue could have been resolved via exit planning as the non-competes
could have been obtained in prior years and tied to bonuses
26
Paul H. Carleton MANAGING PARTNER
phc@carletonmckenna.com
Christopher J. McKenna MANAGING DIRECTOR
cjm@carletonmckenna.com
Dominic M. Brault MANAGING DIRECTOR
dmb@carletonmckenna.com
For more
information please
contact:
1801 East Ninth Street, Suite 1425
Cleveland, OH 44114
Phone: 216.523.1962 Fax:216.523.1322
www.carletonmckenna.com
27

Exit Planning - Maximizing Value Through Pre-Transaction Readiness

  • 2.
     Understand thedrivers and need for business exit planning  Understand the components of a robust exit plan  Understand the roles that professional service firms can play in business exit planning Capitalize on the Succession Bubble! 2
  • 3.
    There are over6 million small and medium sized businesses (SMBs) in the U.S.1, 90% of which are family owned. Many of these SMBs are owned by Baby Boomers. A significant number of SMB owners will look to exit their business during the next decade in preparation for retirement. 1. U.S. Census Bureau 2. AARP Demographic Bubble There are over 80 million baby boomers and 8,000 will be turning 65 every day for the next two decades.2 Census Bureau projects that Americans 65 and older will make up 19% of the population by 2030. 1 3
  • 4.
     How manyare going to sell? • 75% of business owners ultimately plan to sell or pass along their business.1 • One out of every two company owners plan to sell their business within the next 10 years.2 • Demand may outstrip supply  potentially lower sale prices.  How many are ready to sell? • Some have delayed a sale due to the ‘08-’09 recession, while others have re-evaluated their lifestyles and may be more likely to sell earlier than was the case 10+ years ago. • Most (many estimate 70%+) do not have any plan for what will be the most significant event of their lives. 1 1. Northwestern Mutual 2. PricewaterhouseCoopers 4
  • 5.
    Other Facts  Ofthe family owned businesses, only 30% of such companies succeed in the second generation and just 15% make it to the third generation = Sale > Transfer  Most will seek advice on the sale of their business = Opportunity  According to SunTrust Bank, 42% indicated that maximizing their business’s value is the most important part of an exit1 = ironic since most do not have a plan to chart a course toward increasing value  To maintain a sustainable business, scale is becoming increasingly important. Technology is allowing larger businesses to drive down into smaller segments, thereby increasing competition = Growth through acquisitions 1. SunTrust Bank 5
  • 6.
    Opportunity Estimate Number ofSMBs 6,000,000 % Family Owned 90% # Family Owned SMBs 5,400,000 % That Will Sell 50% # That Will Sell 2,700,000 Average Revenue $5,000,000 Total Average Revenue Sold $13.5 Trillion Estimated Sales Multiple 0.5x Business Value Transferred $6.75T Annual Opportunity (Est. 10 Yrs.) $675 Billion Assuming a 2% variable fee, a $13.5 billion annual revenue opportunity exists for service providers in this space!! 6
  • 7.
     For manybusiness owners, the business is a significant contributor toward retirement capital. For those with limited retirement savings they may have to stay in the business longer than planned or accept a significant reduction in their standard of living. A robust exit plan can help chart a course towards extracting maximum value. An Exit Plan Can Help Bridge the Gap “How much does my business produce (income)?” “How much is my business worth (value)?” Potential Disconnect 7 $350k Annually $5M revenue @ 0.5x sales = $2.5M Reinvest $2.5M @ 10% (aggressive) = $250k < $350k
  • 8.
     Succession planningis important for owners transferring leadership from one generation to the next and/or to management • Focuses on business continuity, skills of next generation/management, relational issues, family dynamics, etc.  Exit planning focuses on transferring ownership • Succession planning can be a part of exit planning, since a “self sustaining” business (i.e., doesn’t require the owner to assure it generates the level of profit desired) is worth more than one with key man risks (owner wears a lot of “hats”). • A plan should be initiated at least a year or more in advance of a potential sale process. 8
  • 9.
     Understand TheOwner’s Objectives  Assemble a Team  Understand Your Business’ Worth 9  Make the Business Look Desirable to Buyers  Improve Business Operations and Profitability
  • 10.
     Understand theowner’s personal and financial goals • How much money is needed to sustain retirement? • Is that feasible? If an owner wants $10 million on an exit but the business is likely worth $7 million, significant business and market improvements may be needed in order to increase profits and the exit multiple; or the owner’s expectations will need to change. • When does the owner want to retire? • Certain buyers may require the owner to transition the business over a period of time (18 months +/-). In addition, the sale process can take up to 12 months. As such, planning should begin at least 3 years before the owner wants to retire. • Who does the owner want to sell to? • Strategic buyers can pay premiums due to synergies. However, some sellers prefer to take a lower price in order to ensure status quo – same culture, name, people, etc. 10
  • 11.
     Before initiatinga sale process, a team of experts with diverse skill sets should be assembled to help steer a sale to a positive end. • A deal team should include attorneys, accountants and an investment banker or business broker, all of whom can help navigate the tax and deal landscape. No one professional has all the answers. 11 • Post-transaction estate and retirement needs should also be addressed (such as an estate attorney, insurance planner and/or wealth manager). A good team allows the owner to continue to focus on growing the business throughout the sale process, thereby maximizing the sale price and minimizing business disruption.
  • 12.
     Establishing parameterson business value is an important step in the process.  A formal valuation gives a realistic idea of what a business is worth and help assess financial and non-financial status, including current industry dynamics and market position. 12
  • 13.
    Traditional Valuation Methodologies Income Method Discounted Cash FlowApproach Capitalization of Cash Flow Approach Market Method Comparable Public Company Approach Precedent Transaction Approach Asset Method Net Asset Value Approach Leveraged Buyout Approach
  • 14.
     Working capitalconsiderations - examine efficiency  Tangible assets – quality of assets or deferred capex  Contract backlog – confidence to near-term projections  Customer relationships – repeat customers with low concentration  Proprietary, patented technology/formulations/process  Brand name  Proven management team and skilled assembled workforce – employee retention  Supplier relationships  Growth strategy – scalable growth at sustainable margins  Tax attributes 14
  • 15.
    Strategic Control Premium FinancialControl Premium Lack of Control Discount Lack of Marketability Discount Strategic Control Value Financial Control Value Marketable Minority Nonmarketable Minority Strategic value is the highest level of value related to potential synergies. The next level, financial control, is value expected from a financial buyer. Oftentimes, financial control and marketable minority levels of value converge in efficiently run businesses.
  • 16.
    Strategic Control Benefits Reductionin competition Revenue or profit enhancement through synergies Cost savings or economies of scale Financial Control Benefits Ability to change management or compensation Ability to sell or acquire assets Ability to change capital structure Ability to make distributions Ability to control capex decisions
  • 17.
     Goal isto “measure up” and realize a higher “price per square foot” for the business • Physical assets should be clean and attractive • Companies sell for more that also present an attractive story with supporting documentation • Is there remaining upside runway? • Are the financial records well maintained? • Is there a history of financial forecasting/budgeting? • Do the reported financials provide an incomplete picture of how profitable the Company really is or have you prepared and justified appropriate earnings adjustments? • How strong are the external and internal agreements? • Do you have well documented policies and processes? • Have you mitigated litigation or environmental issues? • Are you complying with all necessary regulations? 17
  • 18.
     It iskey to focus on the business’ core operations and underlying profitability  There are many things an owner can do to legitimately make his/her business more profitable/valuable/less risky to a new owner including: • Diversifying the customer base • Filling management holes • Upgrading systems/processes • Closing down less profitable business lines • Culling unprofitable customers • Keeping the work force lean 18
  • 19.
     Sale toa strategic buyer (typically highest valuation due to synergies)  Sale to a financial buyer  Sale to management (buy/sell agreements)  Transfer/sale to family members/trust (potential discounts for lack of control and marketability)  Sale to employees (ESOP – Fair Market Value)  IPO (at least > $100 million revenue)  Shut down 19 Exit alternative will impact taxes, timing, and cash considerations
  • 20.
    Financing Expansion / Recap 2003 20042005 2006 2007 2008 2009 2010 2011 2012 Jul-12 Jul-13 # of Transactions – Middle-Market 3,692 3,956 3,848 3,867 3,640 3,604 3,322 5,401 4,561 4,427 2,618 1,728 # of Transactions – $500M - $1B 106 134 143 178 227 120 78 173 152 169 91 80 # of Transactions – $100M – $499M 620 781 796 864 853 600 432 691 760 719 413 357 # of Transactions – <$100M 2,966 3,041 2,909 2,825 2,560 2,884 2,812 4,537 3,649 3,539 2,114 1,291 Deal Value (In Billions) 270$ 338$ 350$ 401$ 423$ 278$ 196$ 342$ 346$ 346$ 195$ 162$ U.S. Middle Market M&A Activity $- $50 $100 $150 $200 $250 $300 $350 $400 $450 - 1,000 2,000 3,000 4,000 5,000 6,000 2003 2004 2005 2006 2007 2008 2009 2010 2011 2012 Jul-12 Jul-13 # of Transactions – <$100M # of Transactions – $100M – $499M # of Transactions – $500M - $1B Deal Value (In Billions)  2011: Fewer deals versus 2010, but the value of these transactions trended higher  2012: Essentially flat with 2011 related to political uncertainty (fiscal cliff) and a U.S. economy entrenched in low growth mode  2013: Meager M&A volume despite easy debt and giant corporate balance sheets due in part to risk adverse CEOs & boards  Going forward M&A drivers: cash on corporate balance sheets, ongoing recovery, pent-up demand, robust credit markets • Cash levels of S&P 500 >$1 trillion • Private equity buyout funds are sitting on nearly $400 billion of cash 20
  • 21.
    Financing Expansion / Recap  Valuationmultiples hovering in the range of 5-8x EBITDA for most mid- sized companies, with higher outliers seen in unique, niche markets  Positive trend: strategics and financial sponsors are willing to pay significant values for firms that show scale, growth and a prominent position in the marketplace; S&P 500 up 18% since the beginning of the year LTM Transaction Size 2003 2004 2005 2006 2007 2008 2009 2010 2011 2012 2013 <$100M 6.8x 7.6x 9.2x 8.1x 8.5x 7.8x 7.0x 7.0x 8.3x 7.1x 7.4x $100M-$499M 8.2x 9.0x 9.9x 9.2x 11.2x 11.1x 8.1x 10.1x 9.3x 9.1x 9.1x $500M-$1B 9.6x 10.3x 10.1x 12.0x 10.8x 10.6x 7.8x 9.0x 9.9x 8.7x 8.6x Middle-Market 7.5x 8.6x 9.7x 9.2x 9.9x 9.5x 7.6x 8.6x 9.2x 8.1x 8.5x Middle Market EV / EBITDA Multiples 21
  • 22.
    Financing Expansion / Recap Low interestrate environment • Lower cost of capital (e.g., “cheap debt”) that may lend itself to higher prices • Reinvestment risk More predictable estate planning environment (e.g., continuation of the $5.25 million lifetime gift tax exemption) • Presents more opportunities to make informed decisions 22
  • 23.
    23 Company A CompanyB • Light Manufacturing • Light Manufacturing • Revenue at $20M, growing 3%/yr. • Revenue at $18M, growing 8.5%/yr. • $2M EBITDA • $2.5M EBITDA • Older equipment needing frequent maintenance • Equipment in good condition • $1M inventory • (poor controls) • $500K inventory • Good controls • Loyal employees • Loyal employees • Limited management team • Good management team Valued at 5.0x EBITDA, or $10M Valued at 6x EBITDA, or $15M Two businesses, similar size, similar industry. However Company B performed exit planning and executed on areas of improvement including culling unprofitable customers, improving working capital efficiency and filling management holes. Company B also presented an exciting growth story to potential buyers (i.e., better packaging). As such, Company B realized a higher multiple on higher earnings at exit, resulting in a 50% higher sale price.
  • 24.
     Carleton McKennaadvised a company in a sale process that did not perform exit planning  Discovered capital structure issues as company had an “underwater” class of common shareholders • Certain shareholders would receive nothing in the sale due to a heavy liquidation preference from preferred shareholders • Added time and uncertainty to the deal as the buyer was hesitant to structure the transaction as a merger and common shareholders could dissent and elect appraisal rights • Added cost as a fairness opinion was needed • Issue could have been resolved via exit planning as the shares could have been redeemed for some nominal amount 24
  • 25.
     Carleton McKennaadvised a company in a sale process that did not perform exit planning  Discovered issue with contracts of a large customer • Company had a customer with multiple contracts that represented over 20% of profits (customer concentration) • Only one contract was structured appropriately regarding economic terms • Buyer wanted the contracts restructured to reflect economic reality • Customer had leverage and was able to negotiate better terms in exchange for shifting contract compensation • Issue could have been resolved via exit planning as the contracts could have been modified in the normal course of operations 25
  • 26.
     Carleton McKennaadvised a company in a sale process that did not perform exit planning  Key employees did not have non-competes in place • Company had several key regional managers that maintained customer relationships but did not have non-compete agreements • Buyer wanted non-competes • Key managers held significant bargaining power since they knew they could hold the deal hostage; owner agreed to pay the managers a significant sum to sign the non-competes • Issue could have been resolved via exit planning as the non-competes could have been obtained in prior years and tied to bonuses 26
  • 27.
    Paul H. CarletonMANAGING PARTNER phc@carletonmckenna.com Christopher J. McKenna MANAGING DIRECTOR cjm@carletonmckenna.com Dominic M. Brault MANAGING DIRECTOR dmb@carletonmckenna.com For more information please contact: 1801 East Ninth Street, Suite 1425 Cleveland, OH 44114 Phone: 216.523.1962 Fax:216.523.1322 www.carletonmckenna.com 27