Corker debt presentation_slideshow
•
0 likes•625 views

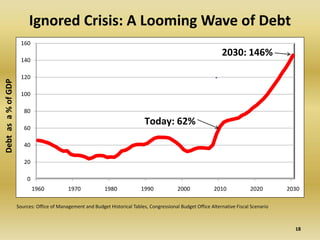
The document discusses the growing gap between government spending and revenue in the United States and the looming debt crisis this will cause. It notes that if current trends continue, debt will reach 146% of GDP by 2030, up from 62% today. Charts show spending growing much faster than revenue, with mandatory spending on programs like Medicare and Social Security being the main driver. The document argues that Washington's spending far exceeds what taxpayers can afford and that difficult decisions are needed to bring spending in line with historical averages.

Recommended
Recommended
More Related Content
Viewers also liked
Similar to Corker debt presentation_slideshow
Similar to Corker debt presentation_slideshow (20)
More from Greater Memphis Chamber
More from Greater Memphis Chamber (20)
Corker debt presentation_slideshow
- 1. Ignored Crisis: A Looming Wave of Debt 160 2030: 146% 140 120 Debt as a % of GDP 100 80 Today: 62% 60 40 20 0 1960 1970 1980 1990 2000 2010 2020 2030 Sources: Office of Management and Budget Historical Tables, Congressional Budget Office Alternative Fiscal Scenario 18
- 2. Widening Gap Between Spending and Revenue 28.0 26.0 24.0 2020 Gap: 22.0 $1.25 % of GDP 20.0 Trillion 18.0 16.0 14.0 Revenue 12.0 Spending 1960 1970 1980 1990 2000 2010 2020 Sources: OMB Historical Tables (1940‐2009), Congressional Budget Office's Long‐Term Budget Outlook Alternative Fiscal Scenario 17
- 3. Washington “Budgeting” • In 2008, average TN household earned $43,000 • Using Washington logic, they would spend $74,000 • That’s $31,000 more than they earn • Must borrow 40 cents for every dollar they spend 16
- 4. 1970 Spending Interest Mandatory Spending Payments: (Medicare, Medicaid, $63 billion Social Security): 7% $279 billion 31% 62% Discretionary Spending (Defense, Highways, Education): $558 billion In Current Dollars Source: Congressional Budget Office 15
- 5. 2010 Spending Interest Mandatory Spending Payments: (Medicare, Medicaid, $209 Billion Social Security): 6% $2.03 Trillion 42% 52% Discretionary Spending (Defense, Highways, Education): $1.38 Trillion Source: Congressional Budget Office 14
- 6. 2035 Spending Interest Mandatory Spending Payments: (Medicare, Medicaid, $2.27 Trillion Social Security): $4.46 Trillion 25% 49% 26% Discretionary Spending (Defense, Highways, Education): $2.43 Trillion In Current Dollars Source: Congressional Budget Office, Alternative Fiscal Scenario 13
- 7. Debt Isn’t Free: Putting 2009 Costs Into Perspective 200 187 180 160 Billions of $ 140 120 100 80 69 60 49 45 44 40 30 20 12 0 Net Interest Dept of Dept of Dept of Dept of TN State Dept of Labor Transportation Homeland Education Housing Budget Security Sources: President’s FY’11 Budget, CBO, TN 2010‐11 Budget 12
- 8. Debt Isn’t Free: Putting 2020 Costs Into Perspective 1000 916 900 800 Billions of $ 700 600 500 400 300 200 83 59 54 52 100 35 14 0 Net Interest Dept of Dept of Dept of Dept of Housing TN State Budget Dept of Labor Transportation Homeland Education Sources: President’s FY’11 Budget, CBO, TN 2010‐11 Budget Security Sources: President’s FY’11 Budget, CBO, TN 2010‐11 Budget 11
- 9. Who Owned America’s Debt in 1960? Total Publicly Held Debt: $236.8 Billion Foreign Holders: $13 Billion (5%) Domestic Holders: $223.8 billion (95%) Source: OMB and Department of the Treasury 10
- 10. Who Owns America’s Debt in 2010? Total Publicly Held Debt: $8.8 Trillion Foreign Domestic Holders: Holders: $4.7 Trillion $3.9Trillion (54%) China Owns: (46%) $876 Billion (10%) Source: Department of the Treasury, Federal Reserve Board 9
- 11. Plenty of blame to go around. 8
- 12. Historical Context Spending: 20.3% of GDP over the last 50 years Revenue: 18.0% of GDP over the last 50 years 7
- 13. What is Right Amount of Spending? 21% of GDP: Erskine Bowles 20.3% of GDP: 50-year Average 18% of GDP: Balanced Budget 6
- 14. Getting Spending Back to a Balanced Budget: $6.7 Trillion Reduction in Spending Over Ten Years 28.0 26.0 24.0 Tough % of GDP 22.0 Medicine: 20.0 $6.7 18.0 Trillion 16.0 Revenues as % of GDP 14.0 Outlays as % of GDP 12.0 1960 1970 1980 1990 2000 2010 2020 Getting to 21% of GDP would be $3.4 Trillion Getting to 20.3% of GDP would be $4.5 Trillion 5
- 15. $670 billion a year is about what we spend on ... 4
- 16. Fundamentally change the way Washington does business 3
- 17. A construct that forces us to cap spending and incentivize growth 2
- 18. We should not leave our children and grandchildren with this crippling debt 1