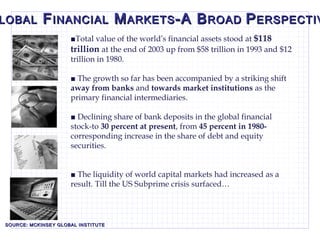
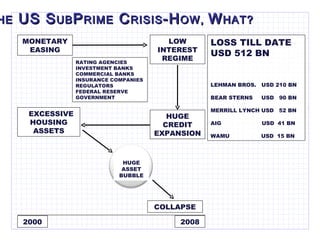
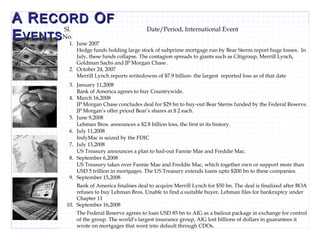
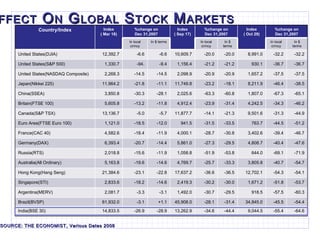
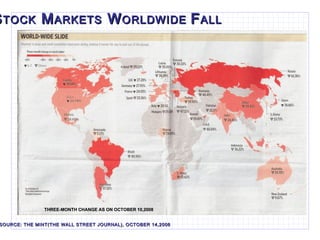
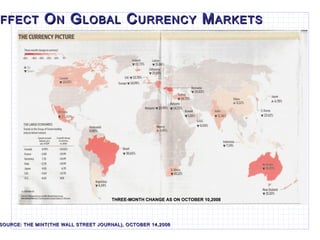
INDRANIL DEB PRESENTED AT THE SYMBIOSIS INSTITUTE OF MANAGEMENT STUDIES(SIMS),PUNE  ON TUESDAY, NOVEMBER 11,2008
■ Total value of the world ’ s financial assets stood at  $118 trillion  at the end of 2003 up from $58 trillion in 1993 and $12 trillion in 1980.  ■  The growth so far has been accompanied by a striking shift  away from banks  and  towards market institutions  as the primary financial intermediaries.  ■  Declining share of bank deposits in the global financial stock-to  30 percent at present , from  45 percent in 1980- corresponding increase in the share of debt and equity securities.  ■  The liquidity of world capital markets had increased as a result. Till the US Subprime crisis surfaced… G LOBAL  F INANCIAL  M ARKETS -A B ROAD  P ERSPECTIVE SOURCE: MCKINSEY GLOBAL INSTITUTE
T HE  US S UB P RIME  C RISIS -H OW,  W HAT? MONETARY EASING LOW INTEREST REGIME HUGE CREDIT EXPANSION EXCESSIVE HOUSING ASSETS COLLAPSE 2000 2008 RATING AGENCIES INVESTMENT BANKS COMMERCIAL BANKS INSURANCE COMPANIES REGULATORS FEDERAL RESERVE GOVERNMENT LOSS TILL DATE  USD 512 BN LEHMAN BROS.  USD 210 BN BEAR STERNS  USD  90 BN MERRILL LYNCH USD  52 BN AIG  USD  41 BN WAMU  USD  15 BN HUGE ASSET BUBBLE
Those losses have  ramifications that go  beyond the bank. If its  leverage ration  remains the same, the bank may have to cut back its lending-in this case by $45 billion(3 billion x 15). That sudden tightening hurts the economy. W HAT  R EALLY  W ENT  W RONG THE LEVERAGE MULTIPLIER 3 But leverage also  amplifies losses. When  the value of the bank’s  portfolio drops by 2%,  or $3 billion, 30% of the bank’s networth effectively gets wiped out; reducing the original capital of $10 billion to $7 billion By borrowing $15 for  every $1 of capital-or  leveraging up 15 times-  an investment bank  could turn $10 billion into a portfolio of $150 billion  2 1 0 $150 billion 0 $105 billion SOURCE: BUSINESS WEEK, JULY 28,.2008
A R ECORD  O F  E VENTS Sl. No. Date/Period, International Event 1. June 2007 Hedge funds holding large stock of subprime mortgage run by Bear Sterns report huge losses.  In July, these funds collapse. The contagion spreads to giants such as Citigroup, Merrill Lynch, Goldman Sachs and JP Morgan Chase . 2. October 24, 2007 Merrill Lynch reports writedowns of $7.9 billion- the largest  reported loss as of that date 3. January 11,2008 Bank of America agrees to buy Countrywide. 4. March 16,2008 JP Morgan Chase concludes deal for $29 bn to buy-out Bear Sterns funded by the Federal Reserve. JP Morgan’s offer priced Bear’s shares at $ 2 each. 5. June 9,2008 Lehman Bros. announces a $2.8 billion loss, the first in its history. 6. July 11,2008 IndyMac is seized by the FDIC 7. July 13,2008 US Treasury announces a plan to bail-out Fannie Mae and Freddie Mac. 8. September 6,2008 US Treasury takes over Fannie Mae and Freddie Mac, which together own or support more than USD 5 trillion in mortgages. The US Treasury extends loans upto $200 bn to these companies.  9. September 15,2008 Bank of America finalises deal to acquire Merrill Lynch for $50 bn. The deal is finalized after BOA refuses to buy Lehman Bros. Unable to find a suitable buyer, Lehman files for bankruptcy under Chapter 11  10. September 16,2008 The Federal Reserve agrees to loan USD 85 bn to AIG as a bailout package in exchange for control of the group. The world’s largest insurance group, AIG lost billions of dollars in guarantees it wrote on mortgages that went into default through CDOs.
E FFECT  O N  G LOBAL  S TOCK  M ARKETS SOURCE: THE ECONOMIST, Various Dates 2008 Country/Index Index ( Mar 18) %change on Dec 31,2007 Index ( Sep 17) %change on Dec 31,2007 Index ( Oct 29) %change on Dec 31,2007 In local crrncy In $ terms In local crrncy In $ terms In local crrncy In $ terms United States(DJIA) 12,392.7 -6.6 -6.6 10,609.7 -20.0 -20.0 8,991.0 -32.2 -32.2 United States(S&P 500) 1,330.7 -94. -9.4 1,156.4 -21.2 -21.2 930.1 -36.7 -36.7 United States(NASDAQ Composite) 2,268.3 -14.5 -14.5 2,098.9 -20.9 -20.9 1,657.2 -37.5 -37.5 Japan(Nikkei 225) 11,964.2 -21.8 -11.1 11,749.8 -23.2 -18.1 8,211.9 -46.4 -38.5 China(SSEA) 3,850.8 -30.3 -28.1 2,025.6 -63.3 -60.8 1,807.0 -67.3 -65.1 Britain(FTSE 100) 5,605.8 -13.2 -11.8 4,912.4 -23.9 -31.4 4,242.5 -34.3 -46.2 Canada(S&P TSX) 13,136.7 -5.0 -5.7 11,877.7 -14.1 -21.3 9,501.6 -31.3 -44.9 Euro Area(FTSE Euro 100) 1,121.0 -18.5 -12.0 941.5 -31.5 -33.5 763.7 -44.5 -51.2 France(CAC 40) 4,582.6 -18.4 -11.9 4,000.1 -28.7 -30.8 3,402.6 -39.4 -46.7 Germany(DAX) 6,393.4 -20.7 -14.4 5,861.0 -27.3 -29.5 4,808.7 -40.4 -47.6 Russia(RTS) 2,018.8 -15.6 -11.9 1,058.8 -51.9 -53.8 644.0 -69.1 -71.9 Australia(All Ordinary) 5,163.8 -19.6 -14.6 4,769.7 -25.7 -33.3 3,805.8 -40.7 -54.7 Hong Kong(Hang Seng) 21,384.6 -23.1 -22.8 17,637.2 -36.6 -36.5 12,702.1 -54.3 -54.1 Singapore(STI) 2,833.6 -18.2 -14.6 2,419.3 -30.2 -30.0 1,671.2 -51.8 -53.7 Argentina(MERV) 2,081.7 -3.3 -3.1 1,492.0 -30.7 -29.5 918.5 -57.5 -60.3 Brazil(BVSP) 61,932.0 -3.1 +1.1 45,908.0 -28.1 -31.4 34,845.0 -45.5 -54.4 India(BSE 30) 14,833.5 -26.9 -28.9 13,262.9 -34.6 -44.4 9,044.5 -55.4 -64.6
S TOCK  M ARKETS  W ORLDWIDE  F ALL THREE-MONTH CHANGE AS ON OCTOBER 10,2008 SOURCE: THE MINT(THE WALL STREET JOURNAL), OCTOBER 14,2008
E FFECT  O N  G LOBAL  C URRENCY  M ARKETS SOURCE: THE MINT(THE WALL STREET JOURNAL), OCTOBER 14,2008 THREE-MONTH CHANGE AS ON OCTOBER 10,2008
SOURCE: THE ECONOMIST, SEPTEMBER 20-26,2008
T HE  I NDIAN  F INANCIAL  S YSTEM -A N  O VERVIEW MINISTRY OF FINANCE FINMIN DIRECT SUPERVISION SECURITIES AND EXCHANGE BOARD OF INDIA MUTUAL  FUNDS FISCAL POLICY CAPITAL MARKETS SUPERVISION MONETARY POLICY, EXCHANGE RATE MANAGEMENT RESERVE BANK OF INDIA VENTURE CAPITAL FUNDS CAPITAL MARKETS STOCK EXCHANGES MERCHANT BANKS UNDERWRITERS STOCK BROKERS AND SUB-BROKERS CUTODIANS DEPOSITORIES & PARTICIPANTS FIIs INVESTORS NBFCs FINANCIAL INSTITUTIONS PRIMARY DEALERS COMMER-CIAL BANKS MONEY MARKET DERVTV MARKET FOREX MARKET
T HE  I NDIAN  S TOCK  M ARKETS- A N  I NTRODUCTION ■  History of Indian Stock markets over 200 years old ■  First organised stock exchange-Native Share and Stock Brokers  Association,1875(BSE) ■  19 operating stock exchanges of which 4 are national ■  The largest, National Stock Exchange(NSE) established in 1992 ■  1,407 Companies listed for trading on this exchange ■  The Market Cap of the NSE(Nov 8, 08) Rs. 29,34,900 Cr.  MARKET PLAYERS: ■  Investors : Individuals, Firms, HUFs, Societies, Trusts,  Companies, Mutual Funds, Financial Institutions and Foreign  Institutional Investors(FIIs) ■  Issuers : Companies, Government, Mutual Funds and Banks  ■  Intermediaries : Merchant Bankers, Registrars, Bankers, Credit  Rating Agencies, Depositories ■  Regulators : Reserve Bank of India(RBI), Securities and Exchange  Board of India(SEBI) and Ministry of Company Affairs ■  Appellate Authorities : Securities Appellate Tribunal(SAT),  Company Law Appellate Tribunal
T HE  I NDIAN  S TOCK  M ARKETS- K EY  P LAYERS Qualified Institutional Buyers(QIBs):  (Clause 2.2.2B(v) of Depositories and Investor Protection Guidelines: A QIB shall mean a Public Financial Institution as defined in Section 4A of the Companies Act,1956; Scheduled Commercial Banks, Mutual Funds, Foreign Institutional Investors registered with SEBI, Foreign Venture Capital Funds registered with SEBI, State Industrial Development Corporations, Insurance Companies registered with IRDA; Provident Funds with a minimum corpus of Rs. 25 crores; Pension Funds with a minimum corpus of Rs. 25 crores.
DOMESTIC SAVINGS RATE OF 35% APPROXIMATELY BETWEEN RS. 8.5-10LAC CRORE MOVES INTO SAVINGS AND INVESTMENT PRODUCTS SAVINGS AND FIXED DEPOSITS WITH BANKS MUTUAL FUNDS LIC POLICIES DEBENTURES SHARES THE DOMESTIC MUTUAL FUND INDUSTRY(AUM):  OCTOBER 2008: Rs. 4,31,902 Crs. OCTOBER 2007: Rs. 5,31,639 Crs AUM OF THE INSURANCE INDUSTRY IS CURRENTLY EXPECTED TO BE AROUND 8.5 LAC CRORE(2007-08) IN FY’09 THE INSURANCE SECTOR IS EXPECTED TO HAVE COLLECTED AROUND 1.28 LAC CRORE OF WHICH 50% OR Rs. 64K CRORE IS EXPECTED TO HAVE COME INTO THE STOCK MARKET.  IN 2007-08, INSURANCE INVESTED Rs. 55,000 CRORES THE TOTAL VALUE OF THE LIC PORTFOLIO COMPRISING 400+ STOCKS (AS ON   OCTOBER 23, 2008):   Rs. 92,127 Cr. THE COMBINED POOL OF THE PENSION AND PROVIDENT FUND IS AROUND RS. 70,000 CRORE OF HICH 5% RS. 3,500 CRORE IS EXPECTED TO HAVE COME INTO THE MARKET  D OMESTIC  F INANCIAL  M ARKETS -S OME  R ELEVANT  D ATA
C OMPOSITION  O F  D OMESTIC  S AVINGS  A ND  I NVESTMENT SOURCE: RESERVE BANK OF INDIA Particulars FY ’07 Savings(Rs. Crs.) YoY Growth (%) Financial Savings 7,58,751 27.5 Currency 65,427 25.9 Deposits 4,22,737 50.7 Shares & Debentures 47,916 63.7 Private Corporate Business 10,953 36.3 Banking 403 10.1 Units of UTI -310 -30.2 PSU Bonds 172 _ Mutual Funds(other than UTI)  36,700 73.6 Insurance Funds  1,13,900 36.3 Government Securities 39,197 -55.0 Provident  and  Pension Funds 69,571 11.0
T HE  I NSPIRING  I NDIA  G ROWTH  S TORY The Capital Markets have expectedly grown in tandem with the growth in the real economy
G ROWTH   H AS  A TTRACTED  F OREIGN  C APITAL The growth in the domestic economy has attracted significant inflows of FDI and FII FDI-FII inflow has grown at a CAGR of 22% over the last ten years
FII I NVESTMENTS- N OW  T HE  R EVERSE  F LOW PORTFOLIO  CAPITAL INFLOWS 2003-2008  USD 65 BN  APPROX. NET FII INVESTMENT IN 2007-O8  USD  16 BN AGGREGATE VALUE OF FII INVESTMENT AT PEAK  USD 220 BN AGGREGATE VALUE OF FII INVESTMENT AT PRESENT  USD  80 BN FII HOLDING OF AGGREGATE MARKET CAP AT PEAK  19% FII HOLDING OF AGGREGATE MARKET CAP AT PRESENT  17% FII SALE BETWEEN MAY-OCTOBER 2008  USD  9 BN* *  OF THIS, USD 3.5 BN IS ESTIMATED TO BE ACCOUNTED FOR BY ARBITRAGE FUNDS FDI DURING FIRST 8 MONTHS OF CY 2008 (246 DEALS)  USD  8.69  BN FDI DURING FIRST 8 MONTHS OF CY 2007 (260 DEALS)  USD 10.74 BN (A reduction of 19%(in value terms) yoy for the 8 months upto August 2008) FUND FLOWS/TRADING ACTIVITY FOR THE WEEK NOV 3-8   PURCHASE  SALES NET FLOWS FIIs   12,518  10,740  1,778 MUTUAL FUNDS  3,177  3,987  -810 FII NET FLOW FOR THE YEAR(IN USD MN)  -11,004 FII NET FLOW FOR THE WEEK(IN USD MN)  441 FII NET FLOW FOR THE YEAR(INR)   -50,869 MF NET FLOW FOR THE YEAR  9,534 TRADING   SPOT DERIVATIVES NSE  66,953  1,87,223 BSE  23,687 * Figures in Rs. Cr.
NSE N IFTY -T HE  I MPACT  I S  E VIDENT SIXTEEN-MONTH PERIOD BETWEEN JULY 1,2007 AND NOVEMBER 7,2008
NSE -T HE  A/D   R ATIO HAS HIT A NEW BOTTOM Advances & Declines Month Advances Declines Advance/Decline Ratio Oct-08 436 795 0.55 Sep-08 435 790 0.55 Aug-08 572 644 0.89 Jul-08 607 605 1.00 Jun-08 440 769 0.57 May-08 495 708 0.70 Apr-08 675 525 1.29 Mar-08 467 737 0.63 Feb-08 550 639 0.86 Jan-08 433 756 0.57 Dec-07 720 460 1.57 Nov-07 576 576 1.00 Oct-07 533 607 0.88 Sep-07 585 549 1.07 Aug-07 544 573 0.95 Jul-07 508 592 0.86 Jun-07 507 569 0.89 May-07 507 557 0.91 Apr-07 556 493 1.13 Mar-07 478 552 0.87 Feb-07 397 622 0.64 Jan-07 499 499 1.00
NSE-A S HARP   FALL  I N  A CTIVITY  A ND  V ALUATIONS MARKETCAP HAS FALLEN 48% OFF HIGH AVG. DAILY TURNOVER HAS DROPPED 24%  Month/  Year No of cos. listed* No. of cos available for trading* No. of trading days No. of securities traded # No. of trades (lakh) Traded Quantity (lakh) Turnover (Rs.cr) Average Daily Turnover (Rs.cr) Average Trade Size Demat Turnover Market Capitalisation (Rs.cr)* Oct-08 1,407 1,262 20 1,306 1,177 1,09,299 2,16,198 10,810 18,369 2,16,198 28,20,388 Sep-08 1,424 1,278 21 1,307 1,132 1,02,202 2,62,261 12,489 23,168 2,62,261 39,00,185 Aug-08 1,422 1,278 20 1,371 1,067 1,04,352 2,34,251 11,713 21,954 2,34,251 44,72,461 Jul-08 1,417 1,272 23 1,301 1,337 1,34,285 2,95,816 12,862 22,125 2,95,816 44,32,427 Jun-08 1,407 1262 21 1,356 1,115 1,08,548 2,64,428 12,592 23,716 2,64,428 41,03,651 May-08 1,398 1,252 20 1,300 1,071 1,15,014 2,77,923 13,896 25,950 2,77,923 50,98,873 Apr-08 1,390 1,244 20 1,293 1,079 1,14,280 2,71,227 13,561 25,137 2,71,227 54,42,780 2007-2008 1,381 1,236 251 1,264 11,727 14,98,469 35,51,038 14,148 30,281 35,51,038 48,58,122 2006-2007 1,228 1,084 249 1,191 7,846 8,55,456 19,45,285 7,812 24,793 19,45,285 33,67,350
M AJOR  I NDICES  H AVE   S EEN  S HARP  D ECLINES BSE MID-CAP AND BSE SMALL-CAP INDICES AT THEIR LIFETIME LOWS Index   High/Low Variation over(%)   24/10/08 Fortnight 52 Week Lifetime Fortnight Month Quarter Year BSE 30 8701.01 11483 / 8701 20873 / 8701 20873 / 392 -17.35 -36.45 -41.12 -53.00 NIFTY(S&P CNX) 2584.00 3519 / 2584 6288 / 2584 6288 / 284 -21.22 -37.90 -41.72 -52.99 BSE 500 3257.79 4255 / 3258 8882 / 3258 8882 / 792 -17.20 -37.67 -42.25 -54.97 BSE IT Sector 2598.31 2940 / 2537 4675 / 2537 4675 / 854 0.54 -23.96 -28.42 -43.27 BSE FMCG Sector 1817.91 1970 / 1818 2510 / 1818 2510/ 707 -2.29 -16.98 -14.21 -14.87 BSE Capital Goods 6610.89 8876 / 6611 20906 / 6611 20906 / 483 -17.19 -41.71 -45.45 -61.37 BSE Healthcare 2811.47 3405 / 2811 4549 / 2811 4549 / 733 -12.50 -27.47 -32.80 -27.05 BSE 200 1037.80 1359 / 1038 2744 / 1038 2744 / 129 -17.21 -37.49 -42.03 -54.21 BSE PSU 4422.56 5816 / 4423 11093 / 4423 11093 / 742 -20.11 -32.67 -34.27 -49.61 BANKEX 4649.87 6038 / 4650 12559 / 4650 12559 / 1665 -12.59 -32.48 -35.09 -51.89 CNX IT 3245.55 2819 / 2392 2819 / 2392 2819 / 1956 -3.33 -29.16 -34.41 -49.22 BSE Auto 2480.96 3429 / 2481 3429 / 2481 3429 / 2154 -23.80 -35.55 -34.21 -54.09 BSE Metal 4393.88 6987 / 4394 20298 / 4394 20298 / 4242 -32.84 -56.68 -65.39 -72.14 BSE Oil & Gas 5151.64 7623 / 5152 14127 / 5152 14127 / 2538 -29.16 -45.40 -48.55 -52.02 BSE Mid-Cap 3095.68 3892 / 3096 10113 / 3096 10113 / 3026 -15.79 -39.62 -44.53 -59.54 BSE Small-Cap 3661.83 4616 / 3662 13975 / 3662 13975 / 3662 -15.93 -39.98 -46.12 -60.38
D ECLINES IN VALUES OF THE LARGEST COMPANIES Company Name MARKET CAPITALISATION   AS ON  03-03-2008 AS ON  03-11-08 CHANGE % Reliance Industries Ltd. 3,35,030  2,26,161  -32% ONGC Ltd. 2,09,438  1,52,010  -27% NTPC Ltd. 1,55,798  1,24,671  -20% Bharti Airtel Ltd. 1,50,038  1,30,525  -13% NMDC Ltd. 1,44,783  59,867  -59% DLF Ltd. 1,21,844  43,141  -65% SBI Ltd. 1,21,474  78,760  -35% ICICI Bank Ltd. 1,13,974  47,975  -58% MMTC Ltd. 1,12,496  70,319  -37% Reliance Communication Ltd. 1,11,746  48,020  -57%
R EALTY  S TOCKS  H AVE  T AKEN  T HE  S EVEREST  B EATING   PRICE OCT 27 52 WK H/L   DROP  DLF 198 1,225/158 84% HDIL 136 1,432/90 91% ORBIT CORPORATION 47 1,079/42 96% PARSVNATH 43 598/36 93% SOBHA DEVELOPERS 108 1,041/100 90% UNITECH 42 546/26 92%
S HARP  D ECLINE  I N  IPO A CTIVITY  I N  2008 NUMBER OF IPOs(NSE Listed) in 2007:  95 VALUE OF FUNDS RAISED:   Rs. 39,140 crs. NUMBER OF IPOs(NSE Listed) in 2008:  36 VALUE OF FUNDS RAISED:    Rs. 16,839 crs. Company Name IPOs in 2008   Issue Date (DD/MM/YY) Issue Price List Price CMP  (3/11/08) Gain(%) Reliance Power Ltd. 15/01/08 450 548 109 -76 J Kumar Infraproject Ltd. 18/01/08 110 100 71 -35 Cords Cable Industries Ltd. 21/01/08 135 130 46 -66 OnMobile Global Ltd. 24/01/08 440 440 220 -50 Bang Overseas Ltd. 28/01/08 207 207 237 14 Shriram EPC Ltd. 29/01/08 300 290 146 -51 IRB Infrastructure Develop. 31/01/08 185 170 87 -53 GSS America Infotech Ltd. 11/02/08 400 400 153 -62 V-Guard Industries Ltd. 18/02/08 82 82 44 -47 Rural Eletrification Corp. 19/02/08 105 128 67 -36 Sita Shree Food Products 11/03/08 30 30 8 -74 Kiri Dyes & Chemicals Ltd. 25/03/08 150 151 97 -35 Aishwarya Telecom Ltd. 15/04/08 35 50 13 -64 Titagarh Wagons Ltd. 23/04/08 540 550 401 -26 Gokul Refoils & Solvents 08/05/08 195 203 200 2 Anu's Laboratories Ltd. 12/05/08 210 260 264 26 Bafna Pharmaceutical Ltd. 27/05/08 40 44 13 -66 Avon Corporation Ltd. 09/06/08 10 14 4 -57 Archidply Industries Ltd. 11/06/08 74 75 28 -62 Lotus Eye Care Hospital Ltd. 12/06/08 38 35 17 -56 KSK Energy Ventures Ltd. 23/06/08 240 220 146 -39 Somi Conveyer Belting 24/06/08 35 38 10 -71 Vishal Information Tech 21/07/08 150 150 332 122 Austral Coke & Projects Ltd. 07/08/08 196 206 75 -62 20 Microns Ltd. 08/09/08 55 50 17 -69 Alkali Metals Ltd. 07/10/08 103 0 103 0
Thank you

SIMS Presentation Nov 11,2008

  • 1.
    INDRANIL DEB PRESENTEDAT THE SYMBIOSIS INSTITUTE OF MANAGEMENT STUDIES(SIMS),PUNE ON TUESDAY, NOVEMBER 11,2008
  • 2.
    ■ Total valueof the world ’ s financial assets stood at $118 trillion at the end of 2003 up from $58 trillion in 1993 and $12 trillion in 1980. ■ The growth so far has been accompanied by a striking shift away from banks and towards market institutions as the primary financial intermediaries. ■ Declining share of bank deposits in the global financial stock-to 30 percent at present , from 45 percent in 1980- corresponding increase in the share of debt and equity securities. ■ The liquidity of world capital markets had increased as a result. Till the US Subprime crisis surfaced… G LOBAL F INANCIAL M ARKETS -A B ROAD P ERSPECTIVE SOURCE: MCKINSEY GLOBAL INSTITUTE
  • 3.
    T HE US S UB P RIME C RISIS -H OW, W HAT? MONETARY EASING LOW INTEREST REGIME HUGE CREDIT EXPANSION EXCESSIVE HOUSING ASSETS COLLAPSE 2000 2008 RATING AGENCIES INVESTMENT BANKS COMMERCIAL BANKS INSURANCE COMPANIES REGULATORS FEDERAL RESERVE GOVERNMENT LOSS TILL DATE USD 512 BN LEHMAN BROS. USD 210 BN BEAR STERNS USD 90 BN MERRILL LYNCH USD 52 BN AIG USD 41 BN WAMU USD 15 BN HUGE ASSET BUBBLE
  • 4.
    Those losses have ramifications that go beyond the bank. If its leverage ration remains the same, the bank may have to cut back its lending-in this case by $45 billion(3 billion x 15). That sudden tightening hurts the economy. W HAT R EALLY W ENT W RONG THE LEVERAGE MULTIPLIER 3 But leverage also amplifies losses. When the value of the bank’s portfolio drops by 2%, or $3 billion, 30% of the bank’s networth effectively gets wiped out; reducing the original capital of $10 billion to $7 billion By borrowing $15 for every $1 of capital-or leveraging up 15 times- an investment bank could turn $10 billion into a portfolio of $150 billion 2 1 0 $150 billion 0 $105 billion SOURCE: BUSINESS WEEK, JULY 28,.2008
  • 5.
    A R ECORD O F E VENTS Sl. No. Date/Period, International Event 1. June 2007 Hedge funds holding large stock of subprime mortgage run by Bear Sterns report huge losses. In July, these funds collapse. The contagion spreads to giants such as Citigroup, Merrill Lynch, Goldman Sachs and JP Morgan Chase . 2. October 24, 2007 Merrill Lynch reports writedowns of $7.9 billion- the largest reported loss as of that date 3. January 11,2008 Bank of America agrees to buy Countrywide. 4. March 16,2008 JP Morgan Chase concludes deal for $29 bn to buy-out Bear Sterns funded by the Federal Reserve. JP Morgan’s offer priced Bear’s shares at $ 2 each. 5. June 9,2008 Lehman Bros. announces a $2.8 billion loss, the first in its history. 6. July 11,2008 IndyMac is seized by the FDIC 7. July 13,2008 US Treasury announces a plan to bail-out Fannie Mae and Freddie Mac. 8. September 6,2008 US Treasury takes over Fannie Mae and Freddie Mac, which together own or support more than USD 5 trillion in mortgages. The US Treasury extends loans upto $200 bn to these companies. 9. September 15,2008 Bank of America finalises deal to acquire Merrill Lynch for $50 bn. The deal is finalized after BOA refuses to buy Lehman Bros. Unable to find a suitable buyer, Lehman files for bankruptcy under Chapter 11 10. September 16,2008 The Federal Reserve agrees to loan USD 85 bn to AIG as a bailout package in exchange for control of the group. The world’s largest insurance group, AIG lost billions of dollars in guarantees it wrote on mortgages that went into default through CDOs.
  • 6.
    E FFECT O N G LOBAL S TOCK M ARKETS SOURCE: THE ECONOMIST, Various Dates 2008 Country/Index Index ( Mar 18) %change on Dec 31,2007 Index ( Sep 17) %change on Dec 31,2007 Index ( Oct 29) %change on Dec 31,2007 In local crrncy In $ terms In local crrncy In $ terms In local crrncy In $ terms United States(DJIA) 12,392.7 -6.6 -6.6 10,609.7 -20.0 -20.0 8,991.0 -32.2 -32.2 United States(S&P 500) 1,330.7 -94. -9.4 1,156.4 -21.2 -21.2 930.1 -36.7 -36.7 United States(NASDAQ Composite) 2,268.3 -14.5 -14.5 2,098.9 -20.9 -20.9 1,657.2 -37.5 -37.5 Japan(Nikkei 225) 11,964.2 -21.8 -11.1 11,749.8 -23.2 -18.1 8,211.9 -46.4 -38.5 China(SSEA) 3,850.8 -30.3 -28.1 2,025.6 -63.3 -60.8 1,807.0 -67.3 -65.1 Britain(FTSE 100) 5,605.8 -13.2 -11.8 4,912.4 -23.9 -31.4 4,242.5 -34.3 -46.2 Canada(S&P TSX) 13,136.7 -5.0 -5.7 11,877.7 -14.1 -21.3 9,501.6 -31.3 -44.9 Euro Area(FTSE Euro 100) 1,121.0 -18.5 -12.0 941.5 -31.5 -33.5 763.7 -44.5 -51.2 France(CAC 40) 4,582.6 -18.4 -11.9 4,000.1 -28.7 -30.8 3,402.6 -39.4 -46.7 Germany(DAX) 6,393.4 -20.7 -14.4 5,861.0 -27.3 -29.5 4,808.7 -40.4 -47.6 Russia(RTS) 2,018.8 -15.6 -11.9 1,058.8 -51.9 -53.8 644.0 -69.1 -71.9 Australia(All Ordinary) 5,163.8 -19.6 -14.6 4,769.7 -25.7 -33.3 3,805.8 -40.7 -54.7 Hong Kong(Hang Seng) 21,384.6 -23.1 -22.8 17,637.2 -36.6 -36.5 12,702.1 -54.3 -54.1 Singapore(STI) 2,833.6 -18.2 -14.6 2,419.3 -30.2 -30.0 1,671.2 -51.8 -53.7 Argentina(MERV) 2,081.7 -3.3 -3.1 1,492.0 -30.7 -29.5 918.5 -57.5 -60.3 Brazil(BVSP) 61,932.0 -3.1 +1.1 45,908.0 -28.1 -31.4 34,845.0 -45.5 -54.4 India(BSE 30) 14,833.5 -26.9 -28.9 13,262.9 -34.6 -44.4 9,044.5 -55.4 -64.6
  • 7.
    S TOCK M ARKETS W ORLDWIDE F ALL THREE-MONTH CHANGE AS ON OCTOBER 10,2008 SOURCE: THE MINT(THE WALL STREET JOURNAL), OCTOBER 14,2008
  • 8.
    E FFECT O N G LOBAL C URRENCY M ARKETS SOURCE: THE MINT(THE WALL STREET JOURNAL), OCTOBER 14,2008 THREE-MONTH CHANGE AS ON OCTOBER 10,2008
  • 9.
    SOURCE: THE ECONOMIST,SEPTEMBER 20-26,2008
  • 10.
    T HE I NDIAN F INANCIAL S YSTEM -A N O VERVIEW MINISTRY OF FINANCE FINMIN DIRECT SUPERVISION SECURITIES AND EXCHANGE BOARD OF INDIA MUTUAL FUNDS FISCAL POLICY CAPITAL MARKETS SUPERVISION MONETARY POLICY, EXCHANGE RATE MANAGEMENT RESERVE BANK OF INDIA VENTURE CAPITAL FUNDS CAPITAL MARKETS STOCK EXCHANGES MERCHANT BANKS UNDERWRITERS STOCK BROKERS AND SUB-BROKERS CUTODIANS DEPOSITORIES & PARTICIPANTS FIIs INVESTORS NBFCs FINANCIAL INSTITUTIONS PRIMARY DEALERS COMMER-CIAL BANKS MONEY MARKET DERVTV MARKET FOREX MARKET
  • 11.
    T HE I NDIAN S TOCK M ARKETS- A N I NTRODUCTION ■ History of Indian Stock markets over 200 years old ■ First organised stock exchange-Native Share and Stock Brokers Association,1875(BSE) ■ 19 operating stock exchanges of which 4 are national ■ The largest, National Stock Exchange(NSE) established in 1992 ■ 1,407 Companies listed for trading on this exchange ■ The Market Cap of the NSE(Nov 8, 08) Rs. 29,34,900 Cr. MARKET PLAYERS: ■ Investors : Individuals, Firms, HUFs, Societies, Trusts, Companies, Mutual Funds, Financial Institutions and Foreign Institutional Investors(FIIs) ■ Issuers : Companies, Government, Mutual Funds and Banks ■ Intermediaries : Merchant Bankers, Registrars, Bankers, Credit Rating Agencies, Depositories ■ Regulators : Reserve Bank of India(RBI), Securities and Exchange Board of India(SEBI) and Ministry of Company Affairs ■ Appellate Authorities : Securities Appellate Tribunal(SAT), Company Law Appellate Tribunal
  • 12.
    T HE I NDIAN S TOCK M ARKETS- K EY P LAYERS Qualified Institutional Buyers(QIBs): (Clause 2.2.2B(v) of Depositories and Investor Protection Guidelines: A QIB shall mean a Public Financial Institution as defined in Section 4A of the Companies Act,1956; Scheduled Commercial Banks, Mutual Funds, Foreign Institutional Investors registered with SEBI, Foreign Venture Capital Funds registered with SEBI, State Industrial Development Corporations, Insurance Companies registered with IRDA; Provident Funds with a minimum corpus of Rs. 25 crores; Pension Funds with a minimum corpus of Rs. 25 crores.
  • 13.
    DOMESTIC SAVINGS RATEOF 35% APPROXIMATELY BETWEEN RS. 8.5-10LAC CRORE MOVES INTO SAVINGS AND INVESTMENT PRODUCTS SAVINGS AND FIXED DEPOSITS WITH BANKS MUTUAL FUNDS LIC POLICIES DEBENTURES SHARES THE DOMESTIC MUTUAL FUND INDUSTRY(AUM): OCTOBER 2008: Rs. 4,31,902 Crs. OCTOBER 2007: Rs. 5,31,639 Crs AUM OF THE INSURANCE INDUSTRY IS CURRENTLY EXPECTED TO BE AROUND 8.5 LAC CRORE(2007-08) IN FY’09 THE INSURANCE SECTOR IS EXPECTED TO HAVE COLLECTED AROUND 1.28 LAC CRORE OF WHICH 50% OR Rs. 64K CRORE IS EXPECTED TO HAVE COME INTO THE STOCK MARKET. IN 2007-08, INSURANCE INVESTED Rs. 55,000 CRORES THE TOTAL VALUE OF THE LIC PORTFOLIO COMPRISING 400+ STOCKS (AS ON OCTOBER 23, 2008): Rs. 92,127 Cr. THE COMBINED POOL OF THE PENSION AND PROVIDENT FUND IS AROUND RS. 70,000 CRORE OF HICH 5% RS. 3,500 CRORE IS EXPECTED TO HAVE COME INTO THE MARKET D OMESTIC F INANCIAL M ARKETS -S OME R ELEVANT D ATA
  • 14.
    C OMPOSITION O F D OMESTIC S AVINGS A ND I NVESTMENT SOURCE: RESERVE BANK OF INDIA Particulars FY ’07 Savings(Rs. Crs.) YoY Growth (%) Financial Savings 7,58,751 27.5 Currency 65,427 25.9 Deposits 4,22,737 50.7 Shares & Debentures 47,916 63.7 Private Corporate Business 10,953 36.3 Banking 403 10.1 Units of UTI -310 -30.2 PSU Bonds 172 _ Mutual Funds(other than UTI) 36,700 73.6 Insurance Funds 1,13,900 36.3 Government Securities 39,197 -55.0 Provident and Pension Funds 69,571 11.0
  • 15.
    T HE I NSPIRING I NDIA G ROWTH S TORY The Capital Markets have expectedly grown in tandem with the growth in the real economy
  • 16.
    G ROWTH H AS A TTRACTED F OREIGN C APITAL The growth in the domestic economy has attracted significant inflows of FDI and FII FDI-FII inflow has grown at a CAGR of 22% over the last ten years
  • 17.
    FII I NVESTMENTS-N OW T HE R EVERSE F LOW PORTFOLIO CAPITAL INFLOWS 2003-2008 USD 65 BN APPROX. NET FII INVESTMENT IN 2007-O8 USD 16 BN AGGREGATE VALUE OF FII INVESTMENT AT PEAK USD 220 BN AGGREGATE VALUE OF FII INVESTMENT AT PRESENT USD 80 BN FII HOLDING OF AGGREGATE MARKET CAP AT PEAK 19% FII HOLDING OF AGGREGATE MARKET CAP AT PRESENT 17% FII SALE BETWEEN MAY-OCTOBER 2008 USD 9 BN* * OF THIS, USD 3.5 BN IS ESTIMATED TO BE ACCOUNTED FOR BY ARBITRAGE FUNDS FDI DURING FIRST 8 MONTHS OF CY 2008 (246 DEALS) USD 8.69 BN FDI DURING FIRST 8 MONTHS OF CY 2007 (260 DEALS) USD 10.74 BN (A reduction of 19%(in value terms) yoy for the 8 months upto August 2008) FUND FLOWS/TRADING ACTIVITY FOR THE WEEK NOV 3-8 PURCHASE SALES NET FLOWS FIIs 12,518 10,740 1,778 MUTUAL FUNDS 3,177 3,987 -810 FII NET FLOW FOR THE YEAR(IN USD MN) -11,004 FII NET FLOW FOR THE WEEK(IN USD MN) 441 FII NET FLOW FOR THE YEAR(INR) -50,869 MF NET FLOW FOR THE YEAR 9,534 TRADING SPOT DERIVATIVES NSE 66,953 1,87,223 BSE 23,687 * Figures in Rs. Cr.
  • 18.
    NSE N IFTY-T HE I MPACT I S E VIDENT SIXTEEN-MONTH PERIOD BETWEEN JULY 1,2007 AND NOVEMBER 7,2008
  • 19.
    NSE -T HE A/D R ATIO HAS HIT A NEW BOTTOM Advances & Declines Month Advances Declines Advance/Decline Ratio Oct-08 436 795 0.55 Sep-08 435 790 0.55 Aug-08 572 644 0.89 Jul-08 607 605 1.00 Jun-08 440 769 0.57 May-08 495 708 0.70 Apr-08 675 525 1.29 Mar-08 467 737 0.63 Feb-08 550 639 0.86 Jan-08 433 756 0.57 Dec-07 720 460 1.57 Nov-07 576 576 1.00 Oct-07 533 607 0.88 Sep-07 585 549 1.07 Aug-07 544 573 0.95 Jul-07 508 592 0.86 Jun-07 507 569 0.89 May-07 507 557 0.91 Apr-07 556 493 1.13 Mar-07 478 552 0.87 Feb-07 397 622 0.64 Jan-07 499 499 1.00
  • 20.
    NSE-A S HARP FALL I N A CTIVITY A ND V ALUATIONS MARKETCAP HAS FALLEN 48% OFF HIGH AVG. DAILY TURNOVER HAS DROPPED 24% Month/ Year No of cos. listed* No. of cos available for trading* No. of trading days No. of securities traded # No. of trades (lakh) Traded Quantity (lakh) Turnover (Rs.cr) Average Daily Turnover (Rs.cr) Average Trade Size Demat Turnover Market Capitalisation (Rs.cr)* Oct-08 1,407 1,262 20 1,306 1,177 1,09,299 2,16,198 10,810 18,369 2,16,198 28,20,388 Sep-08 1,424 1,278 21 1,307 1,132 1,02,202 2,62,261 12,489 23,168 2,62,261 39,00,185 Aug-08 1,422 1,278 20 1,371 1,067 1,04,352 2,34,251 11,713 21,954 2,34,251 44,72,461 Jul-08 1,417 1,272 23 1,301 1,337 1,34,285 2,95,816 12,862 22,125 2,95,816 44,32,427 Jun-08 1,407 1262 21 1,356 1,115 1,08,548 2,64,428 12,592 23,716 2,64,428 41,03,651 May-08 1,398 1,252 20 1,300 1,071 1,15,014 2,77,923 13,896 25,950 2,77,923 50,98,873 Apr-08 1,390 1,244 20 1,293 1,079 1,14,280 2,71,227 13,561 25,137 2,71,227 54,42,780 2007-2008 1,381 1,236 251 1,264 11,727 14,98,469 35,51,038 14,148 30,281 35,51,038 48,58,122 2006-2007 1,228 1,084 249 1,191 7,846 8,55,456 19,45,285 7,812 24,793 19,45,285 33,67,350
  • 21.
    M AJOR I NDICES H AVE S EEN S HARP D ECLINES BSE MID-CAP AND BSE SMALL-CAP INDICES AT THEIR LIFETIME LOWS Index   High/Low Variation over(%)   24/10/08 Fortnight 52 Week Lifetime Fortnight Month Quarter Year BSE 30 8701.01 11483 / 8701 20873 / 8701 20873 / 392 -17.35 -36.45 -41.12 -53.00 NIFTY(S&P CNX) 2584.00 3519 / 2584 6288 / 2584 6288 / 284 -21.22 -37.90 -41.72 -52.99 BSE 500 3257.79 4255 / 3258 8882 / 3258 8882 / 792 -17.20 -37.67 -42.25 -54.97 BSE IT Sector 2598.31 2940 / 2537 4675 / 2537 4675 / 854 0.54 -23.96 -28.42 -43.27 BSE FMCG Sector 1817.91 1970 / 1818 2510 / 1818 2510/ 707 -2.29 -16.98 -14.21 -14.87 BSE Capital Goods 6610.89 8876 / 6611 20906 / 6611 20906 / 483 -17.19 -41.71 -45.45 -61.37 BSE Healthcare 2811.47 3405 / 2811 4549 / 2811 4549 / 733 -12.50 -27.47 -32.80 -27.05 BSE 200 1037.80 1359 / 1038 2744 / 1038 2744 / 129 -17.21 -37.49 -42.03 -54.21 BSE PSU 4422.56 5816 / 4423 11093 / 4423 11093 / 742 -20.11 -32.67 -34.27 -49.61 BANKEX 4649.87 6038 / 4650 12559 / 4650 12559 / 1665 -12.59 -32.48 -35.09 -51.89 CNX IT 3245.55 2819 / 2392 2819 / 2392 2819 / 1956 -3.33 -29.16 -34.41 -49.22 BSE Auto 2480.96 3429 / 2481 3429 / 2481 3429 / 2154 -23.80 -35.55 -34.21 -54.09 BSE Metal 4393.88 6987 / 4394 20298 / 4394 20298 / 4242 -32.84 -56.68 -65.39 -72.14 BSE Oil & Gas 5151.64 7623 / 5152 14127 / 5152 14127 / 2538 -29.16 -45.40 -48.55 -52.02 BSE Mid-Cap 3095.68 3892 / 3096 10113 / 3096 10113 / 3026 -15.79 -39.62 -44.53 -59.54 BSE Small-Cap 3661.83 4616 / 3662 13975 / 3662 13975 / 3662 -15.93 -39.98 -46.12 -60.38
  • 22.
    D ECLINES INVALUES OF THE LARGEST COMPANIES Company Name MARKET CAPITALISATION   AS ON 03-03-2008 AS ON 03-11-08 CHANGE % Reliance Industries Ltd. 3,35,030 2,26,161 -32% ONGC Ltd. 2,09,438 1,52,010 -27% NTPC Ltd. 1,55,798 1,24,671 -20% Bharti Airtel Ltd. 1,50,038 1,30,525 -13% NMDC Ltd. 1,44,783 59,867 -59% DLF Ltd. 1,21,844 43,141 -65% SBI Ltd. 1,21,474 78,760 -35% ICICI Bank Ltd. 1,13,974 47,975 -58% MMTC Ltd. 1,12,496 70,319 -37% Reliance Communication Ltd. 1,11,746 48,020 -57%
  • 23.
    R EALTY S TOCKS H AVE T AKEN T HE S EVEREST B EATING   PRICE OCT 27 52 WK H/L   DROP DLF 198 1,225/158 84% HDIL 136 1,432/90 91% ORBIT CORPORATION 47 1,079/42 96% PARSVNATH 43 598/36 93% SOBHA DEVELOPERS 108 1,041/100 90% UNITECH 42 546/26 92%
  • 24.
    S HARP D ECLINE I N IPO A CTIVITY I N 2008 NUMBER OF IPOs(NSE Listed) in 2007: 95 VALUE OF FUNDS RAISED: Rs. 39,140 crs. NUMBER OF IPOs(NSE Listed) in 2008: 36 VALUE OF FUNDS RAISED: Rs. 16,839 crs. Company Name IPOs in 2008   Issue Date (DD/MM/YY) Issue Price List Price CMP (3/11/08) Gain(%) Reliance Power Ltd. 15/01/08 450 548 109 -76 J Kumar Infraproject Ltd. 18/01/08 110 100 71 -35 Cords Cable Industries Ltd. 21/01/08 135 130 46 -66 OnMobile Global Ltd. 24/01/08 440 440 220 -50 Bang Overseas Ltd. 28/01/08 207 207 237 14 Shriram EPC Ltd. 29/01/08 300 290 146 -51 IRB Infrastructure Develop. 31/01/08 185 170 87 -53 GSS America Infotech Ltd. 11/02/08 400 400 153 -62 V-Guard Industries Ltd. 18/02/08 82 82 44 -47 Rural Eletrification Corp. 19/02/08 105 128 67 -36 Sita Shree Food Products 11/03/08 30 30 8 -74 Kiri Dyes & Chemicals Ltd. 25/03/08 150 151 97 -35 Aishwarya Telecom Ltd. 15/04/08 35 50 13 -64 Titagarh Wagons Ltd. 23/04/08 540 550 401 -26 Gokul Refoils & Solvents 08/05/08 195 203 200 2 Anu's Laboratories Ltd. 12/05/08 210 260 264 26 Bafna Pharmaceutical Ltd. 27/05/08 40 44 13 -66 Avon Corporation Ltd. 09/06/08 10 14 4 -57 Archidply Industries Ltd. 11/06/08 74 75 28 -62 Lotus Eye Care Hospital Ltd. 12/06/08 38 35 17 -56 KSK Energy Ventures Ltd. 23/06/08 240 220 146 -39 Somi Conveyer Belting 24/06/08 35 38 10 -71 Vishal Information Tech 21/07/08 150 150 332 122 Austral Coke & Projects Ltd. 07/08/08 196 206 75 -62 20 Microns Ltd. 08/09/08 55 50 17 -69 Alkali Metals Ltd. 07/10/08 103 0 103 0
  • 25.