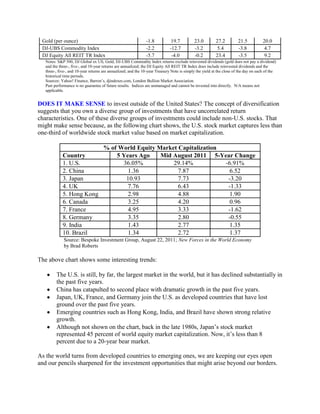
Hyre Weekly Commentary
                                     November 28, 2011
The Markets
“It’s a small world after all.”

Living in an age of jet travel, the internet and mobile communication have its advantages. It
makes our world of 7 billion people seem a bit smaller since we’re just one plane ride or “one
boot of the computer” away from connecting with anyone in the world.

But, along with the good comes the bad.

Worldwide interconnectedness not only connects us socially, it also connects us economically.
What happens in China, for example, doesn’t necessarily stay in China. A collapse of their real
estate market or a revolt against the government could have repercussions around the world.

A bit closer to home, the sovereign debt problems in Europe are helping keep a lid on stock
prices in the U.S., according to MarketWatch. As the debt problem spreads from the peripheral
euro-zone countries to the core in Germany -- which had a failed bond auction last week -- the
U.S. is caught in the cross fire.

What’s disappointing about being joined at the hip with Europe is that the U.S. economy is
actually performing okay. Consider these positive points:

        Our trade deficit declined for the third month in September, thanks to rising exports.
        Industrial production rose strongly in October.
        Residential building improvements are touching record highs.
        October car sales hit the highest level since February.
        Consumer sentiment in November rose to the highest level since June, according to data
        from the University of Michigan and Thomson Reuters.
        Personal income in October showed the largest increase since March.
        Black Friday sales rose sharply from a year ago.
    Sources: Economist; MarketWatch

Granted, these improvements are coming off a low base and are so fragile that the modest
recovery in the U.S. could get derailed if the euro-zone situation continues to deteriorate. Our
small world is now focused on Europe and whether it can pull out of its debt debacle. Time to do
so is running out for our friends across the pond.

            Data as of 11/25/11            1-Week    Y-T-D    1-Year   3-Year   5-Year   10-Year
 Standard & Poor's 500 (Domestic Stocks)     -4.7%   -7.9%     -2.6%   10.6%     -3.5%    0.0%
 DJ Global ex US (Foreign Stocks)            -5.7     -21.2    -17.5     9.7      -5.3     3.8
 10-year Treasury Note (Yield Only)           2.0      N/A      2.9      3.1       4.5     5.0
Gold (per ounce)                                              -1.8            19.7         23.0         27.2          21.5           20.0
 DJ-UBS Commodity Index                                        -2.2           -12.7         -3.2          5.4          -3.8            4.7
 DJ Equity All REIT TR Index                                   -5.7            -4.0         -0.2         23.4          -3.5            9.2
   Notes: S&P 500, DJ Global ex US, Gold, DJ-UBS Commodity Index returns exclude reinvested dividends (gold does not pay a dividend)
   and the three-, five-, and 10-year returns are annualized; the DJ Equity All REIT TR Index does include reinvested dividends and the
   three-, five-, and 10-year returns are annualized; and the 10-year Treasury Note is simply the yield at the close of the day on each of the
   historical time periods.
   Sources: Yahoo! Finance, Barron’s, djindexes.com, London Bullion Market Association.
   Past performance is no guarantee of future results. Indices are unmanaged and cannot be invested into directly. N/A means not
   applicable.


DOES IT MAKE SENSE to invest outside of the United States? The concept of diversification
suggests that you own a diverse group of investments that have uncorrelated return
characteristics. One of these diverse groups of investments could include non-U.S. stocks. That
might make sense because, as the following chart shows, the U.S. stock market captures less than
one-third of worldwide stock market value based on market capitalization.

                          % of World Equity Market Capitalization
             Country          5 Years Ago    Mid August 2011 5-Year Change
             1. U.S.            36.05%           29.14%           -6.91%
             2. China             1.36             7.87             6.52
             3. Japan            10.93             7.73            -3.20
             4. UK                7.76             6.43            -1.33
             5. Hong Kong         2.98             4.88             1.90
             6. Canada            3.25             4.20             0.96
             7. France            4.95             3.33            -1.62
             8. Germany           3.35             2.80            -0.55
             9. India             1.43             2.77             1.35
             10. Brazil           1.34             2.72             1.37
              Source: Bespoke Investment Group, August 22, 2011; New Forces in the World Economy
              by Brad Roberts

The above chart shows some interesting trends:

         The U.S. is still, by far, the largest market in the world, but it has declined substantially in
         the past five years.
         China has catapulted to second place with dramatic growth in the past five years.
         Japan, UK, France, and Germany join the U.S. as developed countries that have lost
         ground over the past five years.
         Emerging countries such as Hong Kong, India, and Brazil have shown strong relative
         growth.
         Although not shown on the chart, back in the late 1980s, Japan’s stock market
         represented 45 percent of world equity market capitalization. Now, it’s less than 8
         percent due to a 20-year bear market.

As the world turns from developed countries to emerging ones, we are keeping our eyes open
and our pencils sharpened for the investment opportunities that might arise beyond our borders.
Weekly Focus – Think About It
“We live in a wonderful world that is full of beauty, charm and adventure. There is no end to the
adventures we can have if only we seek them with our eyes open.”
                                  --Jawaharial Nehru, First prime minister of independent India

Best regards,


Jim Hyre, CFP®
Registered Principal

P.S. Please feel free to forward this commentary to family, friends, or colleagues. If you would
like us to add them to the list, please reply to this e-mail with their e-mail address and we will
ask for their permission to be added.

Securities offered through Raymond James Financial Services, Inc., Member FINRA/SIPC.

* The Standard & Poor's 500 (S&P 500) is an unmanaged group of securities considered to be representative of the stock market in
general.
* The Dow Jones Industrial Average is a price-weighted index of 30 actively traded blue-chip stocks.
* The NASDAQ Composite Index is an unmanaged, market-weighted index of all over-the-counter common stocks traded on the
National Association of Securities Dealers Automated Quotation System.
* Gold represents the London afternoon gold price fix as reported by www.usagold.com.
* The DJ/AIG Commodity Index is designed to be a highly liquid and diversified benchmark for the commodity futures market. The
Index is composed of futures contracts on 19 physical commodities and was launched on July 14, 1998.
* The 10-year Treasury Note represents debt owed by the United States Treasury to the public. Since the U.S. Government is seen
as a risk-free borrower, investors use the 10-year Treasury Note as a benchmark for the long-term bond market.
* The DJ Equity All REIT TR Index measures the total return performance of the equity subcategory of the Real Estate Investment
Trust (REIT) industry as calculated by Dow Jones
* Yahoo! Finance is the source for any reference to the performance of an index between two specific periods.
* Opinions expressed are subject to change without notice and are not intended as investment advice or to predict future
performance.
* Consult your financial professional before making any investment decision.
* You cannot invest directly in an index.
* Past performance does not guarantee future results. mc101507
* This newsletter was prepared by PEAK for use by James Hyre, CFP®, registered principal
* If you would prefer not to receive this Weekly Newsletter, please contact our office via e-mail or mail your request to 2074 Arlington
Ave, Upper Arlington, OH 43221.
* The information contained in this report does not purport to be a complete description of the securities, markets, or developments
referred to in this material. The information has been obtained from sources considered to be reliable, but we do not guarantee that
the forgoing material is accurate or complete. Any opinions are those of Jim Hyre and not necessary those of RJFS or Raymond
James. Expressions of opinion are as of this date and are subject to change without notice. This information is not intended as a
solicitation or an offer to buy or sell any security to herein. Tax or legal matters should be discussed with the appropriate
professional.


Jim Hyre, CFP®
Registered Principal
Raymond James Financial Services, Inc.
Member FINRA/SIPC
2074 Arlington Ave.
Upper Arlington, OH 43221
614.225.9400
614.225.9400 Fax
877.228.9515 Toll Free

www.hyreandassociates.com


Find Us Here:


Raymond James Financial Services does not accept orders and/or instructions regarding your account by email, voice mail, fax or
any alternate method. Transactional details do not supersede normal trade confirmations or statements. Email sent through the
Internet is not secure or confidential. Raymond James Financial Services reserves the right to monitor all email. Any information
provided in this email has been prepared from sources believed to be reliable, but is not guaranteed by Raymond James Financial
Services and is not a complete summary or statement of all available data necessary for making an investment decision. Any
information provided is for informational purposes only and does not constitute a recommendation. Raymond James Financial
Services and its employees may own options, rights or warrants to purchase any of the securities mentioned in email. This email is
intended only for the person or entity to which it is addressed and may contain confidential and/or privileged material. Any review,
transmission, dissemination or other use of, or taking of any action in reliance upon, this information by persons or entities other
than the intended recipient is prohibited. If you received this message in error, please contact the sender immediately and delete
the material from your computer.

Hyre Weekly Commentary

  • 1.
    Hyre Weekly Commentary November 28, 2011 The Markets “It’s a small world after all.” Living in an age of jet travel, the internet and mobile communication have its advantages. It makes our world of 7 billion people seem a bit smaller since we’re just one plane ride or “one boot of the computer” away from connecting with anyone in the world. But, along with the good comes the bad. Worldwide interconnectedness not only connects us socially, it also connects us economically. What happens in China, for example, doesn’t necessarily stay in China. A collapse of their real estate market or a revolt against the government could have repercussions around the world. A bit closer to home, the sovereign debt problems in Europe are helping keep a lid on stock prices in the U.S., according to MarketWatch. As the debt problem spreads from the peripheral euro-zone countries to the core in Germany -- which had a failed bond auction last week -- the U.S. is caught in the cross fire. What’s disappointing about being joined at the hip with Europe is that the U.S. economy is actually performing okay. Consider these positive points: Our trade deficit declined for the third month in September, thanks to rising exports. Industrial production rose strongly in October. Residential building improvements are touching record highs. October car sales hit the highest level since February. Consumer sentiment in November rose to the highest level since June, according to data from the University of Michigan and Thomson Reuters. Personal income in October showed the largest increase since March. Black Friday sales rose sharply from a year ago. Sources: Economist; MarketWatch Granted, these improvements are coming off a low base and are so fragile that the modest recovery in the U.S. could get derailed if the euro-zone situation continues to deteriorate. Our small world is now focused on Europe and whether it can pull out of its debt debacle. Time to do so is running out for our friends across the pond. Data as of 11/25/11 1-Week Y-T-D 1-Year 3-Year 5-Year 10-Year Standard & Poor's 500 (Domestic Stocks) -4.7% -7.9% -2.6% 10.6% -3.5% 0.0% DJ Global ex US (Foreign Stocks) -5.7 -21.2 -17.5 9.7 -5.3 3.8 10-year Treasury Note (Yield Only) 2.0 N/A 2.9 3.1 4.5 5.0
  • 2.
    Gold (per ounce) -1.8 19.7 23.0 27.2 21.5 20.0 DJ-UBS Commodity Index -2.2 -12.7 -3.2 5.4 -3.8 4.7 DJ Equity All REIT TR Index -5.7 -4.0 -0.2 23.4 -3.5 9.2 Notes: S&P 500, DJ Global ex US, Gold, DJ-UBS Commodity Index returns exclude reinvested dividends (gold does not pay a dividend) and the three-, five-, and 10-year returns are annualized; the DJ Equity All REIT TR Index does include reinvested dividends and the three-, five-, and 10-year returns are annualized; and the 10-year Treasury Note is simply the yield at the close of the day on each of the historical time periods. Sources: Yahoo! Finance, Barron’s, djindexes.com, London Bullion Market Association. Past performance is no guarantee of future results. Indices are unmanaged and cannot be invested into directly. N/A means not applicable. DOES IT MAKE SENSE to invest outside of the United States? The concept of diversification suggests that you own a diverse group of investments that have uncorrelated return characteristics. One of these diverse groups of investments could include non-U.S. stocks. That might make sense because, as the following chart shows, the U.S. stock market captures less than one-third of worldwide stock market value based on market capitalization. % of World Equity Market Capitalization Country 5 Years Ago Mid August 2011 5-Year Change 1. U.S. 36.05% 29.14% -6.91% 2. China 1.36 7.87 6.52 3. Japan 10.93 7.73 -3.20 4. UK 7.76 6.43 -1.33 5. Hong Kong 2.98 4.88 1.90 6. Canada 3.25 4.20 0.96 7. France 4.95 3.33 -1.62 8. Germany 3.35 2.80 -0.55 9. India 1.43 2.77 1.35 10. Brazil 1.34 2.72 1.37 Source: Bespoke Investment Group, August 22, 2011; New Forces in the World Economy by Brad Roberts The above chart shows some interesting trends: The U.S. is still, by far, the largest market in the world, but it has declined substantially in the past five years. China has catapulted to second place with dramatic growth in the past five years. Japan, UK, France, and Germany join the U.S. as developed countries that have lost ground over the past five years. Emerging countries such as Hong Kong, India, and Brazil have shown strong relative growth. Although not shown on the chart, back in the late 1980s, Japan’s stock market represented 45 percent of world equity market capitalization. Now, it’s less than 8 percent due to a 20-year bear market. As the world turns from developed countries to emerging ones, we are keeping our eyes open and our pencils sharpened for the investment opportunities that might arise beyond our borders.
  • 3.
    Weekly Focus –Think About It “We live in a wonderful world that is full of beauty, charm and adventure. There is no end to the adventures we can have if only we seek them with our eyes open.” --Jawaharial Nehru, First prime minister of independent India Best regards, Jim Hyre, CFP® Registered Principal P.S. Please feel free to forward this commentary to family, friends, or colleagues. If you would like us to add them to the list, please reply to this e-mail with their e-mail address and we will ask for their permission to be added. Securities offered through Raymond James Financial Services, Inc., Member FINRA/SIPC. * The Standard & Poor's 500 (S&P 500) is an unmanaged group of securities considered to be representative of the stock market in general. * The Dow Jones Industrial Average is a price-weighted index of 30 actively traded blue-chip stocks. * The NASDAQ Composite Index is an unmanaged, market-weighted index of all over-the-counter common stocks traded on the National Association of Securities Dealers Automated Quotation System. * Gold represents the London afternoon gold price fix as reported by www.usagold.com. * The DJ/AIG Commodity Index is designed to be a highly liquid and diversified benchmark for the commodity futures market. The Index is composed of futures contracts on 19 physical commodities and was launched on July 14, 1998. * The 10-year Treasury Note represents debt owed by the United States Treasury to the public. Since the U.S. Government is seen as a risk-free borrower, investors use the 10-year Treasury Note as a benchmark for the long-term bond market. * The DJ Equity All REIT TR Index measures the total return performance of the equity subcategory of the Real Estate Investment Trust (REIT) industry as calculated by Dow Jones * Yahoo! Finance is the source for any reference to the performance of an index between two specific periods. * Opinions expressed are subject to change without notice and are not intended as investment advice or to predict future performance. * Consult your financial professional before making any investment decision. * You cannot invest directly in an index. * Past performance does not guarantee future results. mc101507 * This newsletter was prepared by PEAK for use by James Hyre, CFP®, registered principal * If you would prefer not to receive this Weekly Newsletter, please contact our office via e-mail or mail your request to 2074 Arlington Ave, Upper Arlington, OH 43221. * The information contained in this report does not purport to be a complete description of the securities, markets, or developments referred to in this material. The information has been obtained from sources considered to be reliable, but we do not guarantee that the forgoing material is accurate or complete. Any opinions are those of Jim Hyre and not necessary those of RJFS or Raymond James. Expressions of opinion are as of this date and are subject to change without notice. This information is not intended as a solicitation or an offer to buy or sell any security to herein. Tax or legal matters should be discussed with the appropriate professional. Jim Hyre, CFP® Registered Principal Raymond James Financial Services, Inc. Member FINRA/SIPC 2074 Arlington Ave. Upper Arlington, OH 43221 614.225.9400 614.225.9400 Fax
  • 4.
    877.228.9515 Toll Free www.hyreandassociates.com FindUs Here: Raymond James Financial Services does not accept orders and/or instructions regarding your account by email, voice mail, fax or any alternate method. Transactional details do not supersede normal trade confirmations or statements. Email sent through the Internet is not secure or confidential. Raymond James Financial Services reserves the right to monitor all email. Any information provided in this email has been prepared from sources believed to be reliable, but is not guaranteed by Raymond James Financial Services and is not a complete summary or statement of all available data necessary for making an investment decision. Any information provided is for informational purposes only and does not constitute a recommendation. Raymond James Financial Services and its employees may own options, rights or warrants to purchase any of the securities mentioned in email. This email is intended only for the person or entity to which it is addressed and may contain confidential and/or privileged material. Any review, transmission, dissemination or other use of, or taking of any action in reliance upon, this information by persons or entities other than the intended recipient is prohibited. If you received this message in error, please contact the sender immediately and delete the material from your computer.