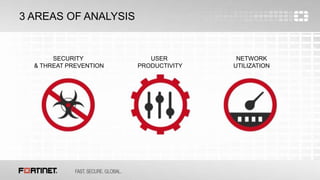
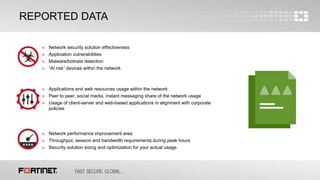
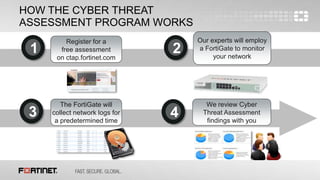
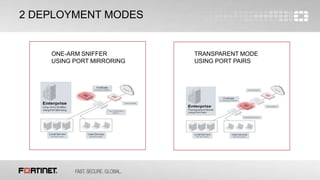
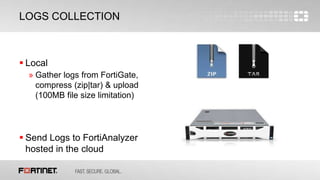
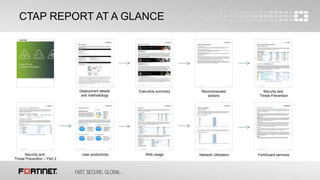
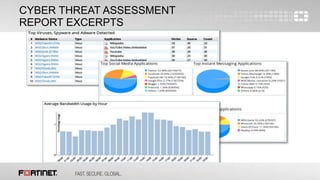
© Copyright Fortinet Inc. All rights reserved.
Cyber Threat Assessment
2
3
it’s
FAST
and
FREE
ASSESS YOUR NETWORK
PERFORMANCE AND SECURITY
4
3 AREAS OF ANALYSIS
SECURITY
& THREAT PREVENTION
USER
PRODUCTIVITY
NETWORK
UTILIZATION
5
REPORTED DATA
» Network security solution effectiveness
» Application vulnerabilities
» Malware/botnets detection
» “At risk” devices within the network
» Applications and web resources usage within the network
» Peer to peer, social media, instant messaging share of the network usage
» Usage of client-server and web-based applications in alignment with corporate
policies
» Network performance improvement area
» Throughput, session and bandwidth requirements during peak hours
» Security solution sizing and optimization for your actual usage
6
HOW THE CYBER THREAT
ASSESSMENT PROGRAM WORKS
Register for a
free assessment
on ctap.fortinet.com
1
Our experts will employ
a FortiGate to monitor
your network
2
The FortiGate will
collect network logs for
a predetermined time
3
We review Cyber
Threat Assessment
findings with you
4
7
2 DEPLOYMENT MODES
TRANSPARENT MODE
USING PORT PAIRS
ONE-ARM SNIFFER
USING PORT MIRRORING
8
LOGS COLLECTION
 Local
» Gather logs from FortiGate,
compress (zip|tar) & upload
(100MB file size limitation)
 Send Logs to FortiAnalyzer
hosted in the cloud
9
CTAP REPORT AT A GLANCE
10
CTAP REPORT AT A GLANCE
Deployment details
and methodology
Executive summary Recommended
actions
Security and
Threat Prevention
Security and
Threat Prevention – Part 2
User productivity Web usage Network Utilization FortiGuard services
11
CYBER THREAT ASSESSMENT
REPORT EXCERPTS
12
IMPROVEMENT AREA ANALYSIS
 After a week of log collection
 Findings introduction thanks to the report
 Enhancements proposal done by your trusted advisor
CYBER THREAT ASSESSMENT

CYBER THREAT ASSESSMENT

  • 1.
    © Copyright FortinetInc. All rights reserved. Cyber Threat Assessment
  • 2.
  • 3.
  • 4.
    4 3 AREAS OFANALYSIS SECURITY & THREAT PREVENTION USER PRODUCTIVITY NETWORK UTILIZATION
  • 5.
    5 REPORTED DATA » Networksecurity solution effectiveness » Application vulnerabilities » Malware/botnets detection » “At risk” devices within the network » Applications and web resources usage within the network » Peer to peer, social media, instant messaging share of the network usage » Usage of client-server and web-based applications in alignment with corporate policies » Network performance improvement area » Throughput, session and bandwidth requirements during peak hours » Security solution sizing and optimization for your actual usage
  • 6.
    6 HOW THE CYBERTHREAT ASSESSMENT PROGRAM WORKS Register for a free assessment on ctap.fortinet.com 1 Our experts will employ a FortiGate to monitor your network 2 The FortiGate will collect network logs for a predetermined time 3 We review Cyber Threat Assessment findings with you 4
  • 7.
    7 2 DEPLOYMENT MODES TRANSPARENTMODE USING PORT PAIRS ONE-ARM SNIFFER USING PORT MIRRORING
  • 8.
    8 LOGS COLLECTION  Local »Gather logs from FortiGate, compress (zip|tar) & upload (100MB file size limitation)  Send Logs to FortiAnalyzer hosted in the cloud
  • 9.
  • 10.
    10 CTAP REPORT ATA GLANCE Deployment details and methodology Executive summary Recommended actions Security and Threat Prevention Security and Threat Prevention – Part 2 User productivity Web usage Network Utilization FortiGuard services
  • 11.
  • 12.
    12 IMPROVEMENT AREA ANALYSIS After a week of log collection  Findings introduction thanks to the report  Enhancements proposal done by your trusted advisor

Editor's Notes

  • #4 It’s fast: 1 week of logs collection