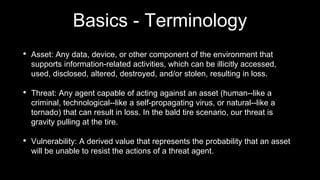
Quantitative Risk Analysis
Iftach Ian Amit
CSO, Cimpress
September 3, 2019
First things first
hat we’ve been walking into boardrooms with, asking for budget an
Basics - Terminology
• Asset: Any data, device, or other component of the environment that
supports information-related activities, which can be illicitly accessed,
used, disclosed, altered, destroyed, and/or stolen, resulting in loss.
• Threat: Any agent capable of acting against an asset (human--like a
criminal, technological--like a self-propagating virus, or natural--like a
tornado) that can result in loss. In the bald tire scenario, our threat is
gravity pulling at the tire.
• Vulnerability: A derived value that represents the probability that an asset
will be unable to resist the actions of a threat agent.
Vulnerability != Risk
Risk
• Risk...
• The probable frequency and probable magnitude of future loss
• In other words...
• How often bad things are likely to happen,
and how bad they’re likely to be when they do happen.
Defining a Scenario
Determine the risk ($) that cyber criminals gain unauthorized access to
the customer web-portal and steal PII from the customer database.”
Threat community - Threat event – Consequence - Information asset - Supporting asset
Threat
Actor
Profile
Controls
Threat Actor Profile
• Internal / External
• Motive
• Intent
• Capability
• Personal risk tolerance
• Concern for collateral damage
• In our model:
• Threat Event Frequency (x
times / year)
• Threat Capability (in % - how
capable is this specific attacker)
• Probability of Action (in %)
• Mostly affect: Resistance Strength (in % how effective are our controls in
stopping attackers on the TCap continuum)
• Also affect: TCap, PoA, Loss Magnitude
• TCap: training and awareness reduces insider threat; cameras can reduce
the time an attacker has to complete a breach of an office door.
• PoA: Visible/known controls may reduce the probability of certain threat
communities from taking action
• Loss Magnitude: controlling the blast radius of an incident can reduce the
losses associated with it.
Controls
• How much $ is expected to be lost because
of the scenario.
• Forms of loss:
• Productivity
• Response
• Replacement
• Competitive Advantage
• Fines & Judgment
• Reputation
Loss Magnitude
• Primary & Secondary Stakeholders (to
identify primary vs secondary losses).
• Secondary Stakeholders: Customers,
Competitors, Community,
Government, Media, Partners.
• SLEF?
Putting it all together
Download: https://publications.opengroup.org/i181
Or: http://tiny.cc/OpenFAIR
Putting it all together
A few words on Frameworks…
• Don’t fully buy-into them ;-)
• Borrow, steal, adapt. Make sure it works for YOUR organization.
• Mix quantitative (like FAIR) with qualitative (like CSF) where applicable

Cyber Risk Quantification - CyberTLV

  • 1.
    Quantitative Risk Analysis IftachIan Amit CSO, Cimpress September 3, 2019
  • 2.
  • 3.
    hat we’ve beenwalking into boardrooms with, asking for budget an
  • 4.
    Basics - Terminology •Asset: Any data, device, or other component of the environment that supports information-related activities, which can be illicitly accessed, used, disclosed, altered, destroyed, and/or stolen, resulting in loss. • Threat: Any agent capable of acting against an asset (human--like a criminal, technological--like a self-propagating virus, or natural--like a tornado) that can result in loss. In the bald tire scenario, our threat is gravity pulling at the tire. • Vulnerability: A derived value that represents the probability that an asset will be unable to resist the actions of a threat agent.
  • 5.
  • 6.
    Risk • Risk... • Theprobable frequency and probable magnitude of future loss • In other words... • How often bad things are likely to happen, and how bad they’re likely to be when they do happen.
  • 9.
    Defining a Scenario Determinethe risk ($) that cyber criminals gain unauthorized access to the customer web-portal and steal PII from the customer database.” Threat community - Threat event – Consequence - Information asset - Supporting asset
  • 10.
  • 11.
    Threat Actor Profile •Internal / External • Motive • Intent • Capability • Personal risk tolerance • Concern for collateral damage • In our model: • Threat Event Frequency (x times / year) • Threat Capability (in % - how capable is this specific attacker) • Probability of Action (in %)
  • 12.
    • Mostly affect:Resistance Strength (in % how effective are our controls in stopping attackers on the TCap continuum) • Also affect: TCap, PoA, Loss Magnitude • TCap: training and awareness reduces insider threat; cameras can reduce the time an attacker has to complete a breach of an office door. • PoA: Visible/known controls may reduce the probability of certain threat communities from taking action • Loss Magnitude: controlling the blast radius of an incident can reduce the losses associated with it. Controls
  • 13.
    • How much$ is expected to be lost because of the scenario. • Forms of loss: • Productivity • Response • Replacement • Competitive Advantage • Fines & Judgment • Reputation Loss Magnitude • Primary & Secondary Stakeholders (to identify primary vs secondary losses). • Secondary Stakeholders: Customers, Competitors, Community, Government, Media, Partners. • SLEF?
  • 14.
    Putting it alltogether Download: https://publications.opengroup.org/i181 Or: http://tiny.cc/OpenFAIR
  • 15.
  • 16.
    A few wordson Frameworks… • Don’t fully buy-into them ;-) • Borrow, steal, adapt. Make sure it works for YOUR organization. • Mix quantitative (like FAIR) with qualitative (like CSF) where applicable