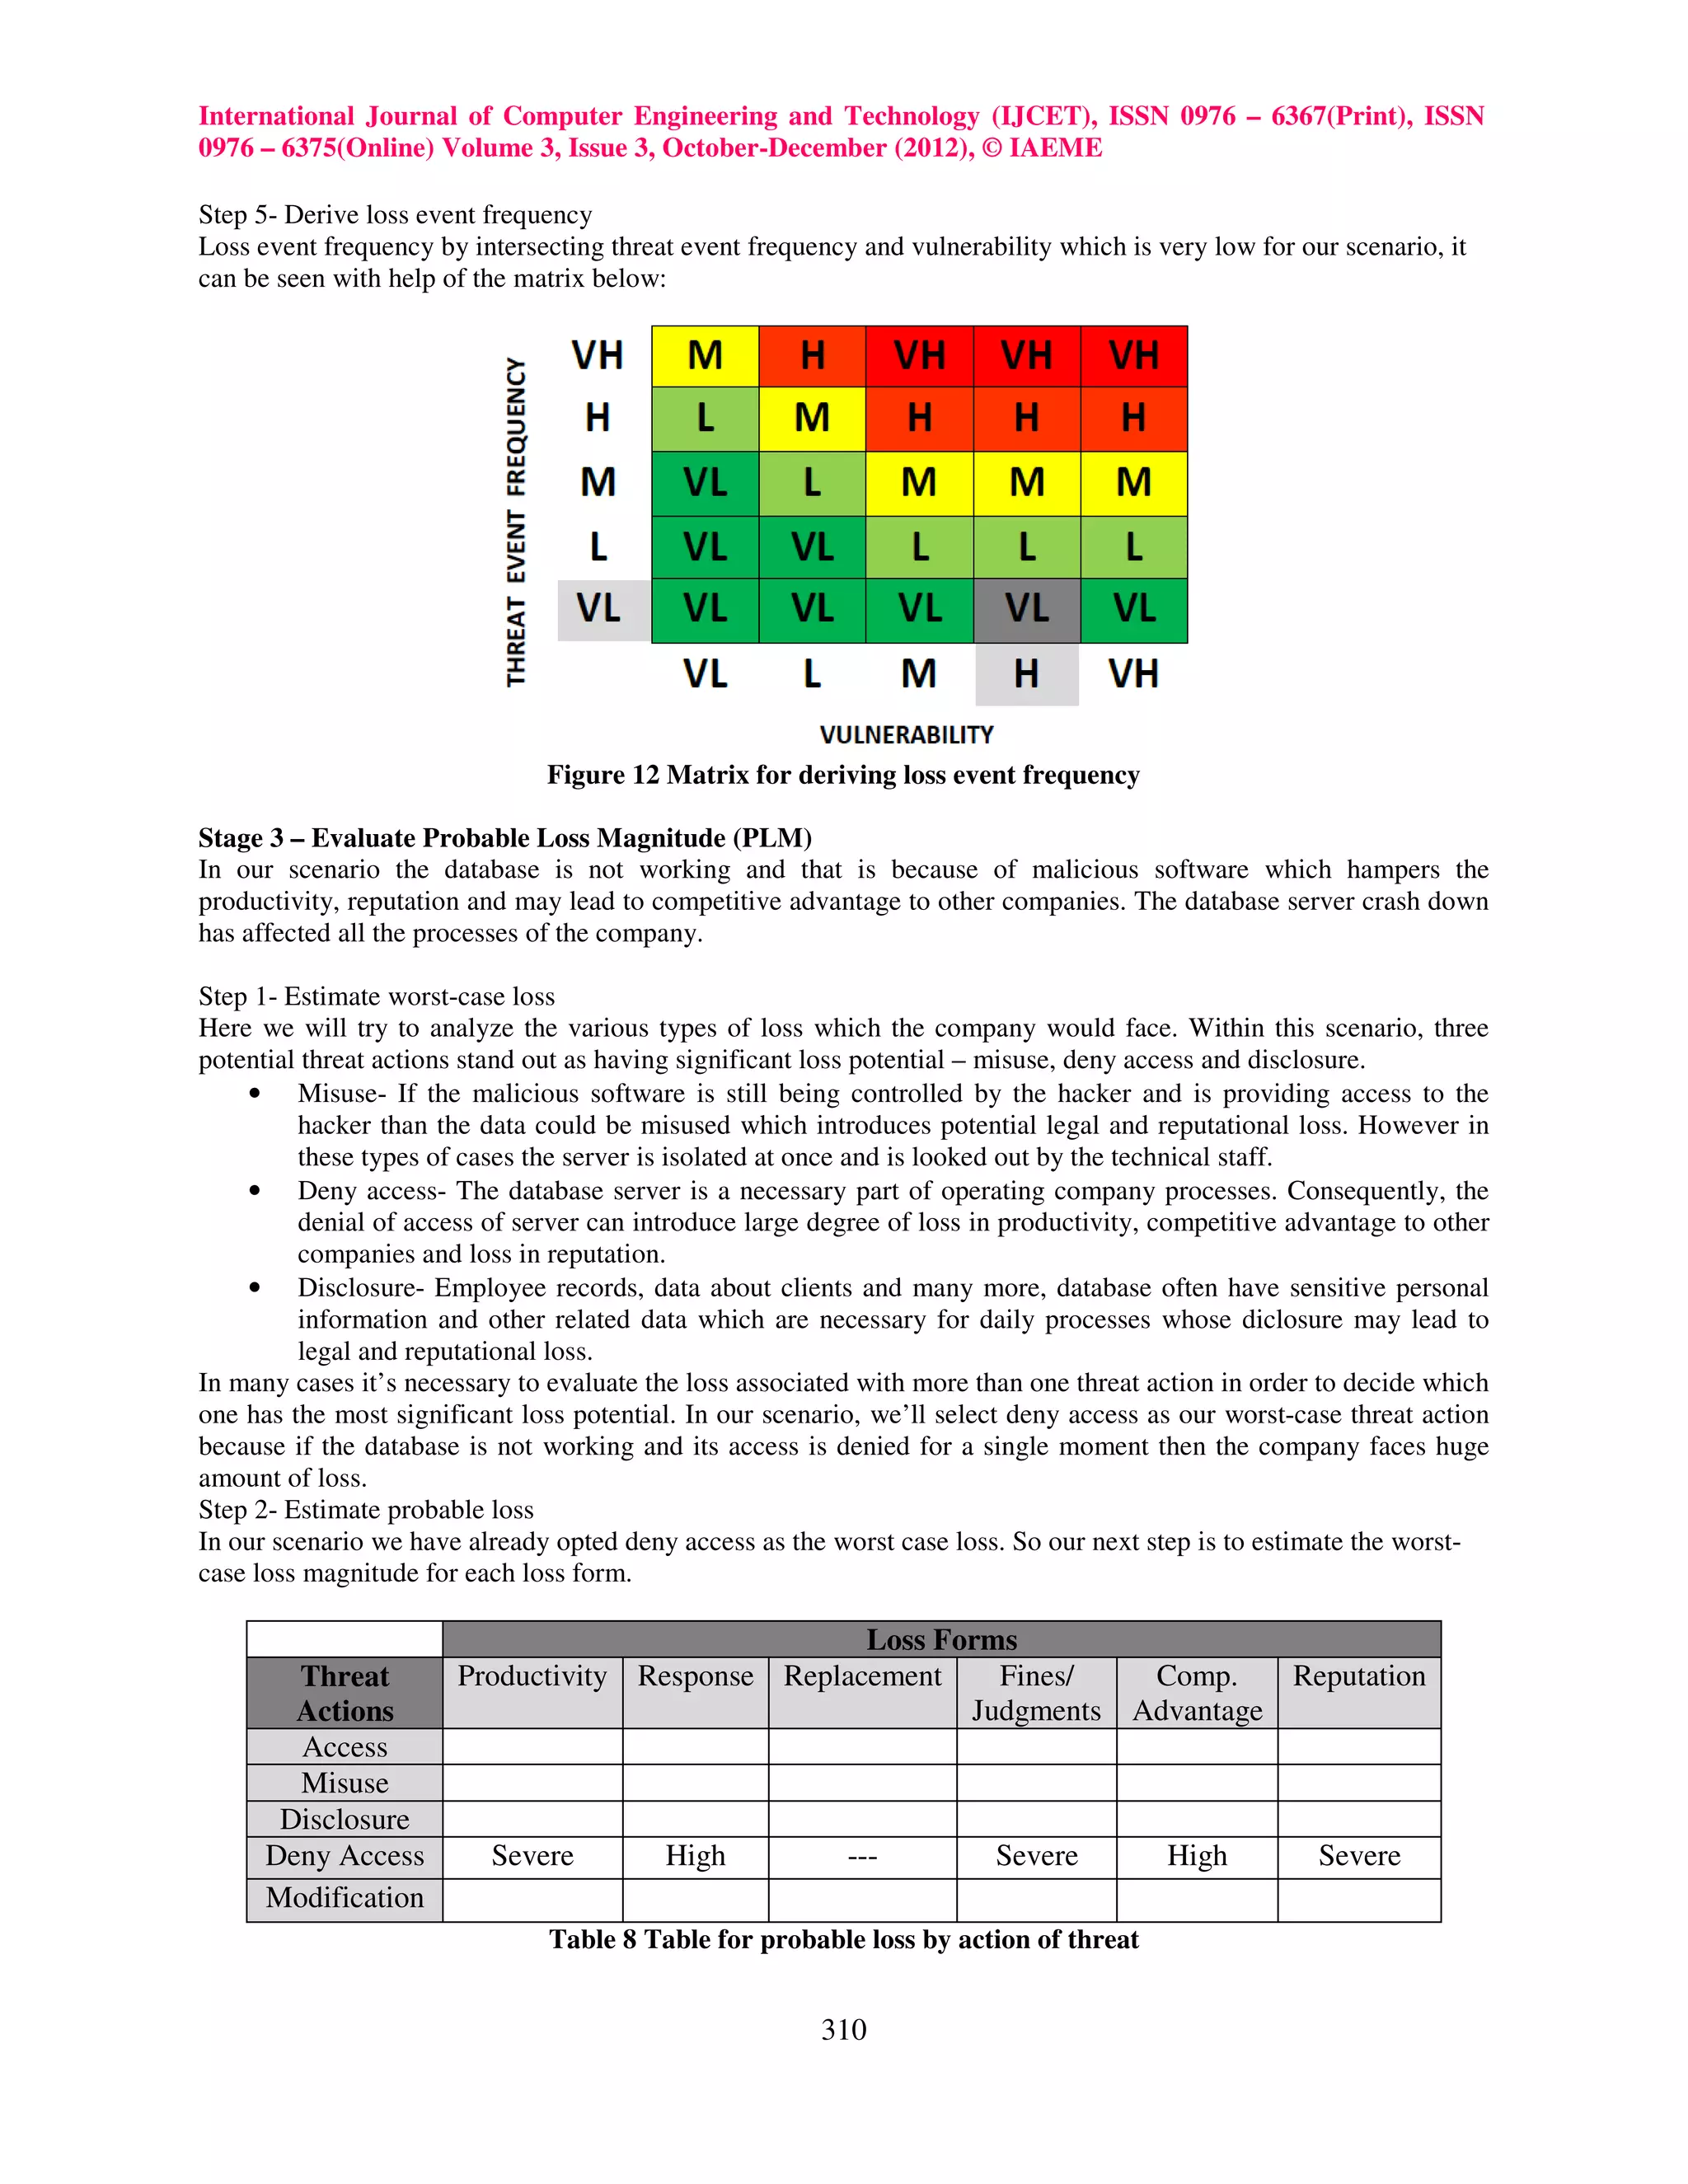
The document discusses enterprise risk management and the Factor Analysis of Information Risk (FAIR) model. It provides an overview of FAIR, which defines risk based on loss event frequency and probable loss magnitude. Loss event frequency depends on threat event frequency and vulnerability. Probable loss magnitude includes factors like asset value and volume, and threat action and competence. FAIR provides a framework to identify, measure, and analyze various factors that contribute to information risk. It helps organizations better understand and manage their risks.
![INTERNATIONAL JOURNAL OF COMPUTER ENGINEERING
International Journal of Computer Engineering and Technology (IJCET), ISSN 0976 – 6367(Print), ISSN
0976 – 6375(Online) Volume 3, Issue 3, October-December (2012), © IAEME
& TECHNOLOGY (IJCET)
ISSN 0976 – 6367(Print)
ISSN 0976 – 6375(Online)
Volume 3, Issue 3, October - December (2012), pp. 300-311
IJCET
© IAEME: www.iaeme.com/ijcet.asp
Journal Impact Factor (2012): 3.9580 (Calculated by GISI) ©IAEME
www.jifactor.com
UNDERSTANDING ENTERPRISE RISK MANAGEMENT AND FAIR
MODEL WITH THE HELP OF A CASE STUDY
Adesh Chandra, Anurag Singh & Ishaan Rastogi
(Department of M.S.-CLIS, IIIT Allahabad, India)
ABSTRACT
Risk is the probability of suffering a loss, destruction, modification or denial of availability of an asset. Enterprise
risk management includes the various processes to manage risk and helps to provide a framework to analyze and
determine risks. There are various framework to analyze risk but here we will study about FAIR (Factor analysis of
information risk) .FAIR derives risk on the basis of certain parameters which help in the estimation of probable loss
to the company. We have also taken a case study which is solved with the help of FAIR model, which will increase
the understanding about enterprise risk and its various factors.
Keywords- FAIR, Threat, Vulnerability, Risk, Loss
1. INTRODUCTION
Enterprise Risk can include a variety of factors with potential impact on organizations activities, processes and
resources. External factor may result economic change, financial market developments and danger arising in
political, legal, technological and demographic environments. Risks can arise over time, as the public can may
change their views on products or practices. Risk can be in form of probable loss to the enterprise, non-completion
of goal on stipulated time and many more.
Enterprise risk management (ERM) in business includes the methods and processes used by organizations to manage
risks and seize opportunities related to the achievement of their objectives. ERM provides a framework for risk
management, which typically involves identifying particular events or circumstances relevant to the organization's
objectives (risks and opportunities), assessing them in terms of likelihood and magnitude of impact, determining a
response strategy, and monitoring progress. By identifying and proactively addressing risks and opportunities,
business enterprises protect and create value for their stakeholders, including owners, employees, customers,
regulators, and society overall.[1]
Managing risks in project is imperative for its success. We need to have processes in place for risk management to
be effective. Here are the five steps which can be used for risk management:
300](https://image.slidesharecdn.com/understandingenterpriseriskmanagementandfair-121224054235-phpapp01/75/Understanding-enterprise-risk-management-and-fair-1-2048.jpg)
![International Journal of Computer Engineering and Technology (IJCET), ISSN 0
0976 – 6367(Print), ISSN
0976 – 6375(Online) Volume 3, Issue 3, October
October-December (2012), © IAEME
MEASURE
& IDENTIFY
CONTROL
MONITOR & ACCESS &
IMPLEMENT ANALYZE
PLAN
ACTION
Figure1. Risk management process
• Identify Risks – Identify risks that affect the enterprise goals and documenting their characteristics
fy
• Assess & Analyze Risks – Assess the risk impact, analyze the probability of risk occurrence and prioritize
nalyze
the risks, numerically analyze the effect of identified risks on project objective
erically objectives.
• Plan Actions – Explore all the possible ways to reduce the impact of threats (or exploit opportunities). Plan
actions to eliminate the risks or enhance the opportunities to mitigate risks. Action plans should be
.
appropriate, cost effective and realistic.
• Monitor & Implement the Action – Track the risks throughout the project. If risks occur then implement
the risk strategy based on action plan. Ex. If mitigation strategy is selected, execute the contingency plan
execute
based on risk triggers. In case contingency plan fails, execute fallback plan.
• Measure the effectiveness & Control the risk impact – Measure the effectiveness of the planned action
and controlling the risk impact by understanding risk triggers & timely implementation of planned
actions.[2]
There are various important ERM frameworks, each of which describe an approach for identifying, analyzing,
describes
responding to, and monitoring risks and opportunities, within the internal and external environment facing the
enterprise. Management selects a risk response strategy for specific risks identified and analyzed.[1]
analyzed.
We will try to analyze FAIR (Factor Analysis of Information Risk) which is a widely adopted framework for risk
management.
2. FACTOR ANALYSIS OF INFORMATION RISK
Factor analysis of information risk (FAIR) is a taxonomy of the factors that contribute to risk and how they affect
aff
each other. It is primarily concerned with establishing accurate probabilities for the frequency and magnitude of loss
events. FAIR provides a reasoned and logical framework for answering fol following questions:
• A taxonomy of the factors that make up information risk. This helps us to have a foundation understanding
of information risk.
• A method of measuring the factors that drive information risk.
• A Computational engine that drives risk by mathematically simulating the relationship between measured
mathematically
factors.
• A simulation model that allows us to apply the taxonomy, measurement model and computational engine to
build and analyze risk.
FAIR defines six kind of loss:
1. Productivity – a reduction of the organization to effectively produce goods or services in order to generate
value
301](https://image.slidesharecdn.com/understandingenterpriseriskmanagementandfair-121224054235-phpapp01/75/Understanding-enterprise-risk-management-and-fair-2-2048.jpg)
![International Journal of Computer Engineering and Technology (IJCET), ISSN 0976 – 6367(Print), ISSN
0976 – 6375(Online) Volume 3, Issue 3, October-December (2012), © IAEME
2. Response – the resources spent while acting following an adverse event
3. Replacement – the expense to substitute/repair an affected asset
4. Fines and judgments (F/J) – the cost of the overall legal procedure deriving from the adverse event
5. Competitive advantage (CA)- missed opportunities due to the security incident
6. Reputation – missed opportunities or sales due to the diminishing corporate image following the event
FAIR defines value/liability as:
1. Criticality – the impact on the organization productivity
2. Cost – the bare cost of the asset, the cost of replacing a compromised asset
3. Sensitivity – the cost associated to the disclosure of the information, further divided into:
a) Embarrassment – the disclosure states the inappropriate behavior of the management of the
company
b) Competitive advantage – the loss of competitive advantage tied to the disclosure
c) Legal/regulatory – the cost associated with the possible law violations
d) General – other losses tied to the sensitivity of data
FAIR characterizes risk on the basis of two parameter:
• The magnitude(severity) of possible adverse consequences
• The likelihood (probability) of occurrence of each consequence[3]
Figure 2 Components of Risks described by FAIR
Risk is a probability issue. Risk has both frequency and the magnitude component which forms the basis of FAIR
model and helps to analyze future loss. The frequency and magnitude namely Loss event frequency and probable
loss magnitude respectively are further divided on other factor for a better analysis.
2.1 Loss event frequency is the probable frequency, within a given timeframe, that a threat agent will inflict harm
upon an asset. Loss event frequency is further divided into Threat Event frequency and Vulnerability.
2.1.1 Threat event frequency is the probable frequency, within a given timeframe, that a threat agent will
act against an asset. It also depends on Contact frequency and Probability of Action.
a) Contact frequency is the probable frequency, within a given timeframe, that a threat agent will
come into contact with an asset. Contact can be random, regular or intentional.
302](https://image.slidesharecdn.com/understandingenterpriseriskmanagementandfair-121224054235-phpapp01/75/Understanding-enterprise-risk-management-and-fair-3-2048.jpg)
![International Journal of Computer Engineering and Technology (IJCET), ISSN 0976 – 6367(Print), ISSN
0976 – 6375(Online) Volume 3, Issue 3, October-December (2012), © IAEME
b) Probability of action is the probability that a threat agent will act against an asset once contact
occurs.
2.1.2 Vulnerability is the probability that an asset will be unable to resist the actions of a threat agent. It
also depends on Threat capability and Control strength.
a) Threat capability is the probable level of force that a threat agent is capable of applying against
an asset.
b) Control strength is the strength of a control as compared to the minimum threshold level.
Figure 3 Components of Loss event frequency
2.2 Probable loss magnitude defines various types of losses like productivity, response, replacement, fines and
judgement, competitive advantage and loss to reputation. For better understanding Probable loss magnitude is
further divided into Primary factors and Secondary factors.
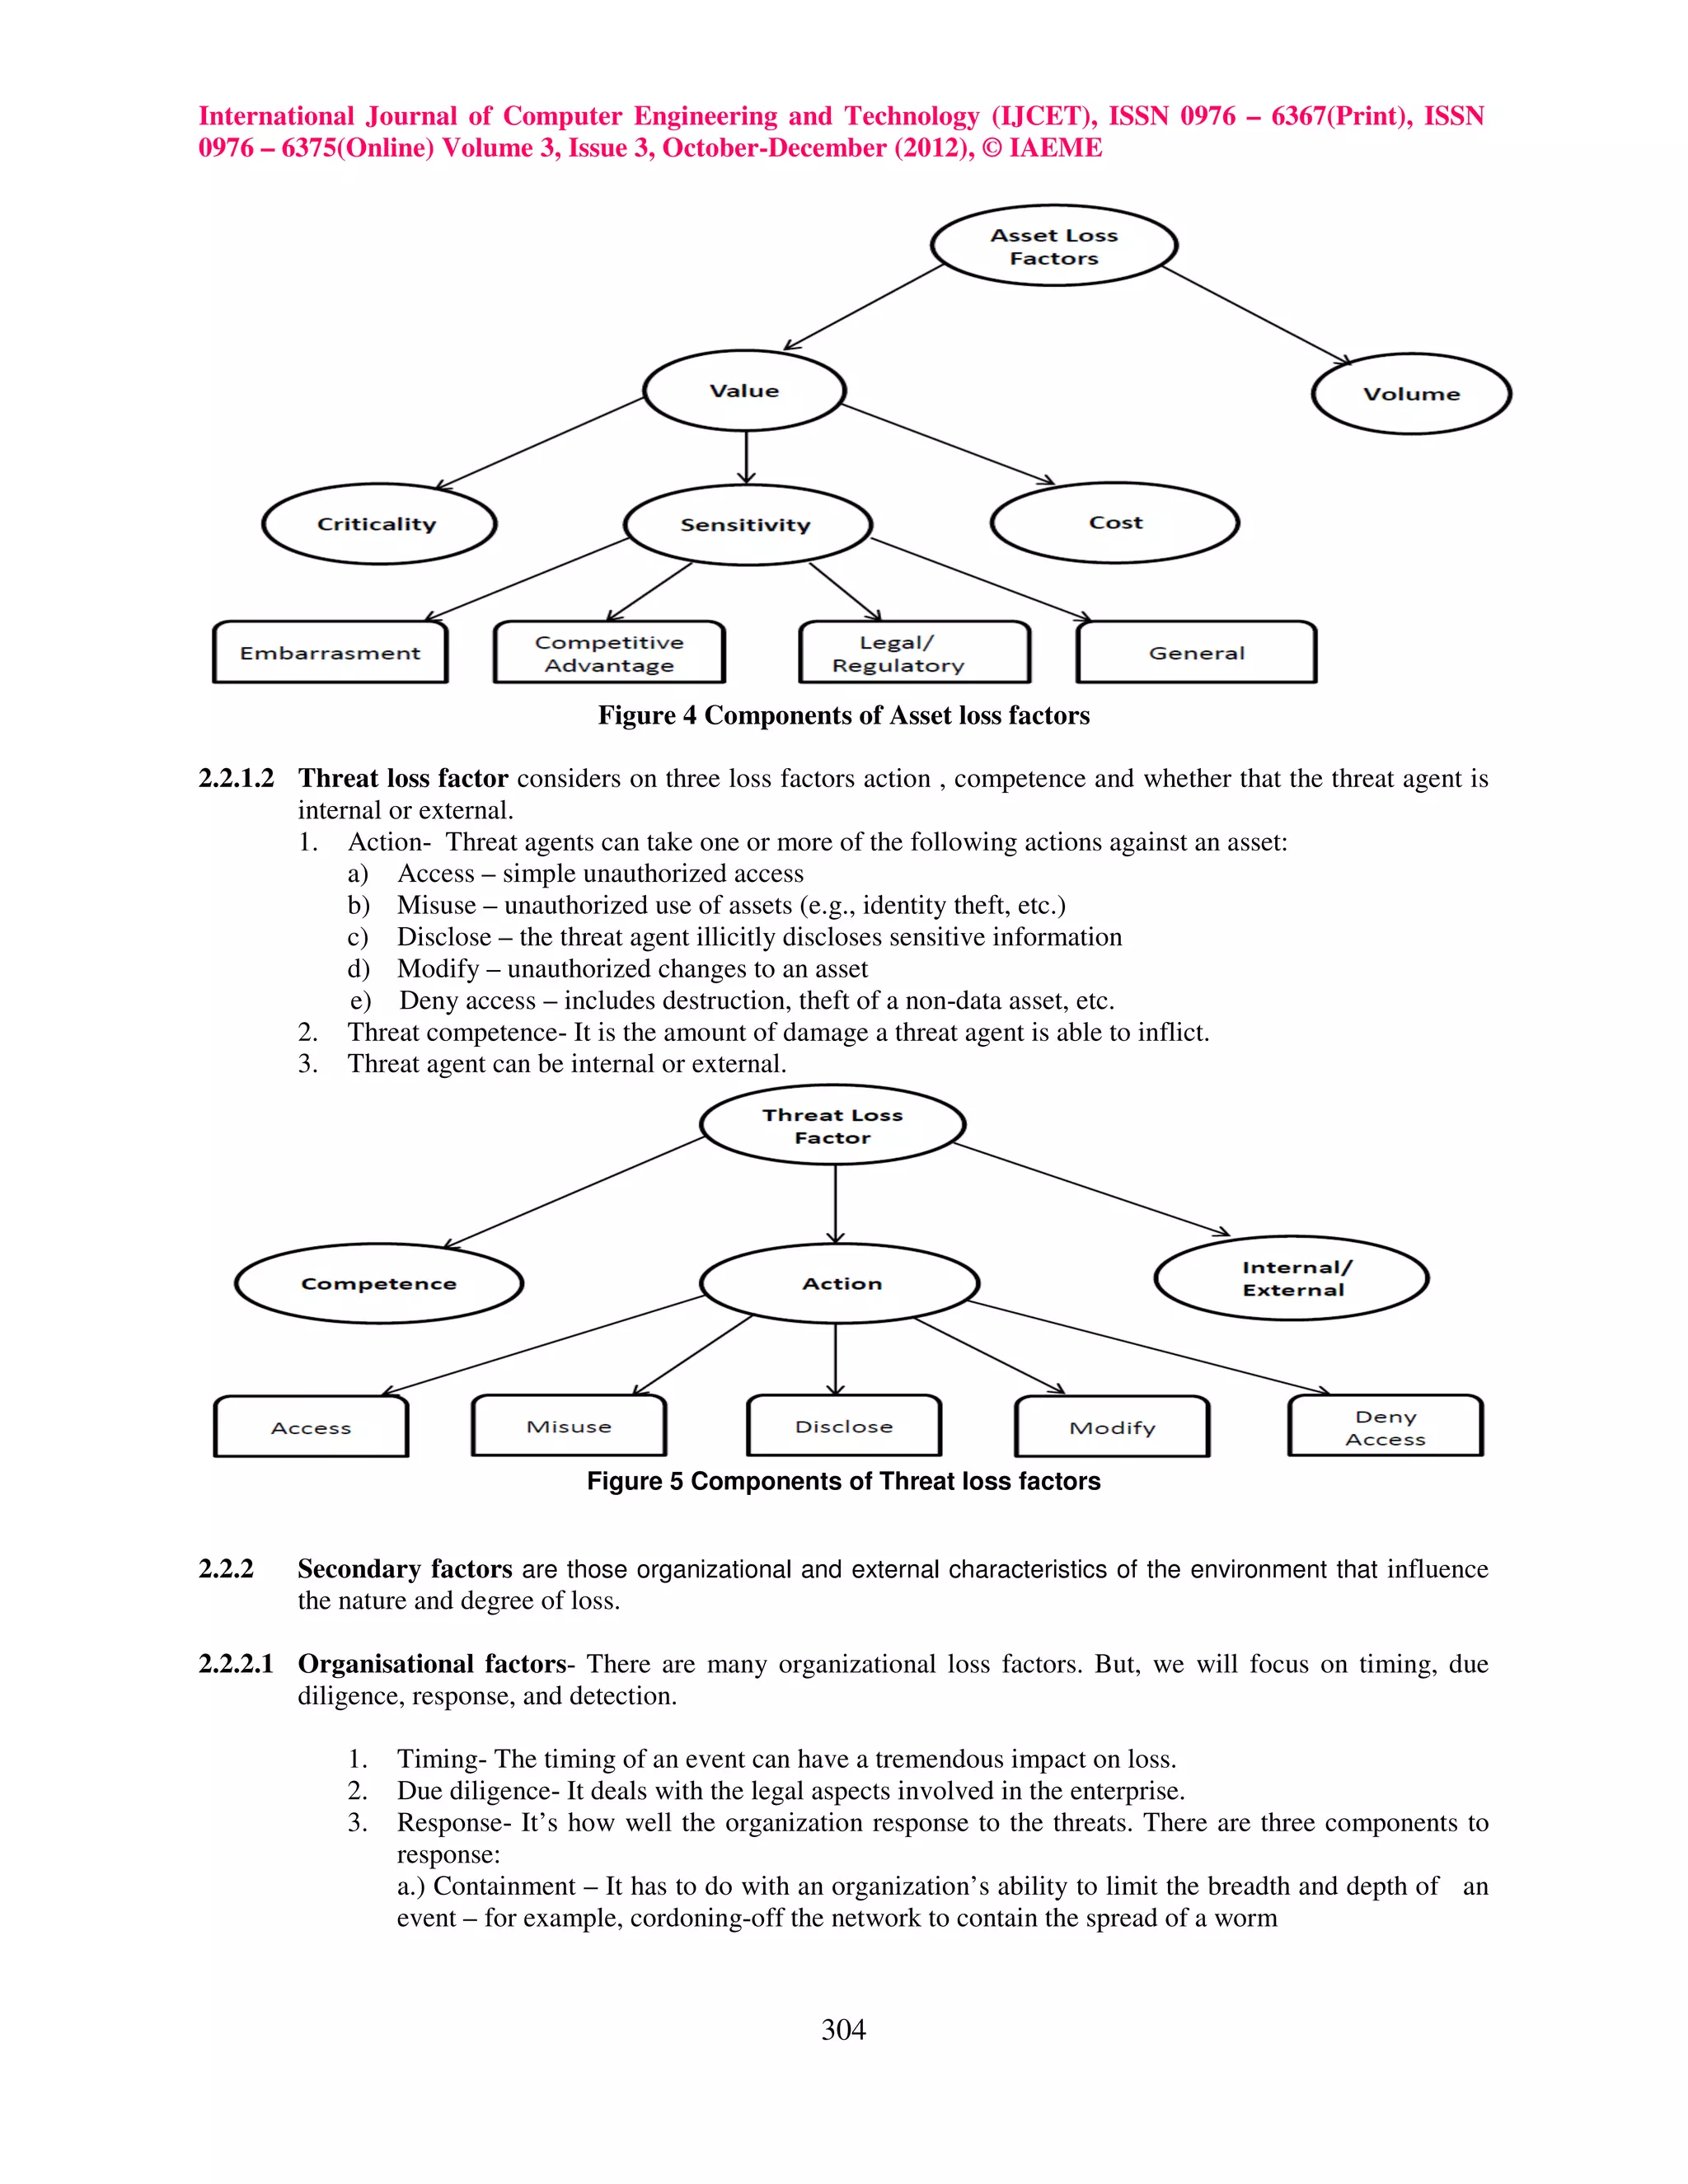
2.2.1 Primary Factors comprises of the assets and the threats which the assets can have.
2.2.1.1 Asset Loss Factor- There are two asset loss factors that we are concerned with which are
value/liability and volume. The value/liability characteristics of an asset play a key role in both the nature
and magnitude of loss. We can further define value/liability as:
1. Criticality – characteristics of an asset that have to do with the impact to an organization’s productivity. For
example, the impact a corrupted database would have on the organization’s ability to generate revenue
2. Cost – refers to the intrinsic value of the asset – i.e., the cost associated with replacing it if it’s been made
unavailable (e.g., stolen, destroyed, etc.). Examples include the cost of replacing a stolen laptop or
rebuilding a bombed-out building
3. Sensitivity – the harm that can occur from unintended disclosure. Sensitivity is further broken down into
four sub-categories:
a) Embarrassment/reputation – the information provides evidence of incompetent, criminal, or unethical
management. Note that this refers to reputation damage resulting from the nature of the information itself,
as opposed to reputation damage that may result when a loss event takes place.
b) Competitive advantage – the information provides competitive advantage (e.g., key strategies, trade secrets,
etc.). Of the sensitivity categories, this is the only one where the sensitivity represents value. In all other
cases, sensitivity represents liability.
c) Legal/regulatory – the organization is bound by law to protect the information
d) General – sensitive information that doesn’t fall into any of the above categories, but would result in some
form of loss if disclosed.
Asset volume simply recognizes that how many assets are at risk to greater loss magnitude if an event occurs –
e.g., two children on a rope swing versus one child, or one sensitive customer record versus a thousand.[3]
303](https://image.slidesharecdn.com/understandingenterpriseriskmanagementandfair-121224054235-phpapp01/75/Understanding-enterprise-risk-management-and-fair-4-2048.jpg)
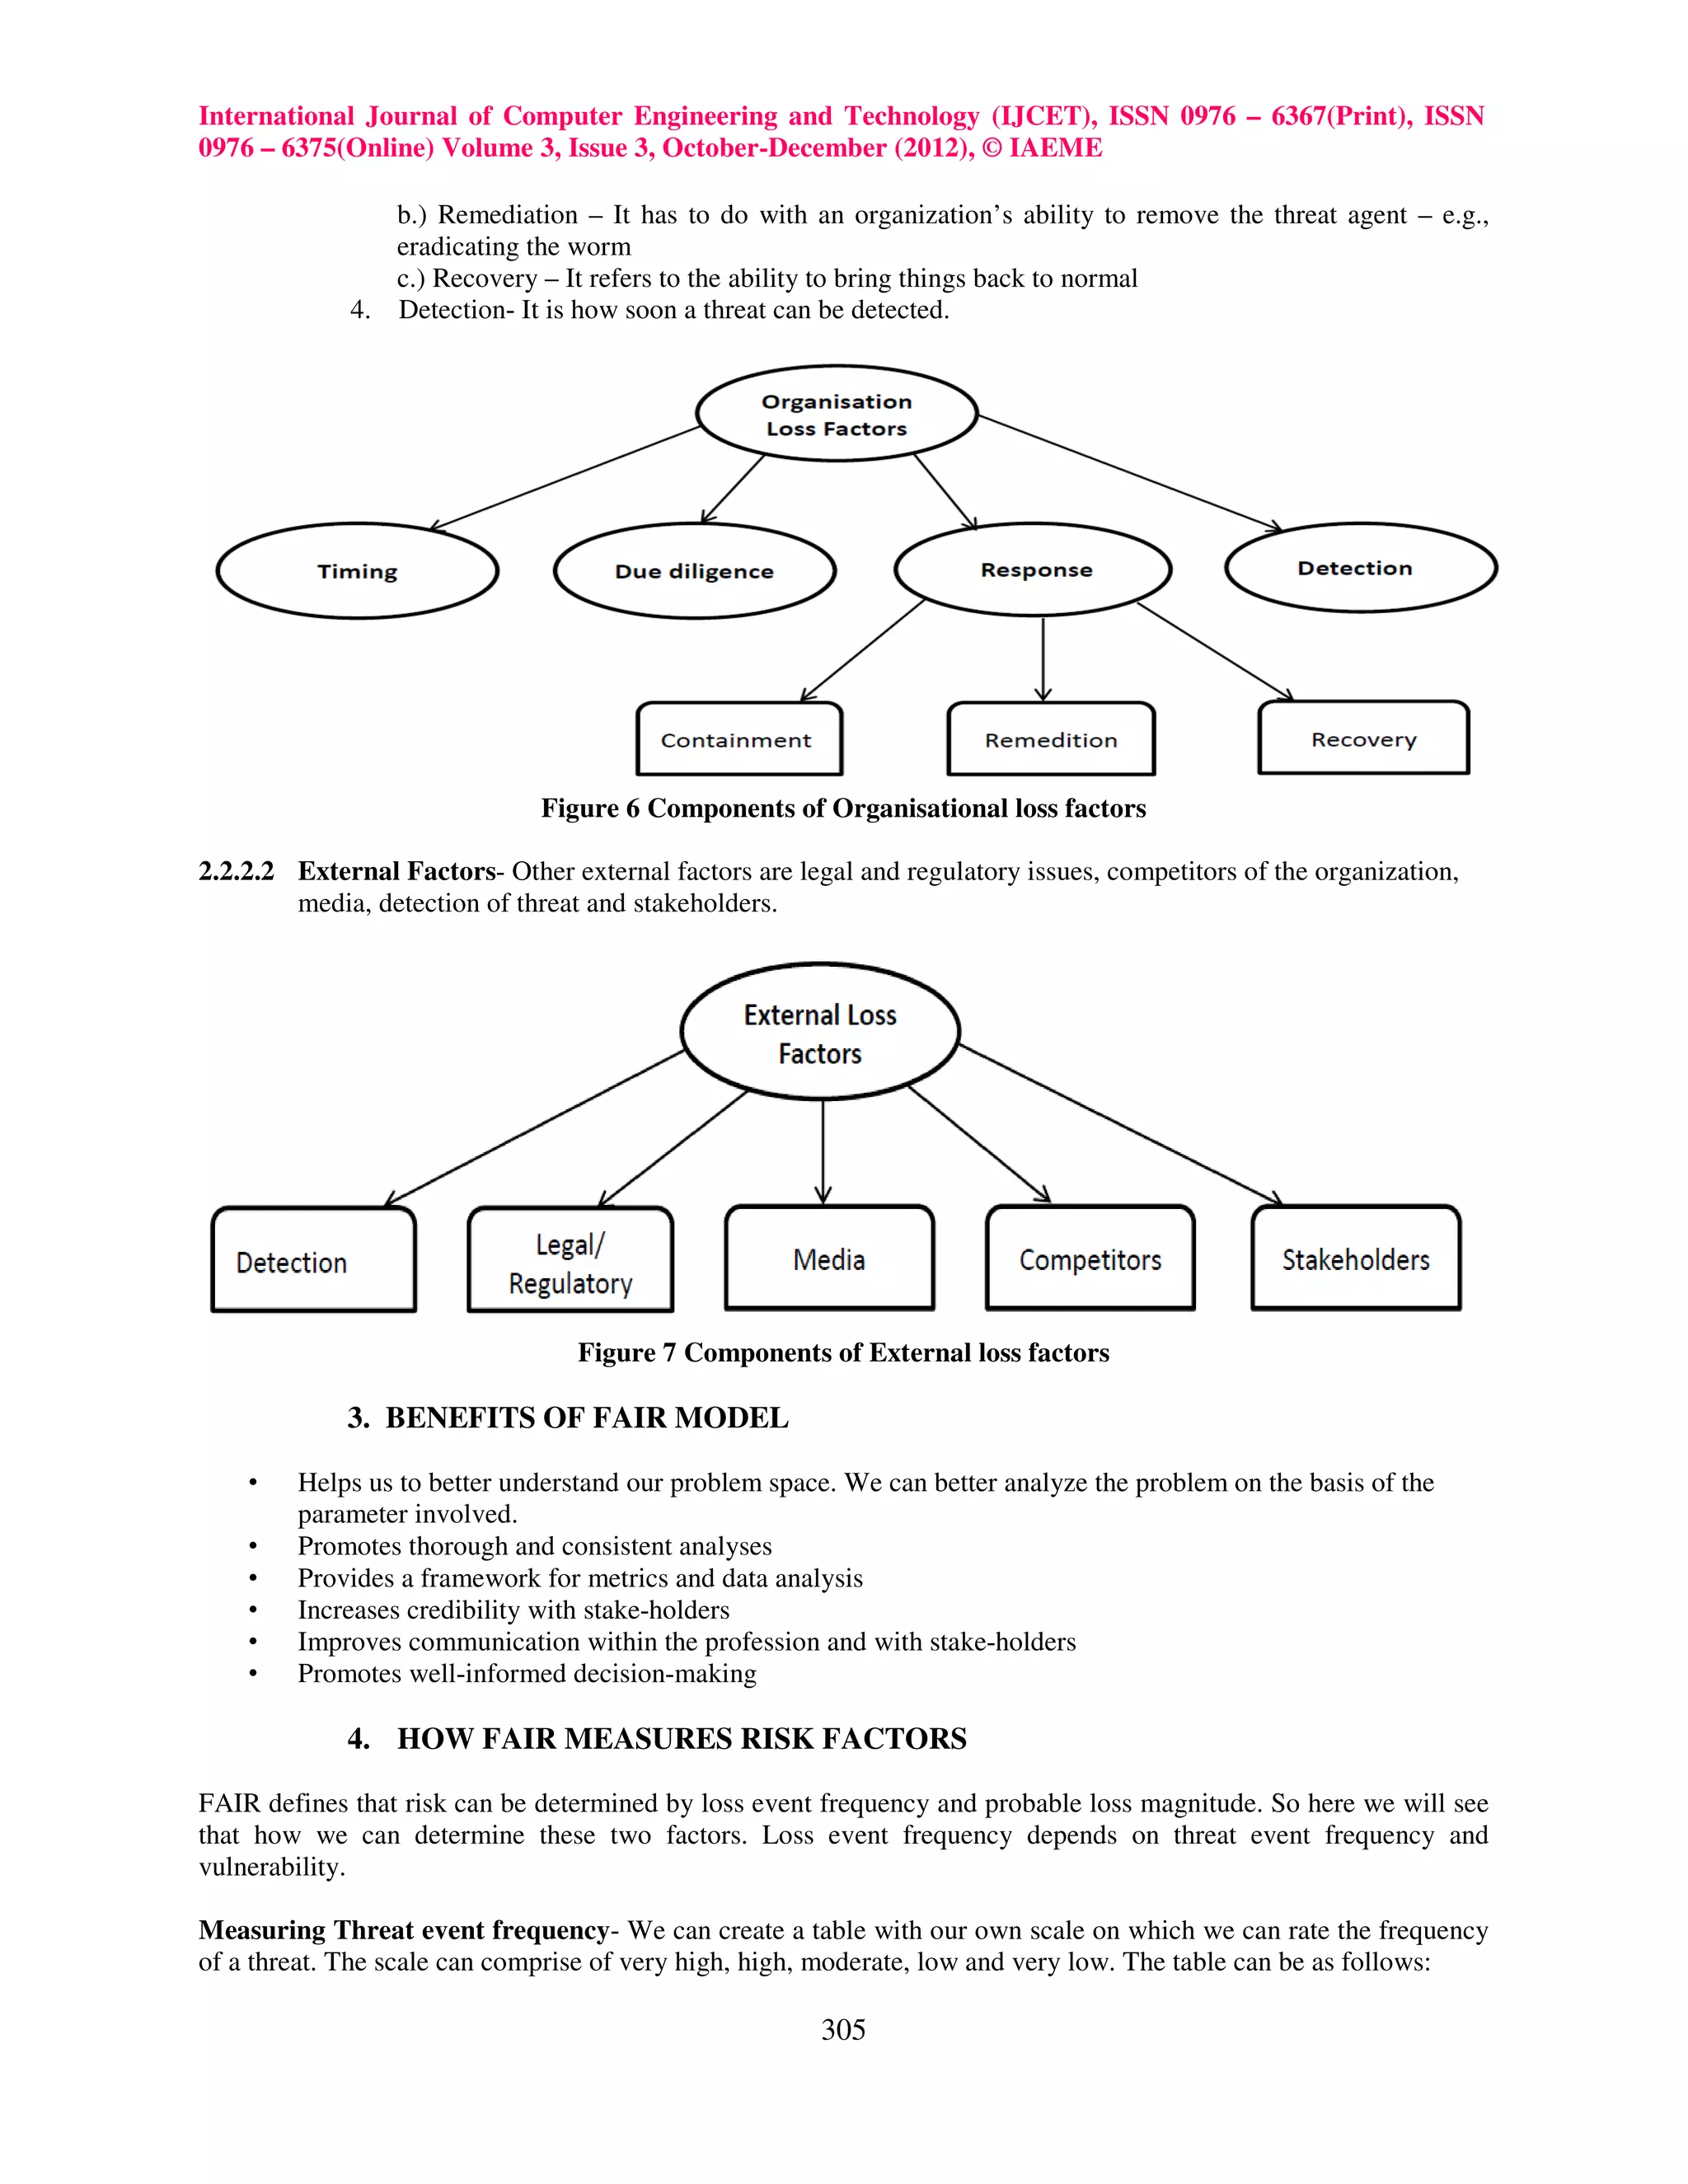
![International Journal of Computer Engineering and Technology (IJCET), ISSN 0976 – 6367(Print), ISSN
0976 – 6375(Online) Volume 3, Issue 3, October-December (2012), © IAEME
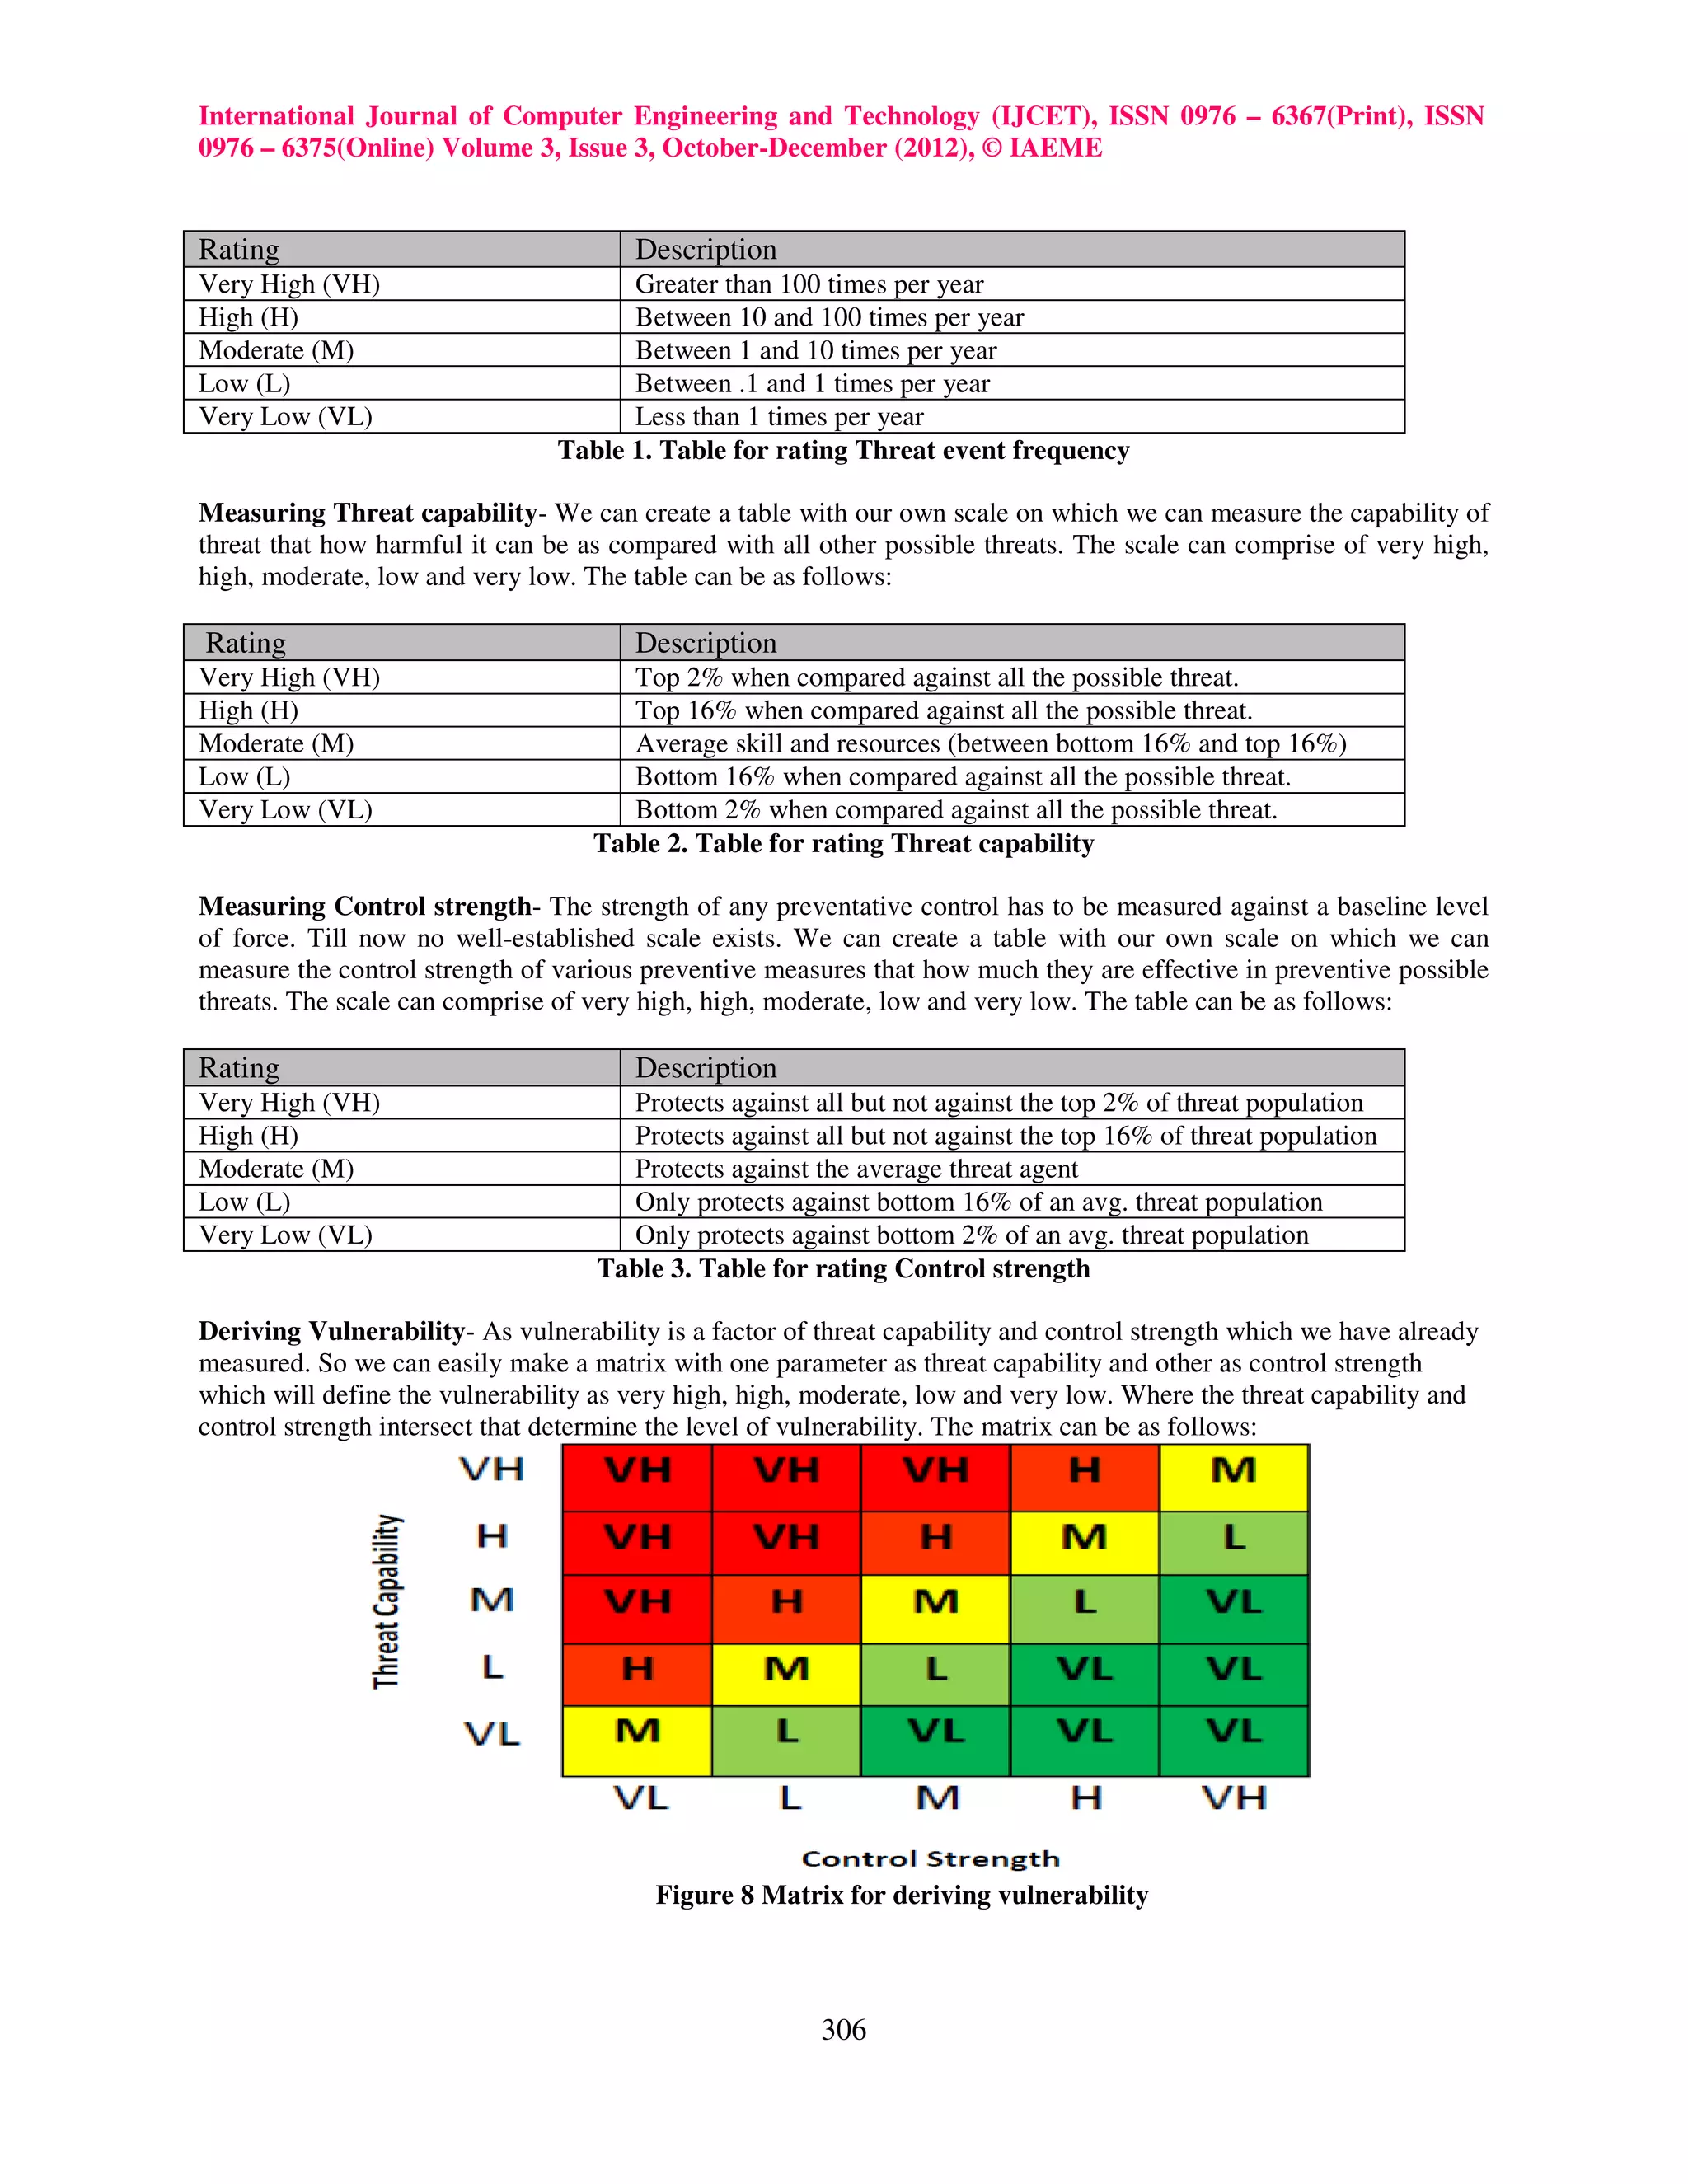
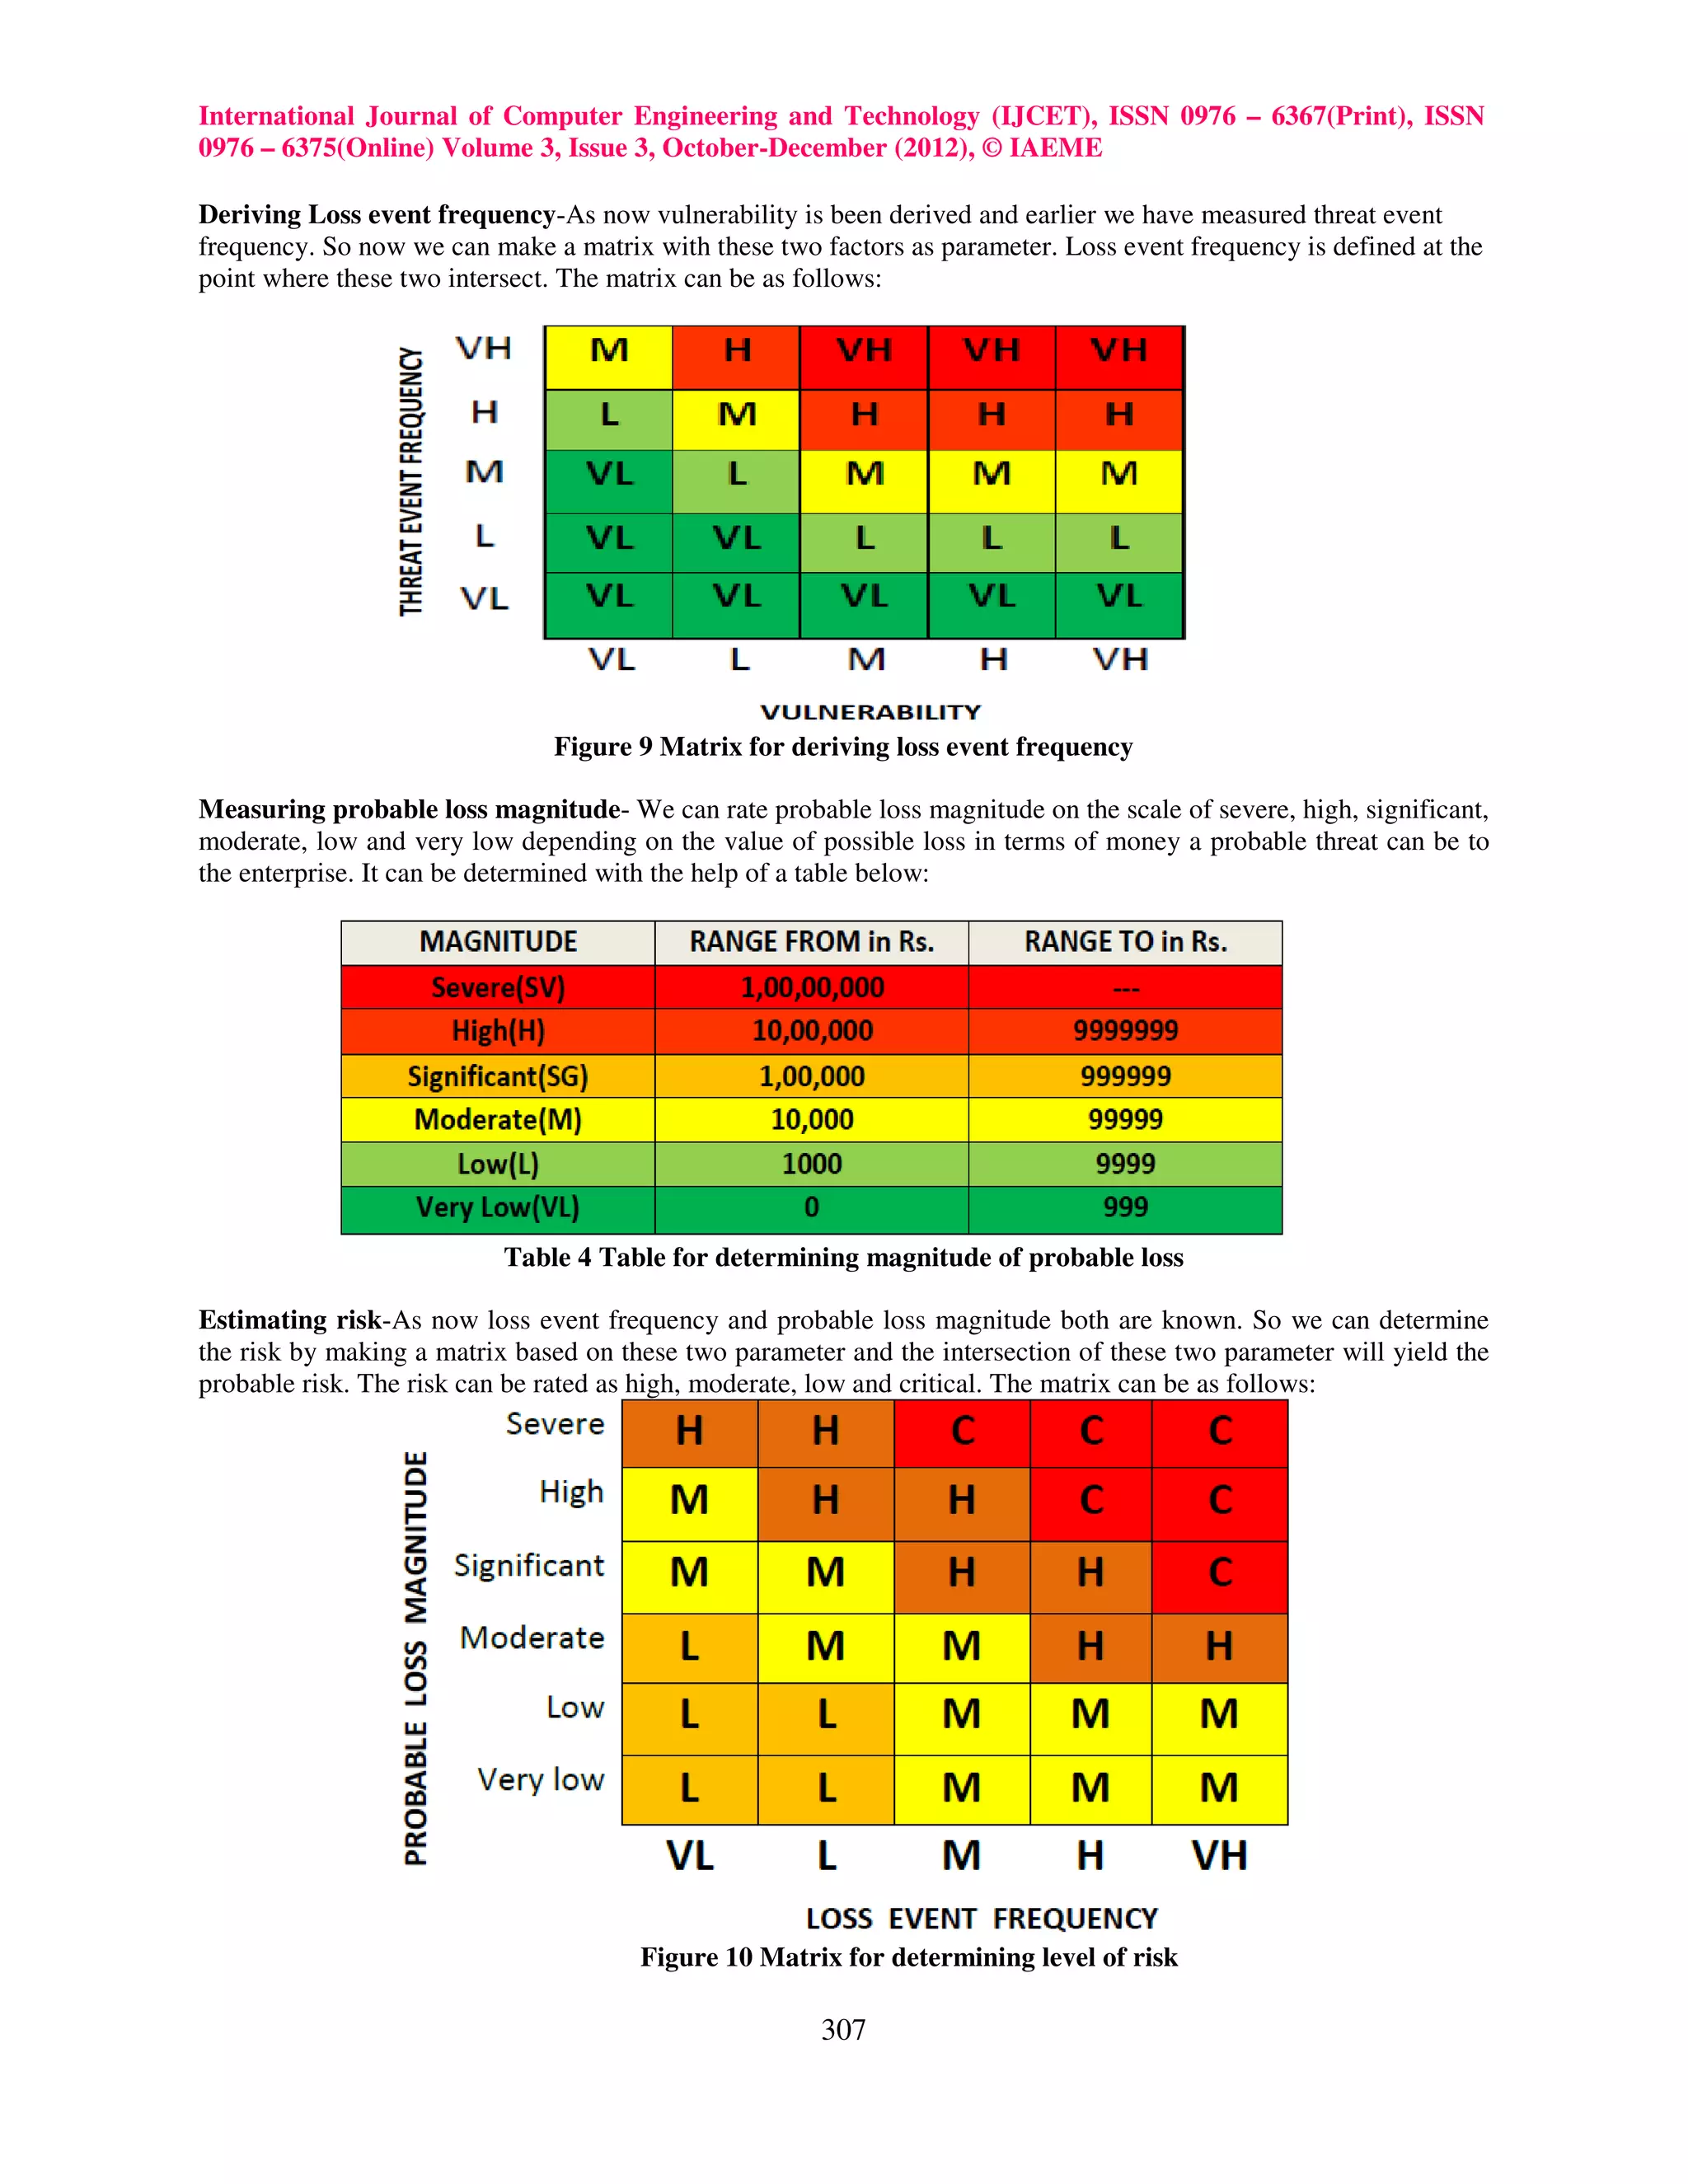
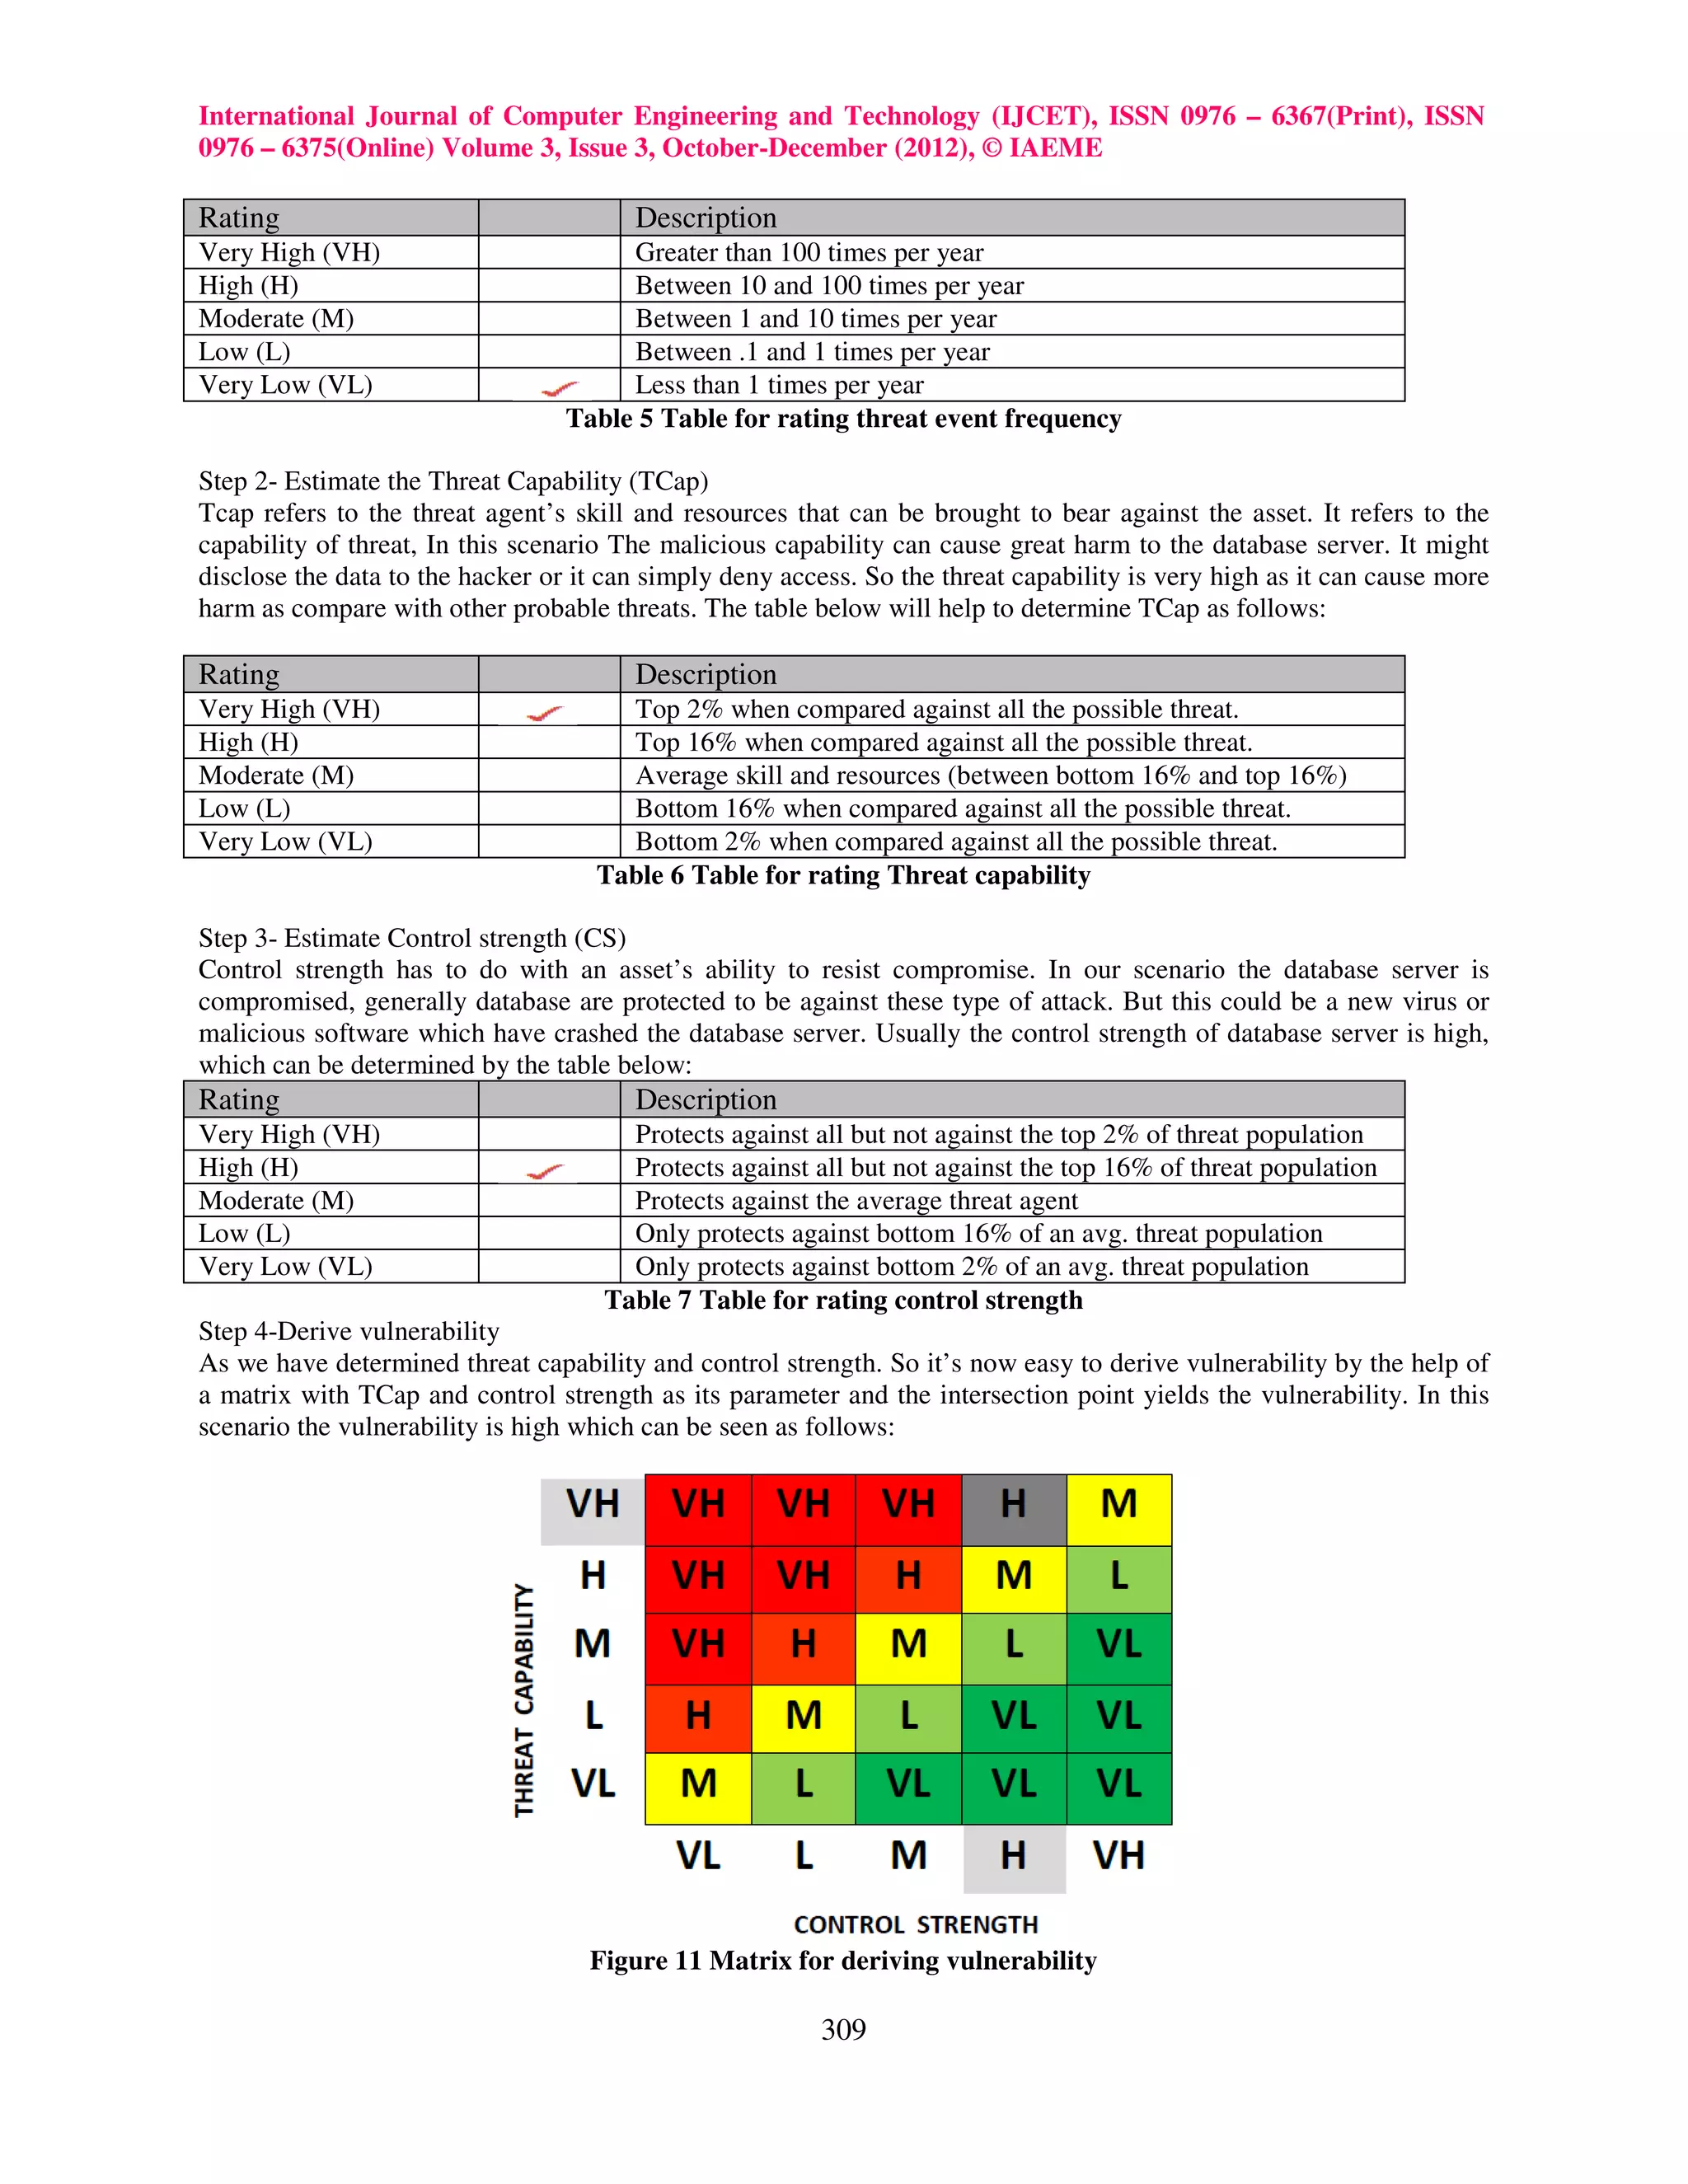
5. CASE STUDY
Scenario- An organization which deals with huge amount of data has a database server, but does not have an
alternative database server which is soon to get implemented in the company after a couple of days. The company
suddenly faces a database server crash down due to which the company can no more access its data and is facing
loss until the server is restored to normal condition.
The analysis
As earlier we have studied about FAIR model and its steps. So we will use the same steps to derive the level of risk
in this scenario.
Stage 1 – Identify scenario components
• Identify the asset at risk
• Identify the threat community under consideration
Stage 2 – Evaluate Loss Event Frequency (LEF)
• Estimate the probable Threat Event Frequency (TEF)
• Estimate the Threat Capability (TCap)
• Estimate Control strength (CS)
• Derive Vulnerability (Vuln)
• Derive Loss Event Frequency (LEF)
Stage 3 – Evaluate Probable Loss Magnitude (PLM)
• Estimate worst-case loss
• Estimate probable loss
Stage 4 – Derive and articulate Risk
• Derive and articulate Risk [4]
Stage 1-Identify scenario components
Step 1-Identify the assets at risk
The primary asset at risk is the database server which is not working, then the data contained in the database, all the
applications, files and other resources which are accessed with the help of database server. In short the whole
working is hampered just because of the database server.
Step 2- Identify the threat community
Now the next step is to identify whether the threat agent is human or malware, and internal or external. In this
scenario the probable threat agent could be:
• Any disgruntle employee
• Any malicious software/virus
• Disk failure
• Physical damage
• Sudden power failure
With experience it become easier to determine which threat agent are responsible for the damage.In this example we
are focusing on any malicious software which could be the probable cause to the damage caused.
Stage 2 – Evaluate Loss Event Frequency (LEF)
Step 1- Estimate the probable Threat Event Frequency (TEF)
TEF estimate would be based upon how frequently contact between this threat agent (the malicious software) and
the database server occurs AND the probability that they would act against the database server.
Recognizing that there are many malicious software which always try to get access but the frequency that any
malicious software would gain access over the database is very low because the database is always being protected
by antivirus, software and technical staff. So we can rate TEF on the basis of the table below:
308](https://image.slidesharecdn.com/understandingenterpriseriskmanagementandfair-121224054235-phpapp01/75/Understanding-enterprise-risk-management-and-fair-9-2048.jpg)
![International Journal of Computer Engineering and Technology (IJCET), ISSN 0976 – 6367(Print), ISSN
0976 – 6375(Online) Volume 3, Issue 3, October-December (2012), © IAEME
Our estimates are based on the following reasons:
• Productivity- It’s conceivable that productivity losses could be Severe as no process takes place due to the
database failure.
• Response- Legal expenses associated with inside and outside legal counsel could be High, particularly if
class action lawsuits were filed. Huge amount of employee, client data and critical data is at stake
• Fines/Judgments - If the disclosed information regarding client’s personal data or company’s critical issues
is compromised, then legal judgments in behalf of affected clients could be Severe, particularly if a large
number of clients were affected. If the information included evidence of criminal activity or incompetence
on the part of management, then legal and regulatory fines and sanctions could be Severe
• Competitive advantage- If the disclosed information provided evidence of incompetence or criminal
activity, competitors could, in theory, leverage that to gain advantage. Since the company is not processing
due to database failure, so competitor can gain advantage which could be high.
• Reputation- If the problem is not resolved rapidly, due diligence was seriously absent, legal actions were
large enough, and media response was negative and pervasive, then reputational loss associated with
customer flight and stock value could be Severe.
So in all we can see that denial of access result in severe magnitude of loss to the company.
Stage 4 – Derive and articulate Risk
As we have already estimated threat event frequency and probable loss magnitude. So it is very easy to determine
risk. The risk can be rated as high, moderate, low and critical. In our scenario the risk associated is high which can
be seen from the table below:
Figure 13 Matrix for deriving risk
So we have seen that the various steps derived with the help of FAIR model have helped to determine the level of
risk in our scenario which is beneficial for the company to determine the probable loss.
6. CONCLUSION
Enterprise risk management is the comprehensive process of identification, analysis and either acceptance or
mitigation of uncertainty in decision-making. Risk management is a central part of any organization’s strategic
management. The focus of good risk management is the identification and treatment of these risks. As we know that
risk is the factor of probability and severity associated with a threat. The paper discusses about FAIR (Factor
Analysis of information Risk) which is a model for analysis risk. FAIR determines risk as the factor of threat event
frequency and probable loss magnitude of the threat. The paper also tells about the benefits of FAIR and the various
steps which are taken to derive risk from the various associated threat to the enterprise. The case study taken here is
also resolved with the help of FAIR and its steps which help to determine the level of enterprise risk management.
REFERENCES
[1] http://en.wikipedia.org/wiki/Enterprise_risk_management-defnition
[2] http://leadershipchamps.wordpress.com/2008/06/24/risk-management-processes
[3] An Introduction to Factor Analysis of Information Risk (FAIR) by Jack A. Jones, CISSP, CISM, CISA
[4] FAIR (FACTOR ANALYSIS OF INFORMATION RISK) Basic Risk Assessment Guide
311](https://image.slidesharecdn.com/understandingenterpriseriskmanagementandfair-121224054235-phpapp01/75/Understanding-enterprise-risk-management-and-fair-12-2048.jpg)