Downloaded 153 times


![IS6410- Analysis & Design Customer Segmentation Report
Project Plan
Work Breakdown Structure
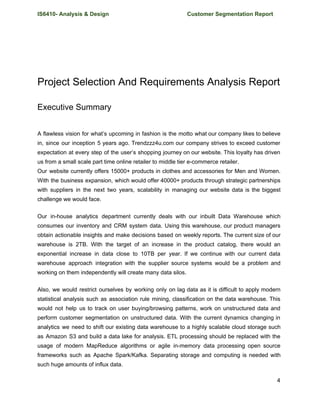
WBS is a hierarchical and incremental decomposition of the project into phases, deliverables
and work packages. It is a tree structure, which shows a subdivision of effort required to achieve
an objective; for example a program, project, and contract.[2]
In a project or contract, the WBS is
developed by starting with the end objective and successively subdividing it into manageable
components in terms of size, duration, and responsibility (e.g., systems, subsystems,
components, tasks, subtasks, and work packages) which include all steps necessary to achieve
the objective.
The diagram below shows the WBS of the entire customer segmentation project. The project is
divided into 5 modules
1. Customer Survey
2. Create E-Commerce Website
3. Set Hadoop Environment
4. Data Engineering
5. Analyze Data & Reporting
29](https://image.slidesharecdn.com/finaldeliverable-170329045254/85/Customer-Segmentation-Project-29-320.jpg)


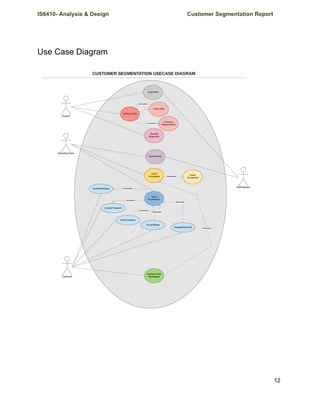
The document presents a project report for customer segmentation, compiled by a team of students. It outlines the business growth and analytic challenges faced by an e-commerce platform, stressing the need for a transition to a scalable cloud data solution. The project includes various technical components such as use case diagrams, requirements analysis, and specific roles within the Scrum framework.