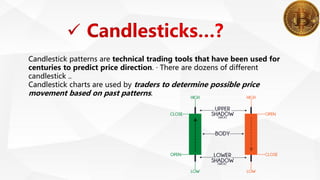
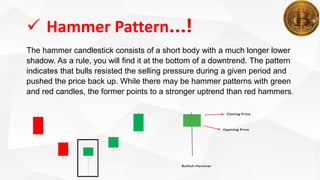
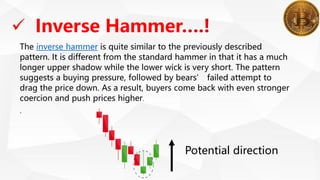
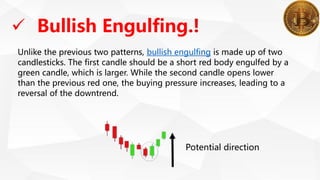
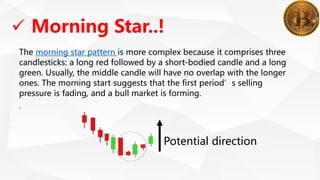
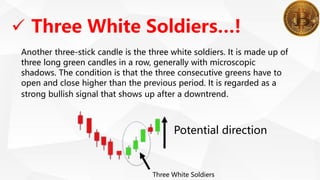
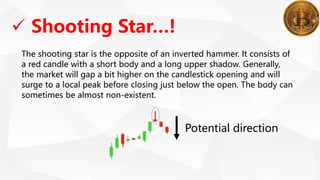
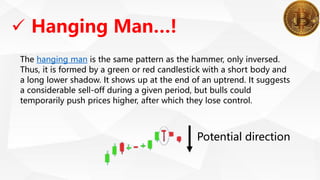
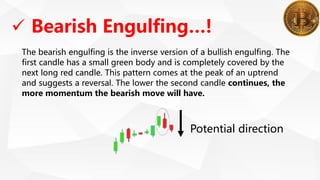
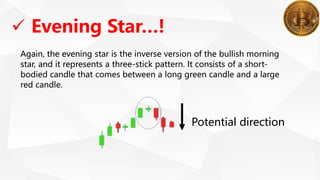
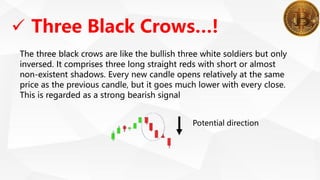
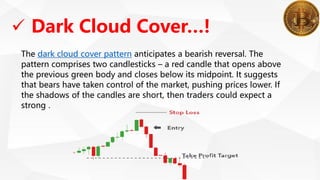
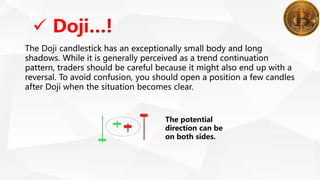
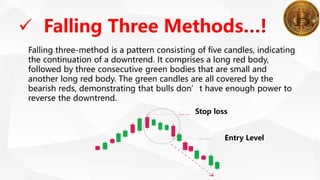
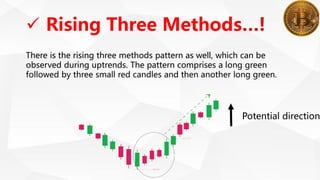
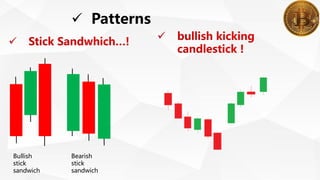
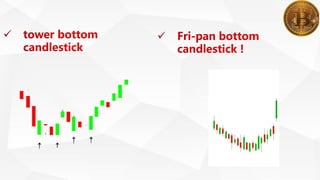
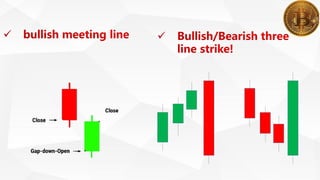
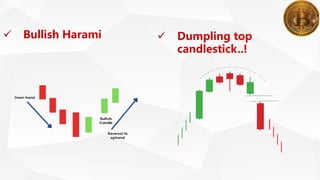
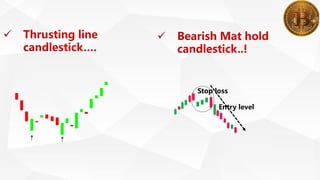
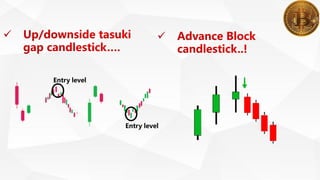
LOGO
Bitcoin
Table of contents
01
OPTION
03
OPTION
02
OPTION
04
OPTION
Famous currency
Candlesticks
Introduction
Patterns
A cryptocurrency is a digital currency, which is an alternative form of
payment created using encryption algorithms. The use of encryption
technologies means that cryptocurrencies function both as a currency
and as a virtual accounting system. To use cryptocurrencies, you need a
cryptocurrency wallet.
Introduction
Famous
Cryptocurrencies
08
07
06
05
04
03
02
01
Litecoin
Bitcoin
Ethereum
Ripple (XRP)
Cardano
Polkadot
Dogecoin
Tether
Advantages
 Self-governed and managed: ...
 Decentralized: ...
 Cost-effective mode of transaction: ...
 Currency exchanges finish smoothly: ...
 Secure and private: ...
 Easy transfer of funds
Candlestick patterns are technical trading tools that have been used for
centuries to predict price direction. · There are dozens of different
candlestick ..
Candlestick charts are used by traders to determine possible price
movement based on past patterns.
 Candlestick charts are easy to read after some
practice, as they contain plenty of information
related to historical price data. Even novice or
advanced traders can read the candlestick
chart by looking at the general trend visually.
Types Of Candlesticks
Bullish Bearish
 Candlestick goes
up
 Candlestick goes
Down
Candlestick trading graphically
displays market sentiment. A
close above an open indicates
bullish market sentiment, and
this is denoted by a Green
candle. Such a candle is
called a bull candle
1
Add totitle
Hammer Pattern
2 Inverse Hammer
3 Bullish Engulfing
4 Piercing Line
5 Morning Star
6 Three White Soldiers
 Hammer Pattern…!
The hammer candlestick consists of a short body with a much longer lower
shadow. As a rule, you will find it at the bottom of a downtrend. The pattern
indicates that bulls resisted the selling pressure during a given period and
pushed the price back up. While there may be hammer patterns with green
and red candles, the former points to a stronger uptrend than red hammers.
 Inverse Hammer….!
The inverse hammer is quite similar to the previously described
pattern. It is different from the standard hammer in that it has a much
longer upper shadow while the lower wick is very short. The pattern
suggests a buying pressure, followed by bears’ failed attempt to
drag the price down. As a result, buyers come back with even stronger
coercion and push prices higher.
.
Potential direction
 Bullish Engulfing.!
Unlike the previous two patterns, bullish engulfing is made up of two
candlesticks. The first candle should be a short red body engulfed by a
green candle, which is larger. While the second candle opens lower
than the previous red one, the buying pressure increases, leading to a
reversal of the downtrend.
Potential direction
 Piercing Line..!
Another two-candlestick pattern is the piercing line, which may show
up at the bottom of a downtrend, at the support level, or during a
pullback. The pattern consists of a long red candle that is followed by
a long green candle. The critical aspect of this pattern is that there is a
significant gap between the red candle’s closing price and the green
candle’s open price. The fact that the green candle opens much
higher points to buying
.
 Morning Star..!
The morning star pattern is more complex because it comprises three
candlesticks: a long red followed by a short-bodied candle and a long
green. Usually, the middle candle will have no overlap with the longer
ones. The morning start suggests that the first period’s selling
pressure is fading, and a bull market is forming.
.
Potential direction
 Three White Soldiers…!
Another three-stick candle is the three white soldiers. It is made up of
three long green candles in a row, generally with microscopic
shadows. The condition is that the three consecutive greens have to
open and close higher than the previous period. It is regarded as a
strong bullish signal that shows up after a downtrend.
Potential direction
Three White Soldiers
A close below an open
indicates bearish market
sentiment. This is denoted by
a red candle and is called
a bear candle.
1
Add totitle
Shooting Star
2 Hanging Man
3 Bearish Engulfing
4 Evening Star
5 Three Black Crows
6 Dark Cloud Cover
 Shooting Star…!
The shooting star is the opposite of an inverted hammer. It consists of
a red candle with a short body and a long upper shadow. Generally,
the market will gap a bit higher on the candlestick opening and will
surge to a local peak before closing just below the open. The body can
sometimes be almost non-existent.
Potential direction
 Hanging Man…!
The hanging man is the same pattern as the hammer, only inversed.
Thus, it is formed by a green or red candlestick with a short body and
a long lower shadow. It shows up at the end of an uptrend. It suggests
a considerable sell-off during a given period, but bulls could
temporarily push prices higher, after which they lose control.
Potential direction
The bearish engulfing is the inverse version of a bullish engulfing. The
first candle has a small green body and is completely covered by the
next long red candle. This pattern comes at the peak of an uptrend
and suggests a reversal. The lower the second candle continues, the
more momentum the bearish move will have.
 Bearish Engulfing…!
Potential direction
Again, the evening star is the inverse version of the bullish morning
star, and it represents a three-stick pattern. It consists of a short-
bodied candle that comes between a long green candle and a large
red candle.
 Evening Star…!
Potential direction
The three black crows are like the bullish three white soldiers but only
inversed. It comprises three long straight reds with short or almost
non-existent shadows. Every new candle opens relatively at the same
price as the previous candle, but it goes much lower with every close.
This is regarded as a strong bearish signal
 Three Black Crows…!
Potential direction
The dark cloud cover pattern anticipates a bearish reversal. The
pattern comprises two candlesticks – a red candle that opens above
the previous green body and closes below its midpoint. It suggests
that bears have taken control of the market, pushing prices lower. If
the shadows of the candles are short, then traders could expect a
strong .
 Dark Cloud Cover…!
 Extra types of candlesticks
01
OPTION
03
OPTION
02
OPTION
04
OPTION
Spinning Top
Falling Three
Methods
Doji
Patterns
 Doji
The Doji candlestick has an exceptionally small body and long
shadows. While it is generally perceived as a trend continuation
pattern, traders should be careful because it might also end up with a
reversal. To avoid confusion, you should open a position a few candles
after Doji when the situation becomes clear.
The potential
direction can be
on both sides.
 Spinning Top
Like Doji, the spinning top is a candlestick with a short body. However,
the two shadows are of equal length, leaving the body right in the
middle. This pattern also indicates indecision and may suggest a
period of rest or consolidation after a significant rally or price decline.
The potential
direction can be
on both sides.
 Falling Three Methods
Falling three-method is a pattern consisting of five candles, indicating
the continuation of a downtrend. It comprises a long red body,
followed by three consecutive green bodies that are small and
another long red body. The green candles are all covered by the
bearish reds, demonstrating that bulls don’t have enough power to
reverse the downtrend.
Stop loss
Entry Level
 Rising Three Methods
There is the rising three methods pattern as well, which can be
observed during uptrends. The pattern comprises a long green
followed by three small red candles and then another long green.
Potential direction
 Patterns
Bullish
stick
sandwich
Bearish
stick
sandwich
Stop loss
Entry level
Entry level
Entry level
Crypto Currencyy.pdf

Crypto Currencyy.pdf

  • 1.
  • 2.
    Table of contents 01 OPTION 03 OPTION 02 OPTION 04 OPTION Famouscurrency Candlesticks Introduction Patterns
  • 3.
    A cryptocurrency isa digital currency, which is an alternative form of payment created using encryption algorithms. The use of encryption technologies means that cryptocurrencies function both as a currency and as a virtual accounting system. To use cryptocurrencies, you need a cryptocurrency wallet. Introduction
  • 4.
  • 5.
    Advantages  Self-governed andmanaged: ...  Decentralized: ...  Cost-effective mode of transaction: ...  Currency exchanges finish smoothly: ...  Secure and private: ...  Easy transfer of funds
  • 6.
    Candlestick patterns aretechnical trading tools that have been used for centuries to predict price direction. · There are dozens of different candlestick .. Candlestick charts are used by traders to determine possible price movement based on past patterns.
  • 7.
     Candlestick chartsare easy to read after some practice, as they contain plenty of information related to historical price data. Even novice or advanced traders can read the candlestick chart by looking at the general trend visually.
  • 8.
    Types Of Candlesticks BullishBearish  Candlestick goes up  Candlestick goes Down
  • 9.
    Candlestick trading graphically displaysmarket sentiment. A close above an open indicates bullish market sentiment, and this is denoted by a Green candle. Such a candle is called a bull candle
  • 10.
    1 Add totitle Hammer Pattern 2Inverse Hammer 3 Bullish Engulfing 4 Piercing Line 5 Morning Star 6 Three White Soldiers
  • 11.
     Hammer Pattern…! Thehammer candlestick consists of a short body with a much longer lower shadow. As a rule, you will find it at the bottom of a downtrend. The pattern indicates that bulls resisted the selling pressure during a given period and pushed the price back up. While there may be hammer patterns with green and red candles, the former points to a stronger uptrend than red hammers.
  • 12.
     Inverse Hammer….! Theinverse hammer is quite similar to the previously described pattern. It is different from the standard hammer in that it has a much longer upper shadow while the lower wick is very short. The pattern suggests a buying pressure, followed by bears’ failed attempt to drag the price down. As a result, buyers come back with even stronger coercion and push prices higher. . Potential direction
  • 13.
     Bullish Engulfing.! Unlikethe previous two patterns, bullish engulfing is made up of two candlesticks. The first candle should be a short red body engulfed by a green candle, which is larger. While the second candle opens lower than the previous red one, the buying pressure increases, leading to a reversal of the downtrend. Potential direction
  • 14.
     Piercing Line..! Anothertwo-candlestick pattern is the piercing line, which may show up at the bottom of a downtrend, at the support level, or during a pullback. The pattern consists of a long red candle that is followed by a long green candle. The critical aspect of this pattern is that there is a significant gap between the red candle’s closing price and the green candle’s open price. The fact that the green candle opens much higher points to buying .
  • 15.
     Morning Star..! Themorning star pattern is more complex because it comprises three candlesticks: a long red followed by a short-bodied candle and a long green. Usually, the middle candle will have no overlap with the longer ones. The morning start suggests that the first period’s selling pressure is fading, and a bull market is forming. . Potential direction
  • 16.
     Three WhiteSoldiers…! Another three-stick candle is the three white soldiers. It is made up of three long green candles in a row, generally with microscopic shadows. The condition is that the three consecutive greens have to open and close higher than the previous period. It is regarded as a strong bullish signal that shows up after a downtrend. Potential direction Three White Soldiers
  • 17.
    A close belowan open indicates bearish market sentiment. This is denoted by a red candle and is called a bear candle.
  • 18.
    1 Add totitle Shooting Star 2Hanging Man 3 Bearish Engulfing 4 Evening Star 5 Three Black Crows 6 Dark Cloud Cover
  • 19.
     Shooting Star…! Theshooting star is the opposite of an inverted hammer. It consists of a red candle with a short body and a long upper shadow. Generally, the market will gap a bit higher on the candlestick opening and will surge to a local peak before closing just below the open. The body can sometimes be almost non-existent. Potential direction
  • 20.
     Hanging Man…! Thehanging man is the same pattern as the hammer, only inversed. Thus, it is formed by a green or red candlestick with a short body and a long lower shadow. It shows up at the end of an uptrend. It suggests a considerable sell-off during a given period, but bulls could temporarily push prices higher, after which they lose control. Potential direction
  • 21.
    The bearish engulfingis the inverse version of a bullish engulfing. The first candle has a small green body and is completely covered by the next long red candle. This pattern comes at the peak of an uptrend and suggests a reversal. The lower the second candle continues, the more momentum the bearish move will have.  Bearish Engulfing…! Potential direction
  • 22.
    Again, the eveningstar is the inverse version of the bullish morning star, and it represents a three-stick pattern. It consists of a short- bodied candle that comes between a long green candle and a large red candle.  Evening Star…! Potential direction
  • 23.
    The three blackcrows are like the bullish three white soldiers but only inversed. It comprises three long straight reds with short or almost non-existent shadows. Every new candle opens relatively at the same price as the previous candle, but it goes much lower with every close. This is regarded as a strong bearish signal  Three Black Crows…! Potential direction
  • 24.
    The dark cloudcover pattern anticipates a bearish reversal. The pattern comprises two candlesticks – a red candle that opens above the previous green body and closes below its midpoint. It suggests that bears have taken control of the market, pushing prices lower. If the shadows of the candles are short, then traders could expect a strong .  Dark Cloud Cover…!
  • 25.
     Extra typesof candlesticks 01 OPTION 03 OPTION 02 OPTION 04 OPTION Spinning Top Falling Three Methods Doji Patterns
  • 26.
     Doji The Dojicandlestick has an exceptionally small body and long shadows. While it is generally perceived as a trend continuation pattern, traders should be careful because it might also end up with a reversal. To avoid confusion, you should open a position a few candles after Doji when the situation becomes clear. The potential direction can be on both sides.
  • 27.
     Spinning Top LikeDoji, the spinning top is a candlestick with a short body. However, the two shadows are of equal length, leaving the body right in the middle. This pattern also indicates indecision and may suggest a period of rest or consolidation after a significant rally or price decline. The potential direction can be on both sides.
  • 28.
     Falling ThreeMethods Falling three-method is a pattern consisting of five candles, indicating the continuation of a downtrend. It comprises a long red body, followed by three consecutive green bodies that are small and another long red body. The green candles are all covered by the bearish reds, demonstrating that bulls don’t have enough power to reverse the downtrend. Stop loss Entry Level
  • 29.
     Rising ThreeMethods There is the rising three methods pattern as well, which can be observed during uptrends. The pattern comprises a long green followed by three small red candles and then another long green. Potential direction
  • 30.
  • 34.
  • 35.