Download as PDF, PPTX
![10
Doji: When opening and closing prices are almost the same we have a doji candle. However, as you can see on above Doji candles opening and closing prices npt always
may be virtually the same. On the other hand wick [shadow] length can be at different sizes on different occasions. Doji tells us there are some dog fight is going on the
market. Neither buyers or sellers were able to take charge, as a result we end up in bit of uncertainty. Indecision. However, we can decide on making a coffee for ourselves
while PA resolves itself.
Long Legged Doji: Same as above but it tells us dog fight is much more bigger. I really don't like messing around with big dogs.
Dragon Fly Doji: Opening and closing prices are highest of the candle. Opens high, travels south then comes back to opening price to close. Looks just like alphabet T, long
lower shadow and no upper one. We see that from the open, sellers were in charge but when they hit the bigger buyers, price has been pushed back to where sellers started.
It could be useful when it appears on a decent demand zone.. In my trading candlesticks and candlestick patterns carries any weight, when they appear on a decent buyers or](https://image.slidesharecdn.com/basiccandlestickpatterngood-8-240323021609-8ef0aaba/75/Basic-Candlestick-Pattern-in-stock-market-finance-10-2048.jpg)
![12
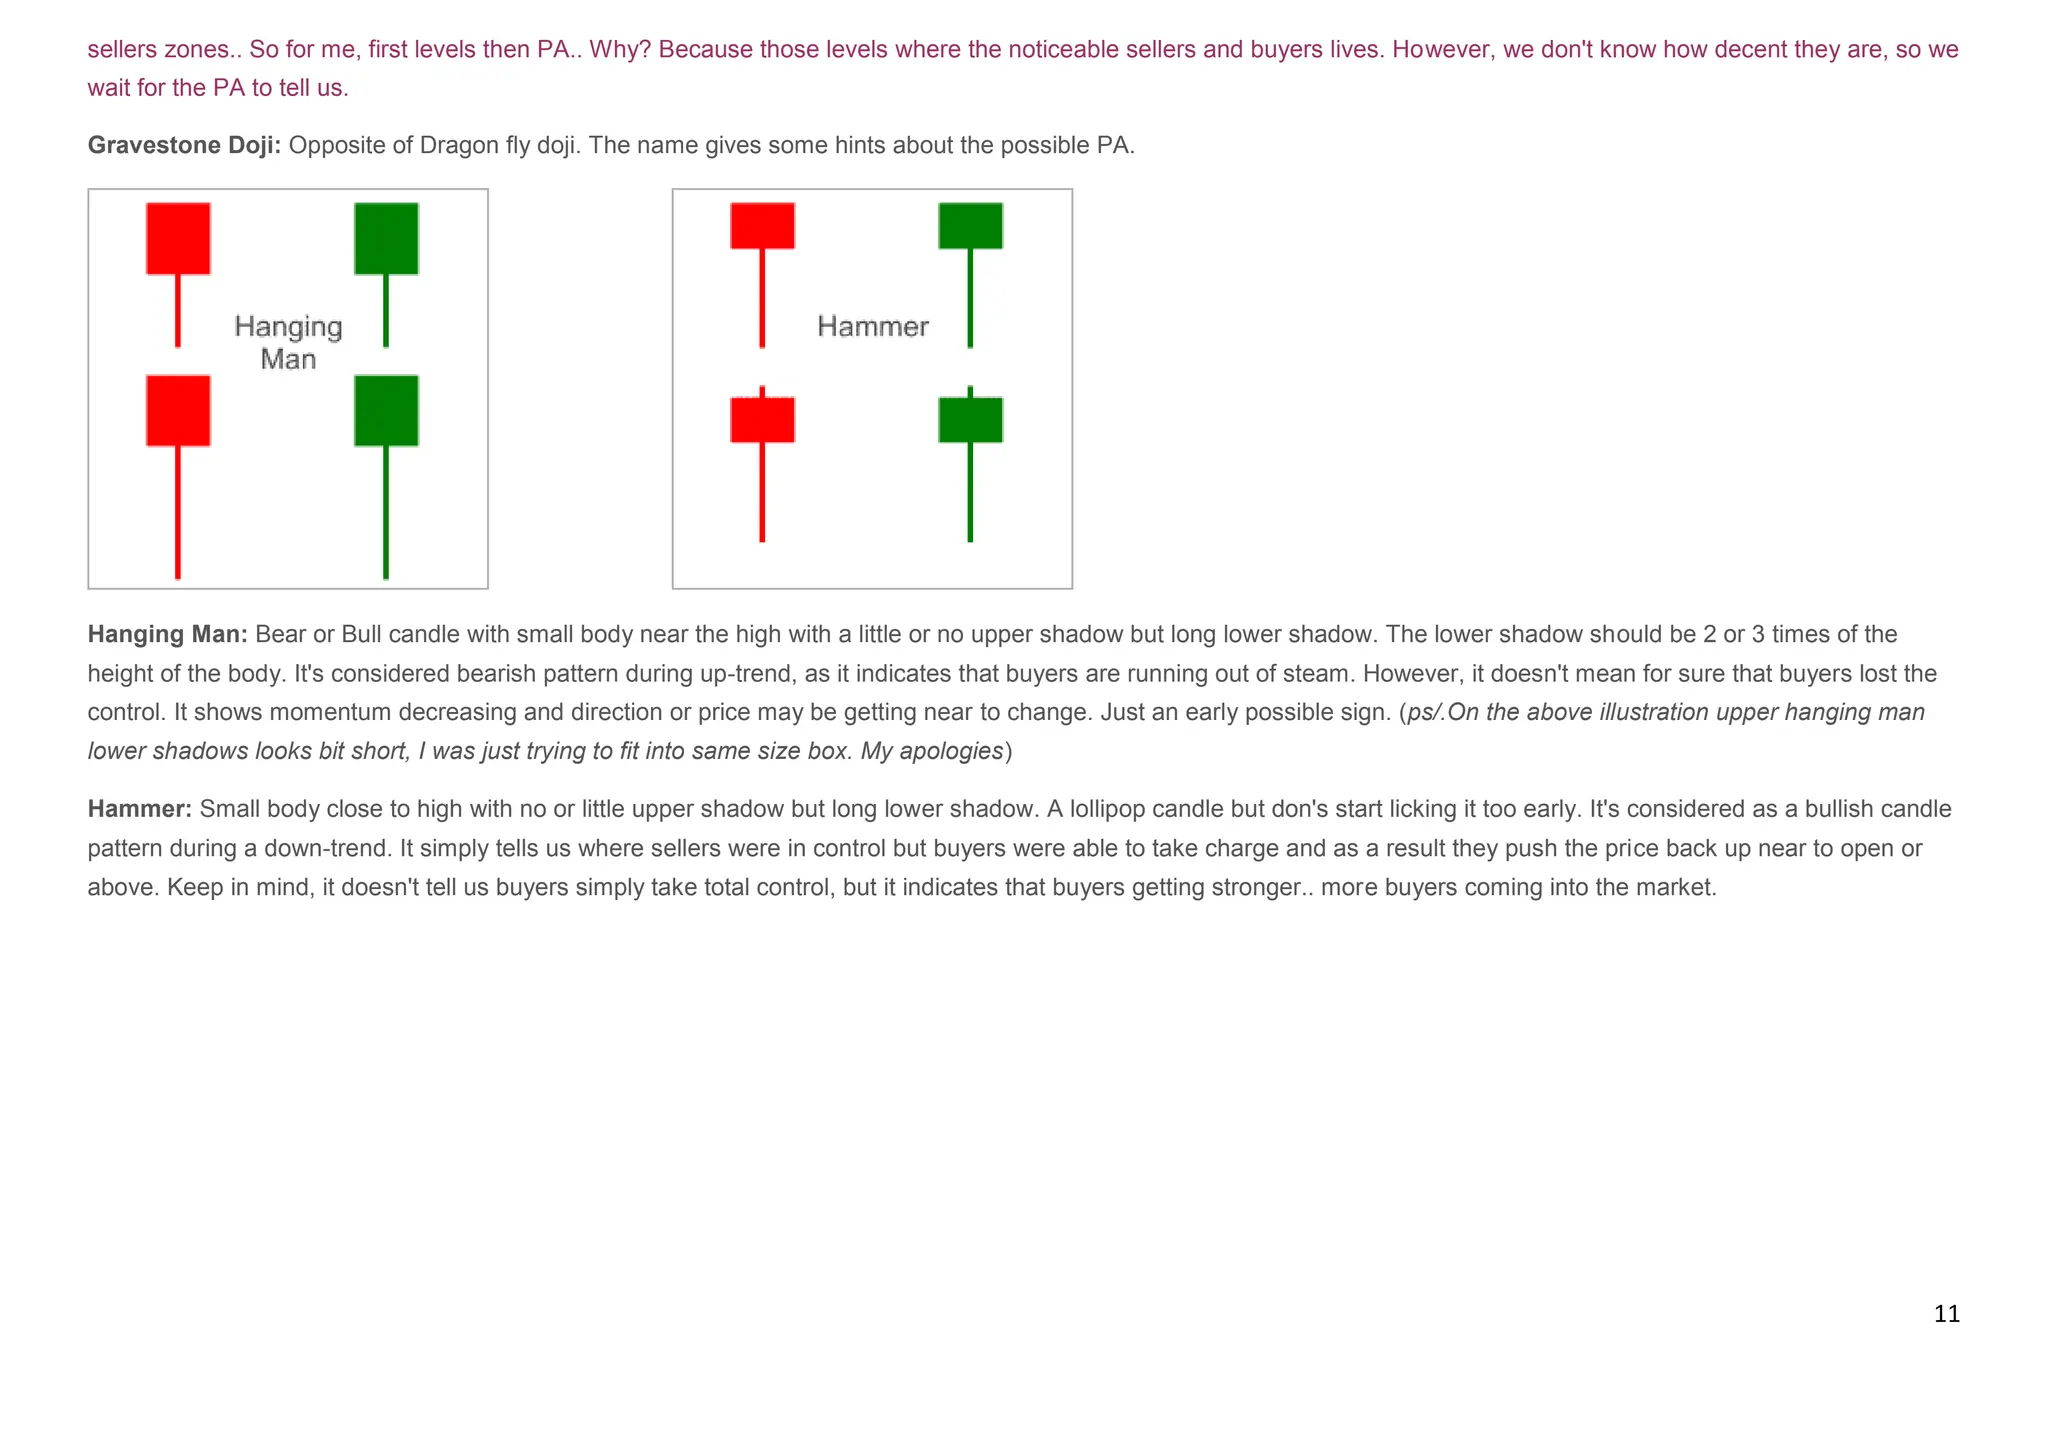
Inverted Hammer: Considered as a bullish reversal sign in a down-trend. After a down move, long upper shadow tells us there were some buyers but they failed to sustain
the move as it close below their high. Need further confirmation about buyers strenght. It would be better, if see inverted hammer followed by gap up or long bull candle with a
decent volume.
Long Lower/Upper Shadow: Bear or Bull candlestick with a lower or upper shadow which has 2, 3 or more times bigger than total candlestick body. Bear candle considered
as bearish sign while bull candle bullish.. Once again all these carries any weight in and around decent levels.
Marubozu: Main characteristic of this bear or bull candle is that there are no upper or lower shadows [wicks]. It's considered as a continuation sign.
Shooting Star: Bear or bull candles with small body, little or no lower shadow and long upper shadow. It's considered a bearish/reversal sign in an up-trend. However,
confirmation required. It would nice to see gap down or longish bear candle after shooting star before entry.](https://image.slidesharecdn.com/basiccandlestickpatterngood-8-240323021609-8ef0aaba/75/Basic-Candlestick-Pattern-in-stock-market-finance-12-2048.jpg)
![13
Inside a Candle: When I was new in trading and started to use candlestick charts, I use to think prices moved like in sequence A to form a candle as illustrated above.
However, reality is not that straight forward. Do not assume anything and investigate it yourself to find out how it happens. If you want to see how any one candle is build,
what it's price structure, just go down to lower time frames. This could be a useful eye opener for new traders or traders new to candlestick charts.
I cannot remember the name of it at present, but there is an indicator that enables you to display, say H1 candles on M5 chart and so on. I had a good fun with this indi while I
was trying to understand price structures..
Next, I will delve into "Reversal Candle Patterns"
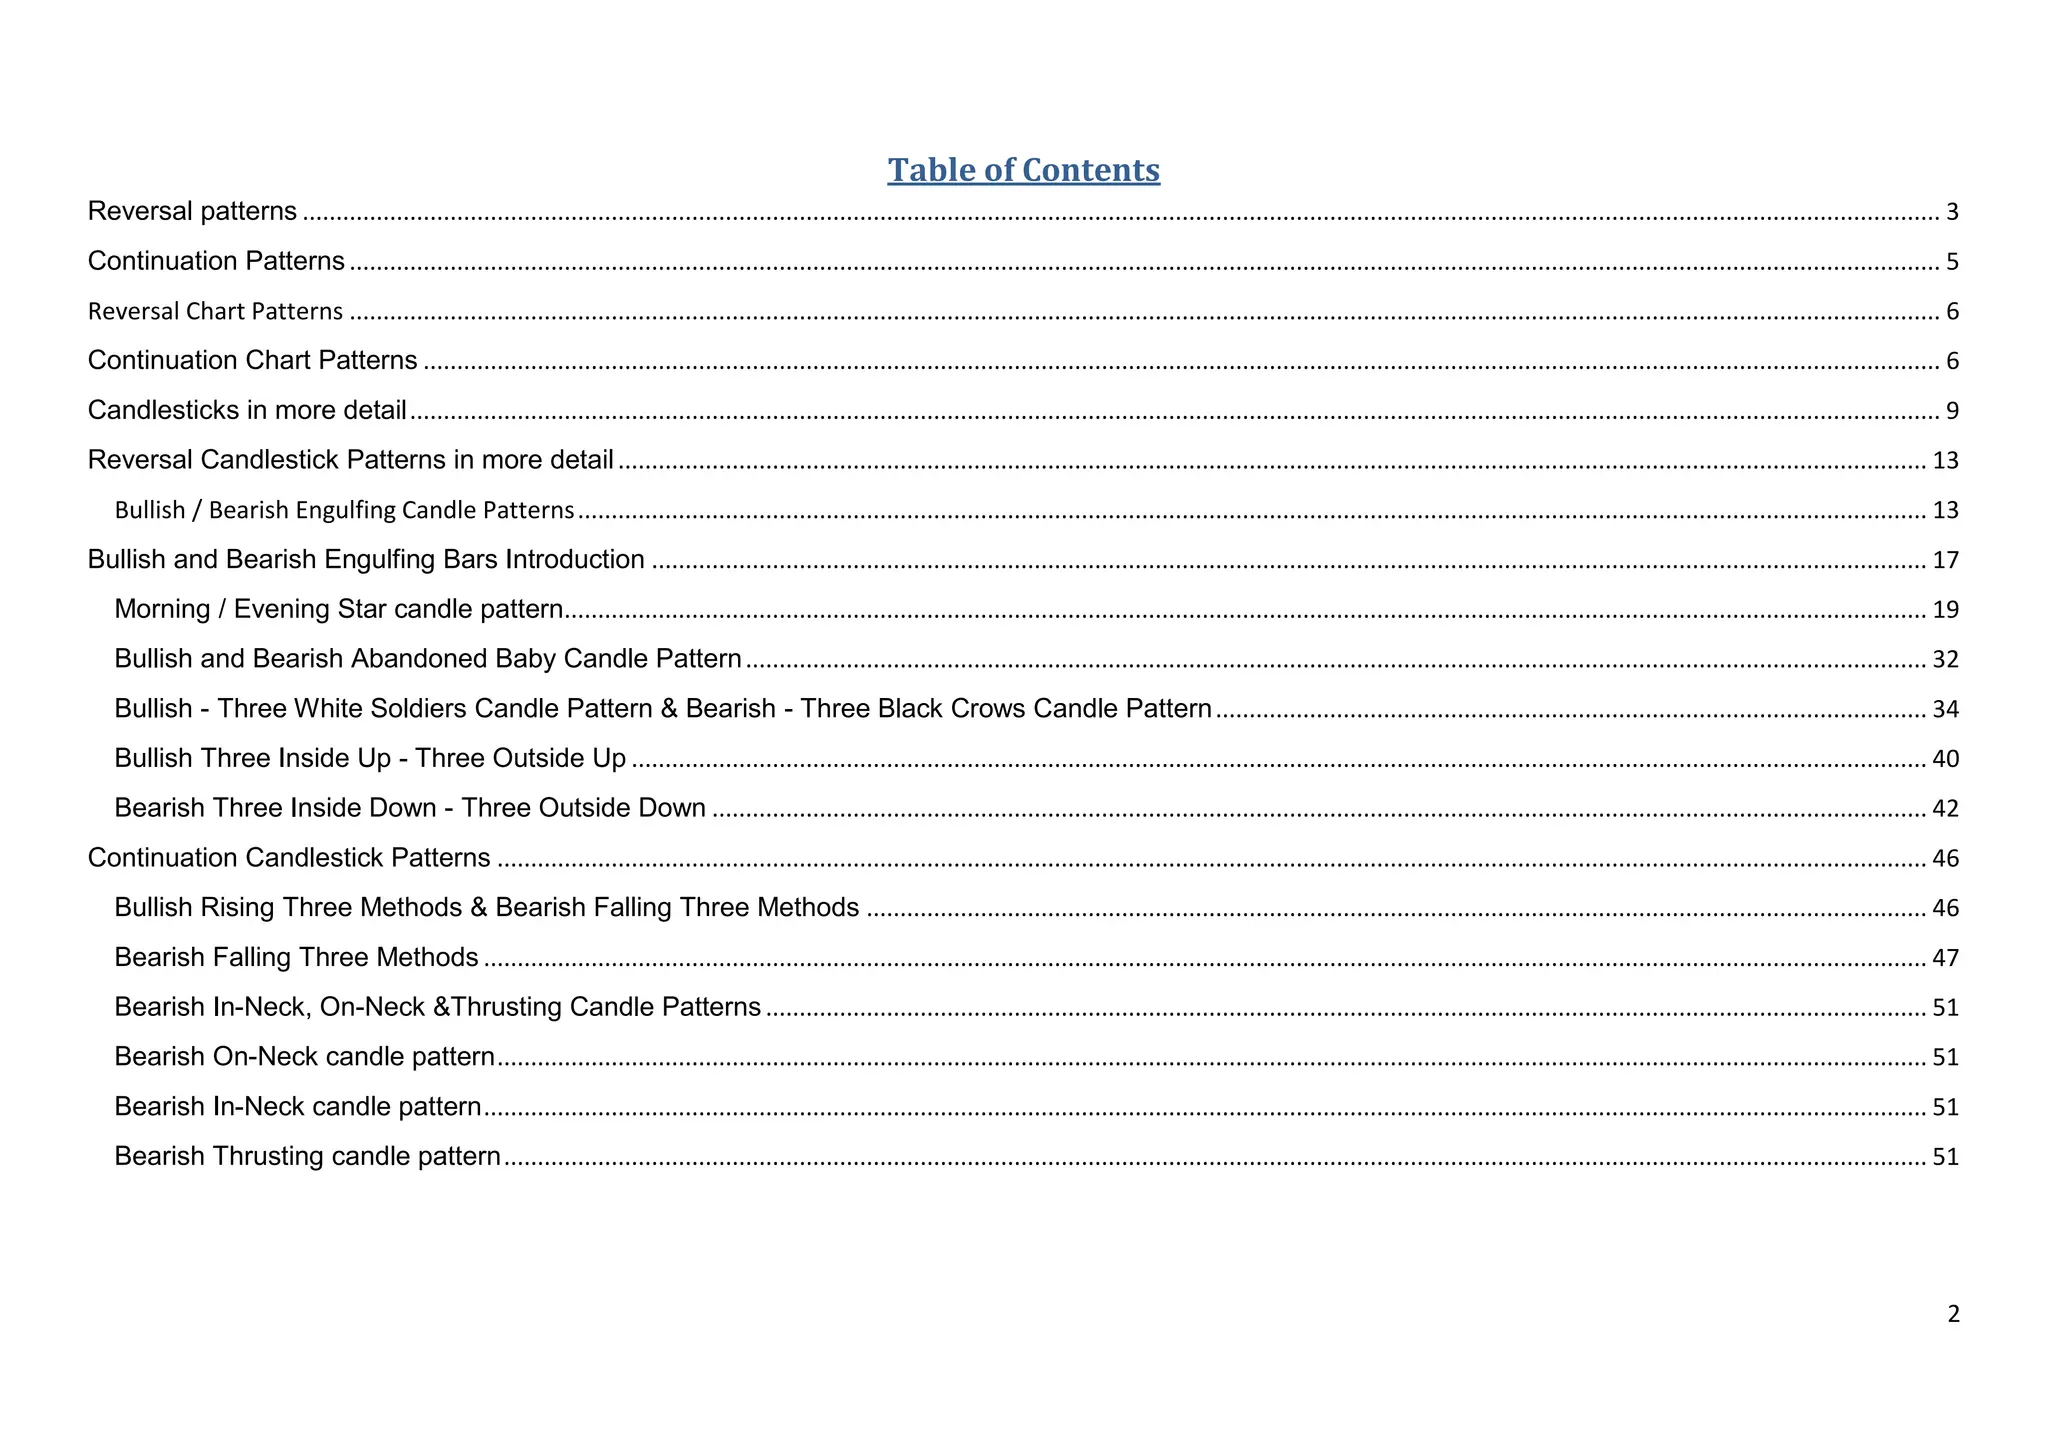
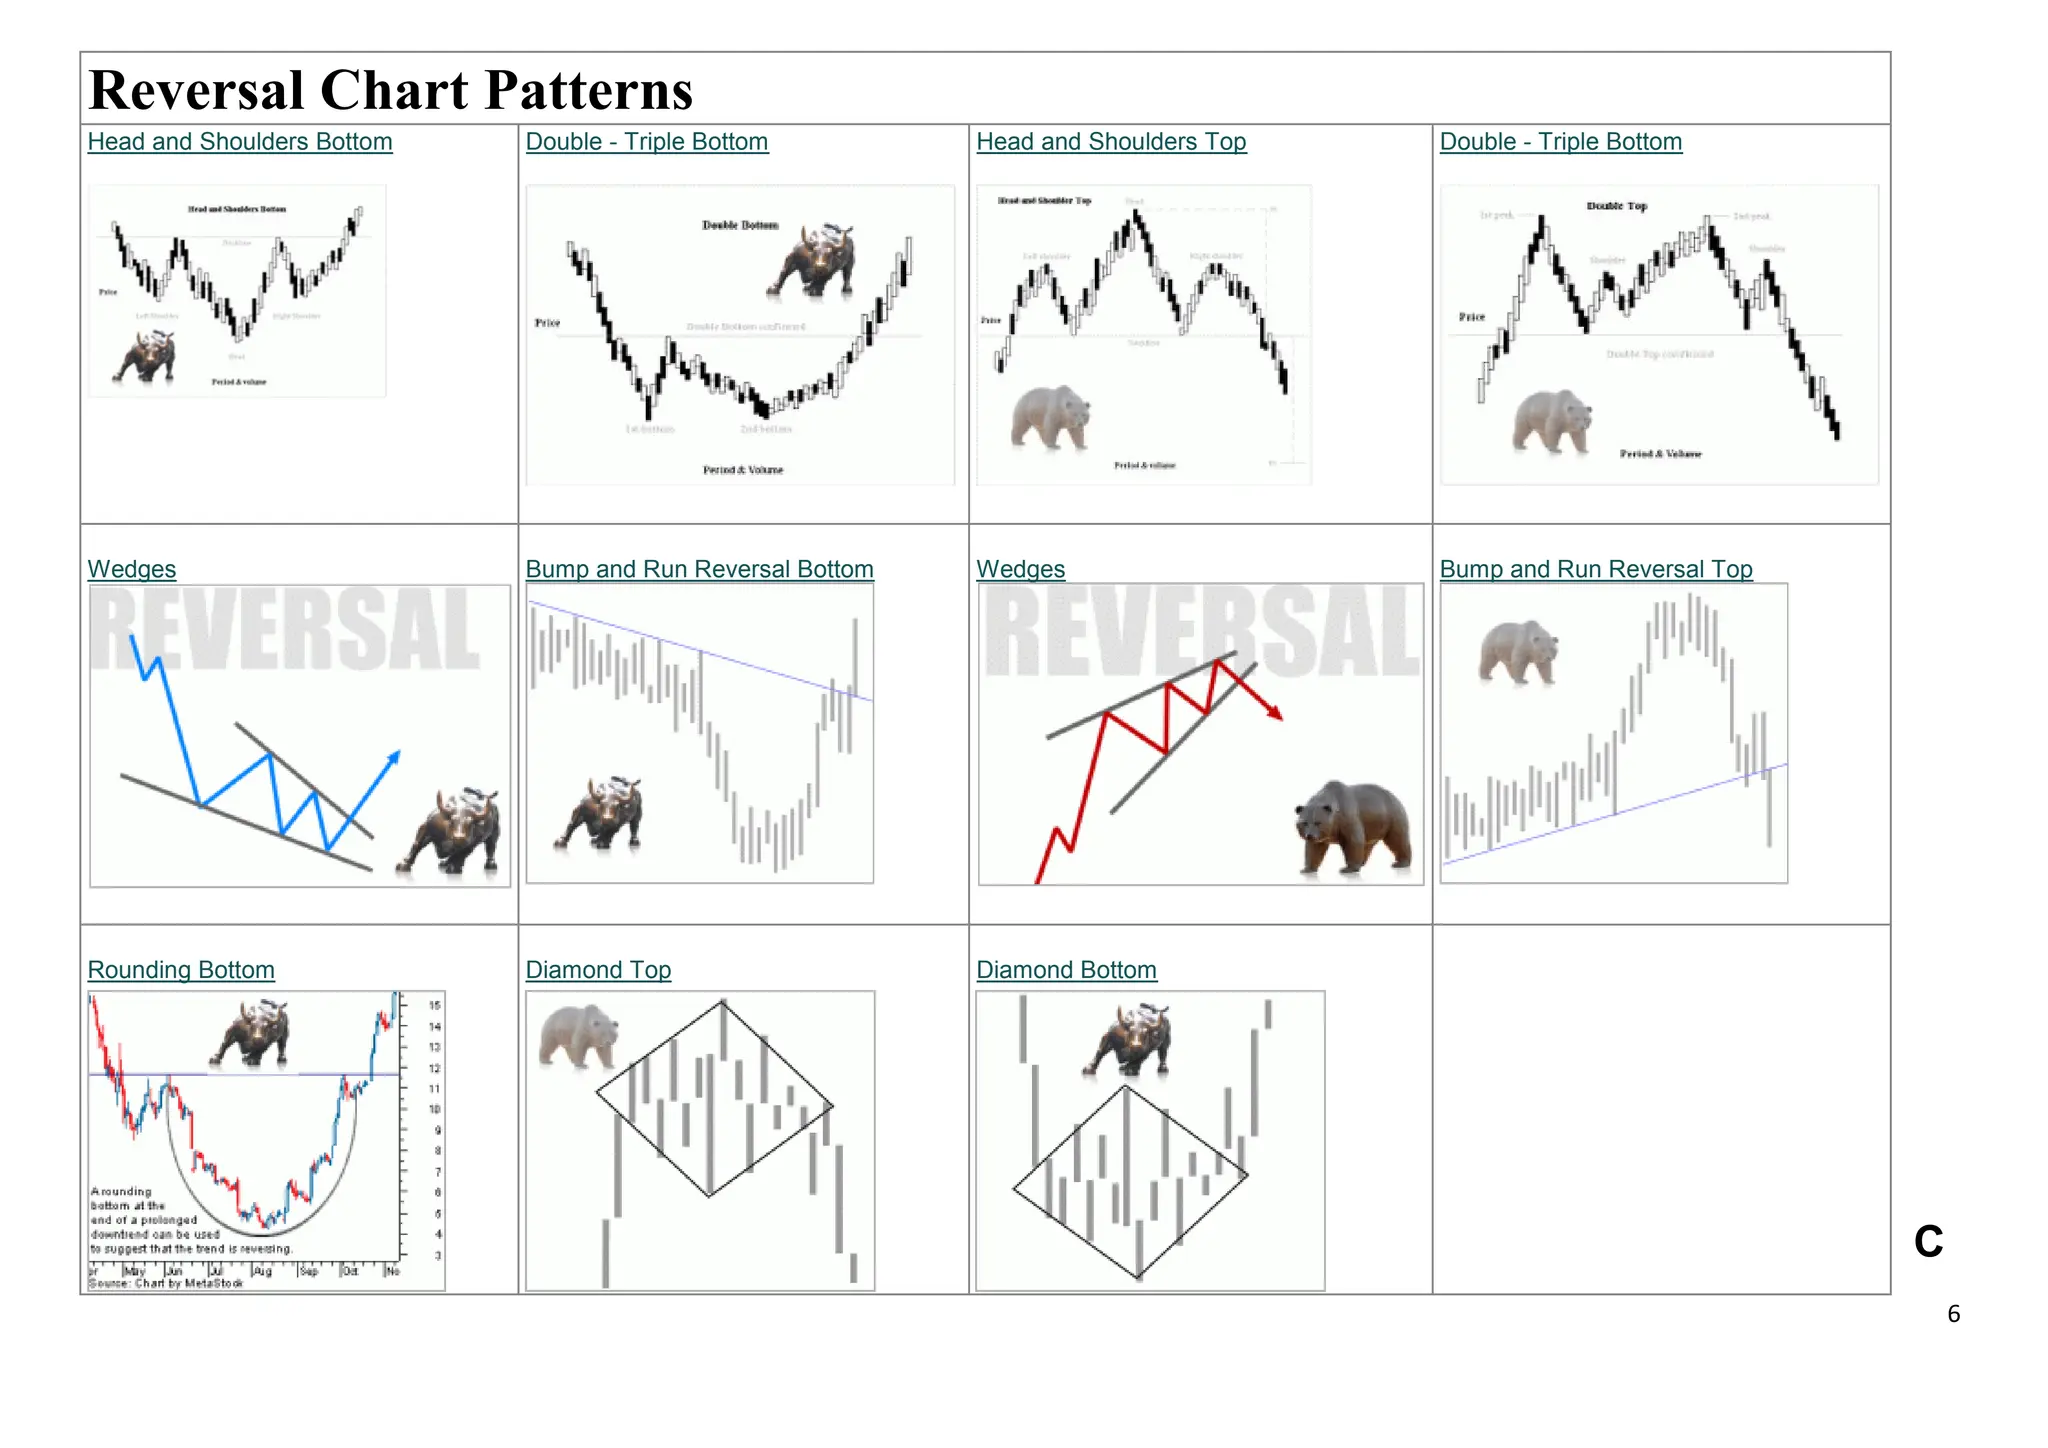
Reversal Candlestick Patterns in more detail
Please keep in mind these candle patterns are important within their rightfull context. Meaning they shine in Sellers and Buyers [Supply & Demand] zones, not betwwen. For
instance you may see engulfing candle in the middle of a move in either way. It usually doesn't mean anything much unless, we witness establishing of a fresh zone.
Bullish / Bearish Engulfing Candle Patterns
Lets start with engulfing pattern which is considered to be most strong of all in the right place.
As it's a reversal pattern, Engulfing candlestick pattern is most beneficial when there is a up or down trend. It's for identifying the turning/reversal point. It's kind of recognizing
top or bottom of given up or down trend move. Trends we are talking here is Time Frame specific. You may have many mini trends withing the scheme of larger trends and
therefore as you breakdown larger trend there will be many more turning points of mini trends in a smaller time frames.](https://image.slidesharecdn.com/basiccandlestickpatterngood-8-240323021609-8ef0aaba/75/Basic-Candlestick-Pattern-in-stock-market-finance-13-2048.jpg)
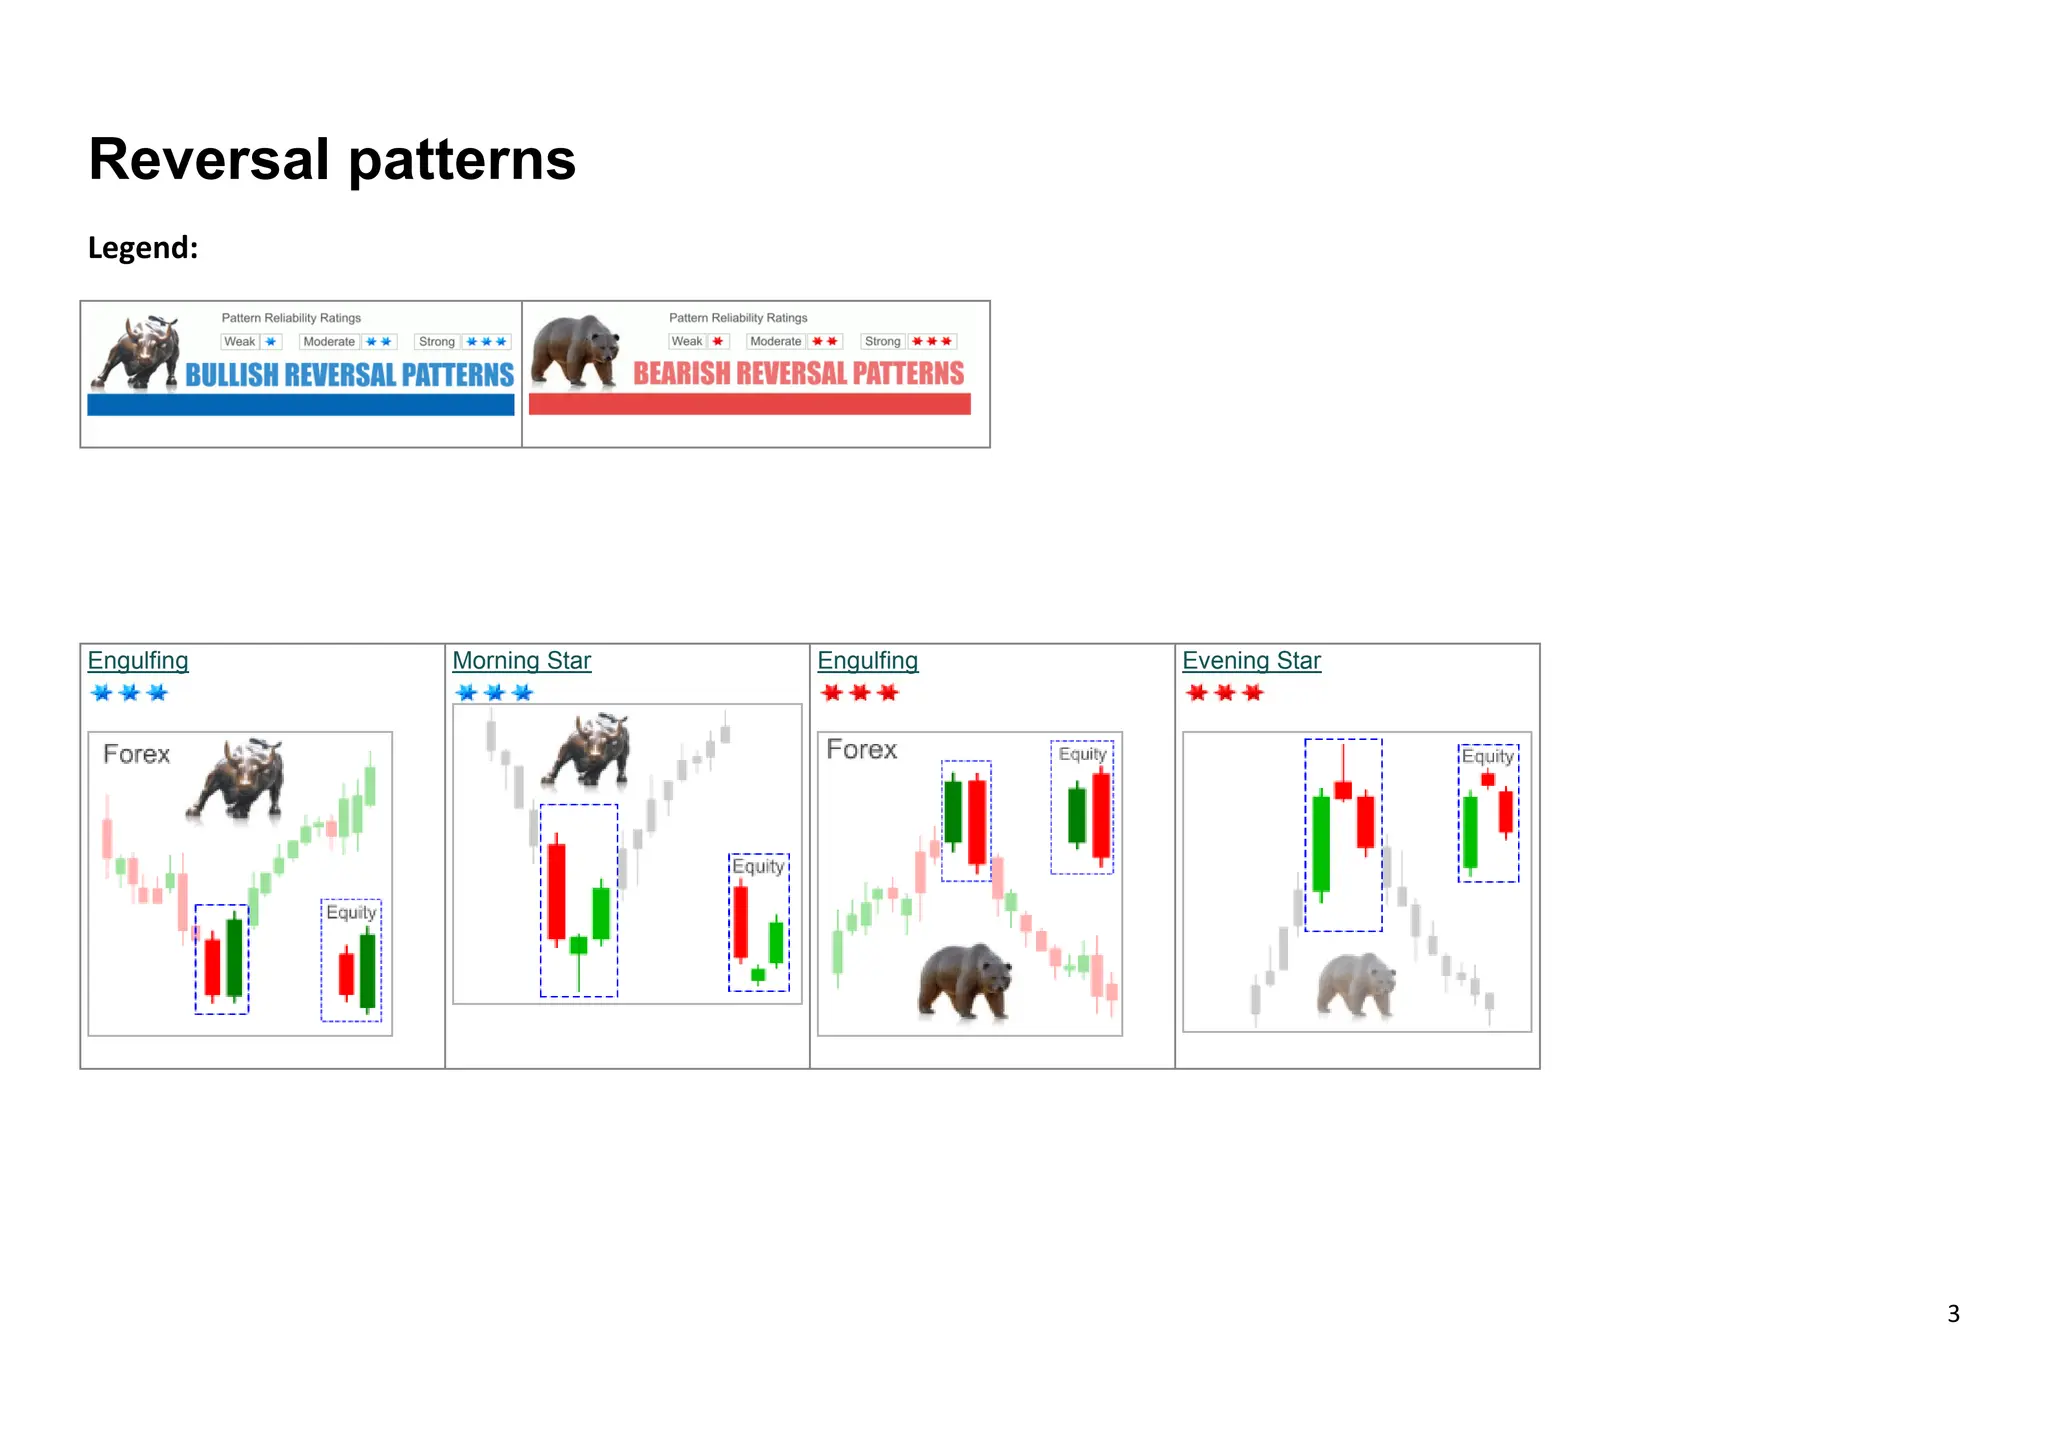
![14
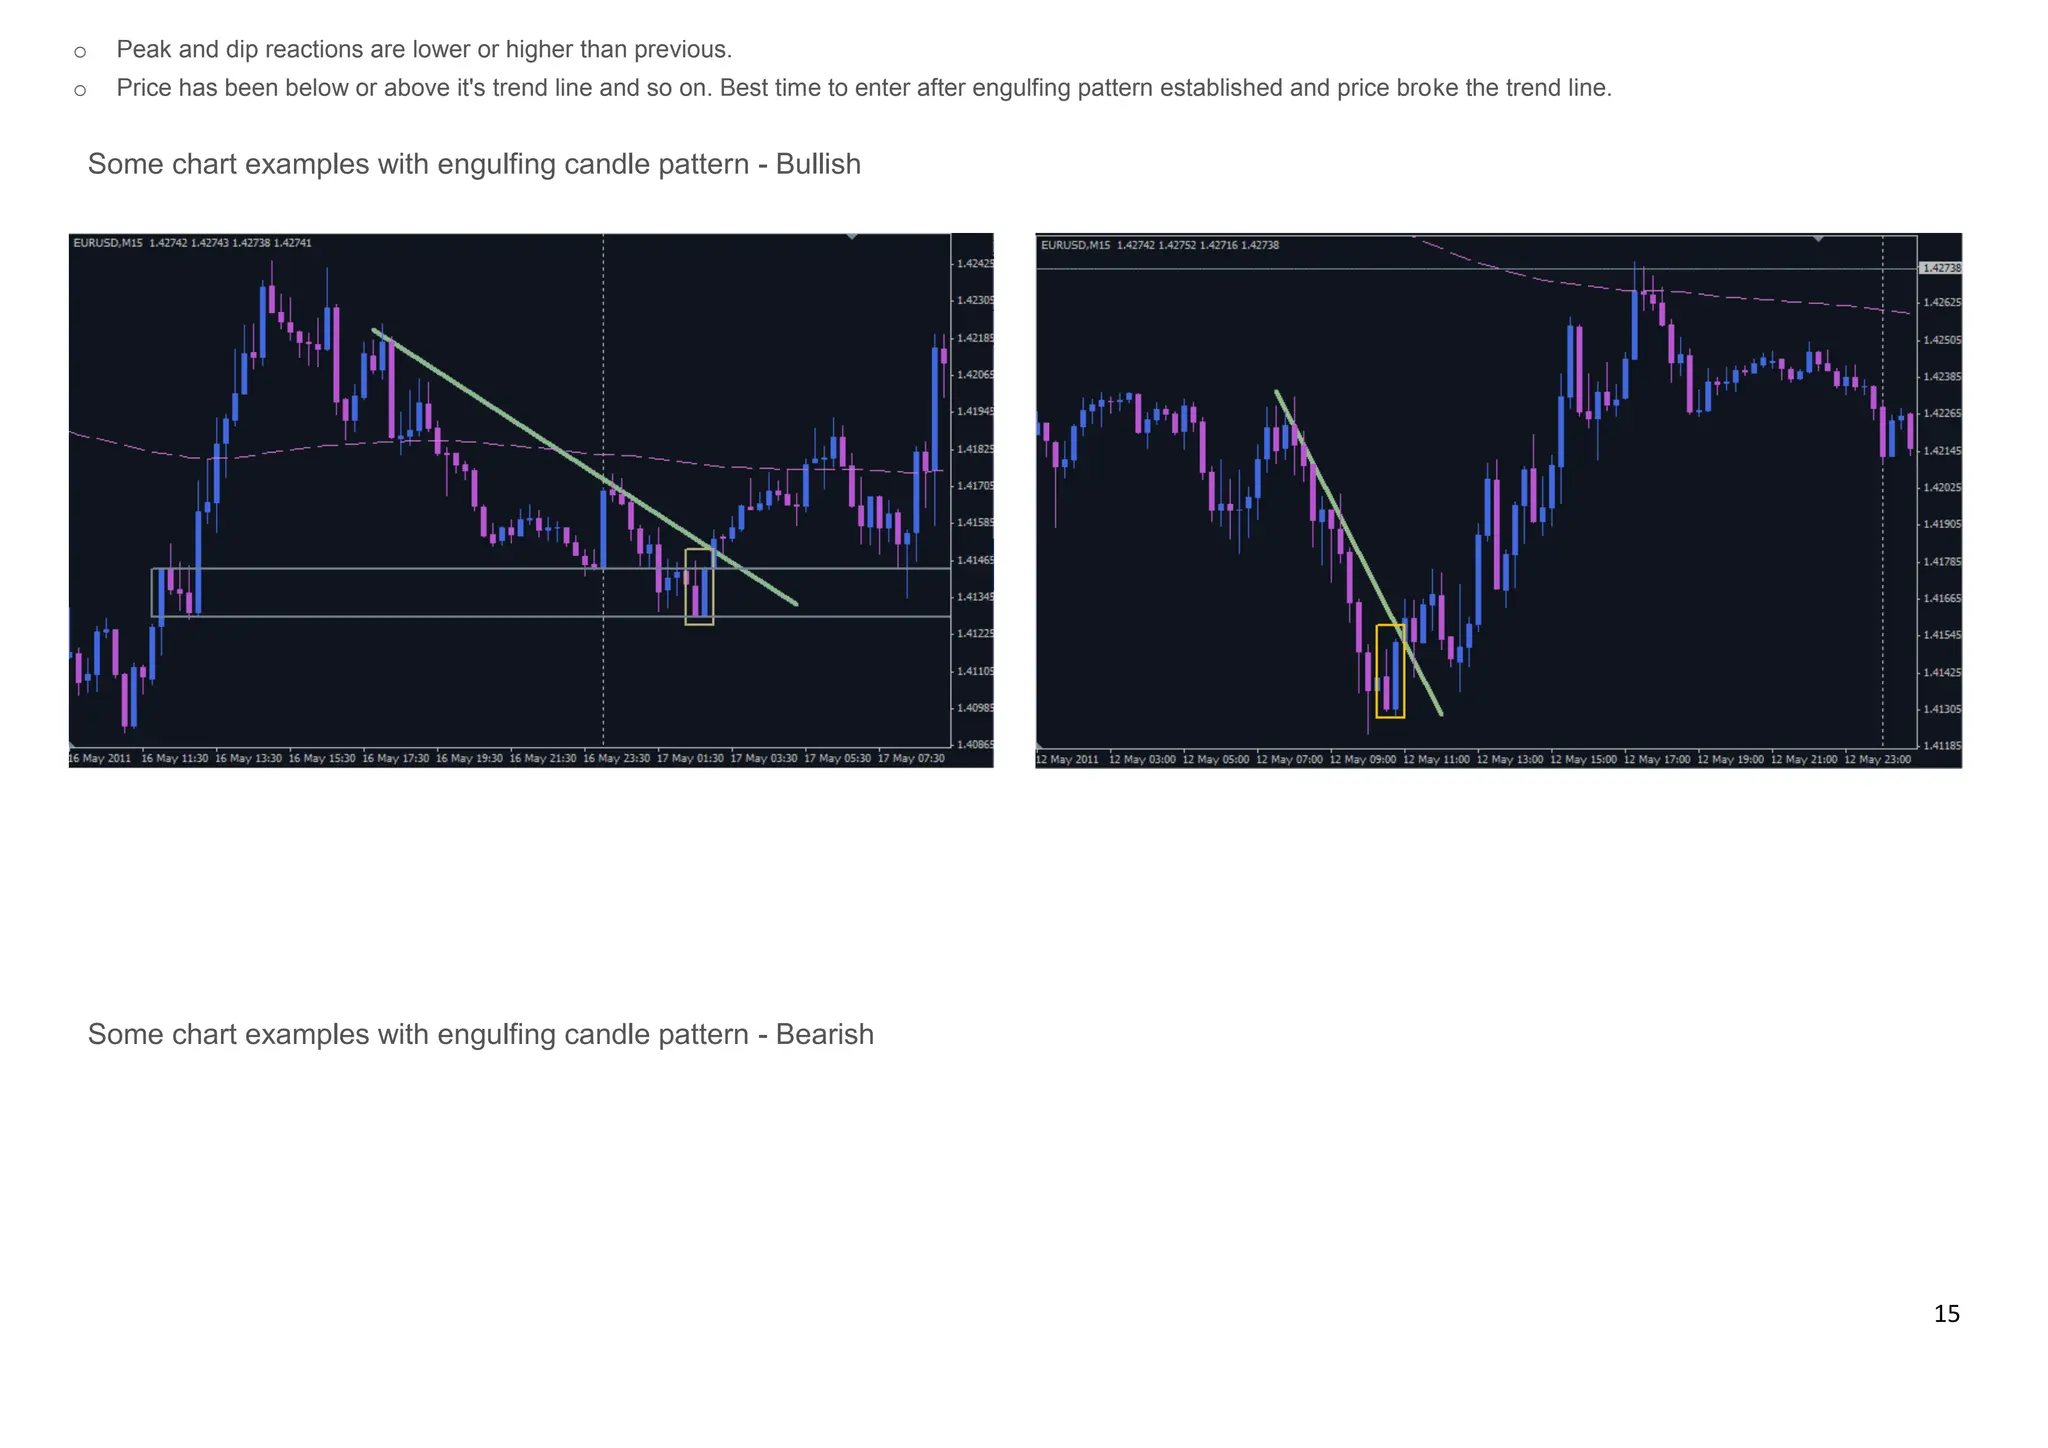
Keep in mind most patterns requires a confirmation. For example, just because we see an engulfing pattern on a uptrend that doesn't mean an auto sell assuming it'll turn
there. In order to move reverse, we need to see convincingly buyers or sellers overcomes one another in quantitative terms. High probability trades develops when these
patterns occurs in supply/demand zones.
Engulfing patterns are made of two candlestick, one down and one up. Bull and Bear candles. The picture on the left uses red for price going down [bear candle] and green
for price going up [bull candle. Different traders may use different colors which is not important.
The important aspect that second candle totally engulfs the first one. It's even better if the body of the second candle even covers the first candles wicks too.However, it's not
necessery. Wicks are allowed, they are usually small or non exist intent.
The size of the first candle is not important but it shouldn't be a doji as it would be very easy to cover therefore force of the opposite move will suggest it's a weak one.
However, the size of the second candle does matter. Bigger is better [within reason]
o Look for the existing trend up or down
o See if the engulfing patterns occurs within supply and demand zones. Remember, engulfing patterns occurring in new highs or ranging markets cannot be considered
bearish or bullish reversal.. It'd more likely be a continuation.
How do we determine the existing of down or up trend? Some of the followings may be used for this purpose but my favorite one is to identify supply and demand levels and
work from there.](https://image.slidesharecdn.com/basiccandlestickpatterngood-8-240323021609-8ef0aaba/75/Basic-Candlestick-Pattern-in-stock-market-finance-14-2048.jpg)
![20
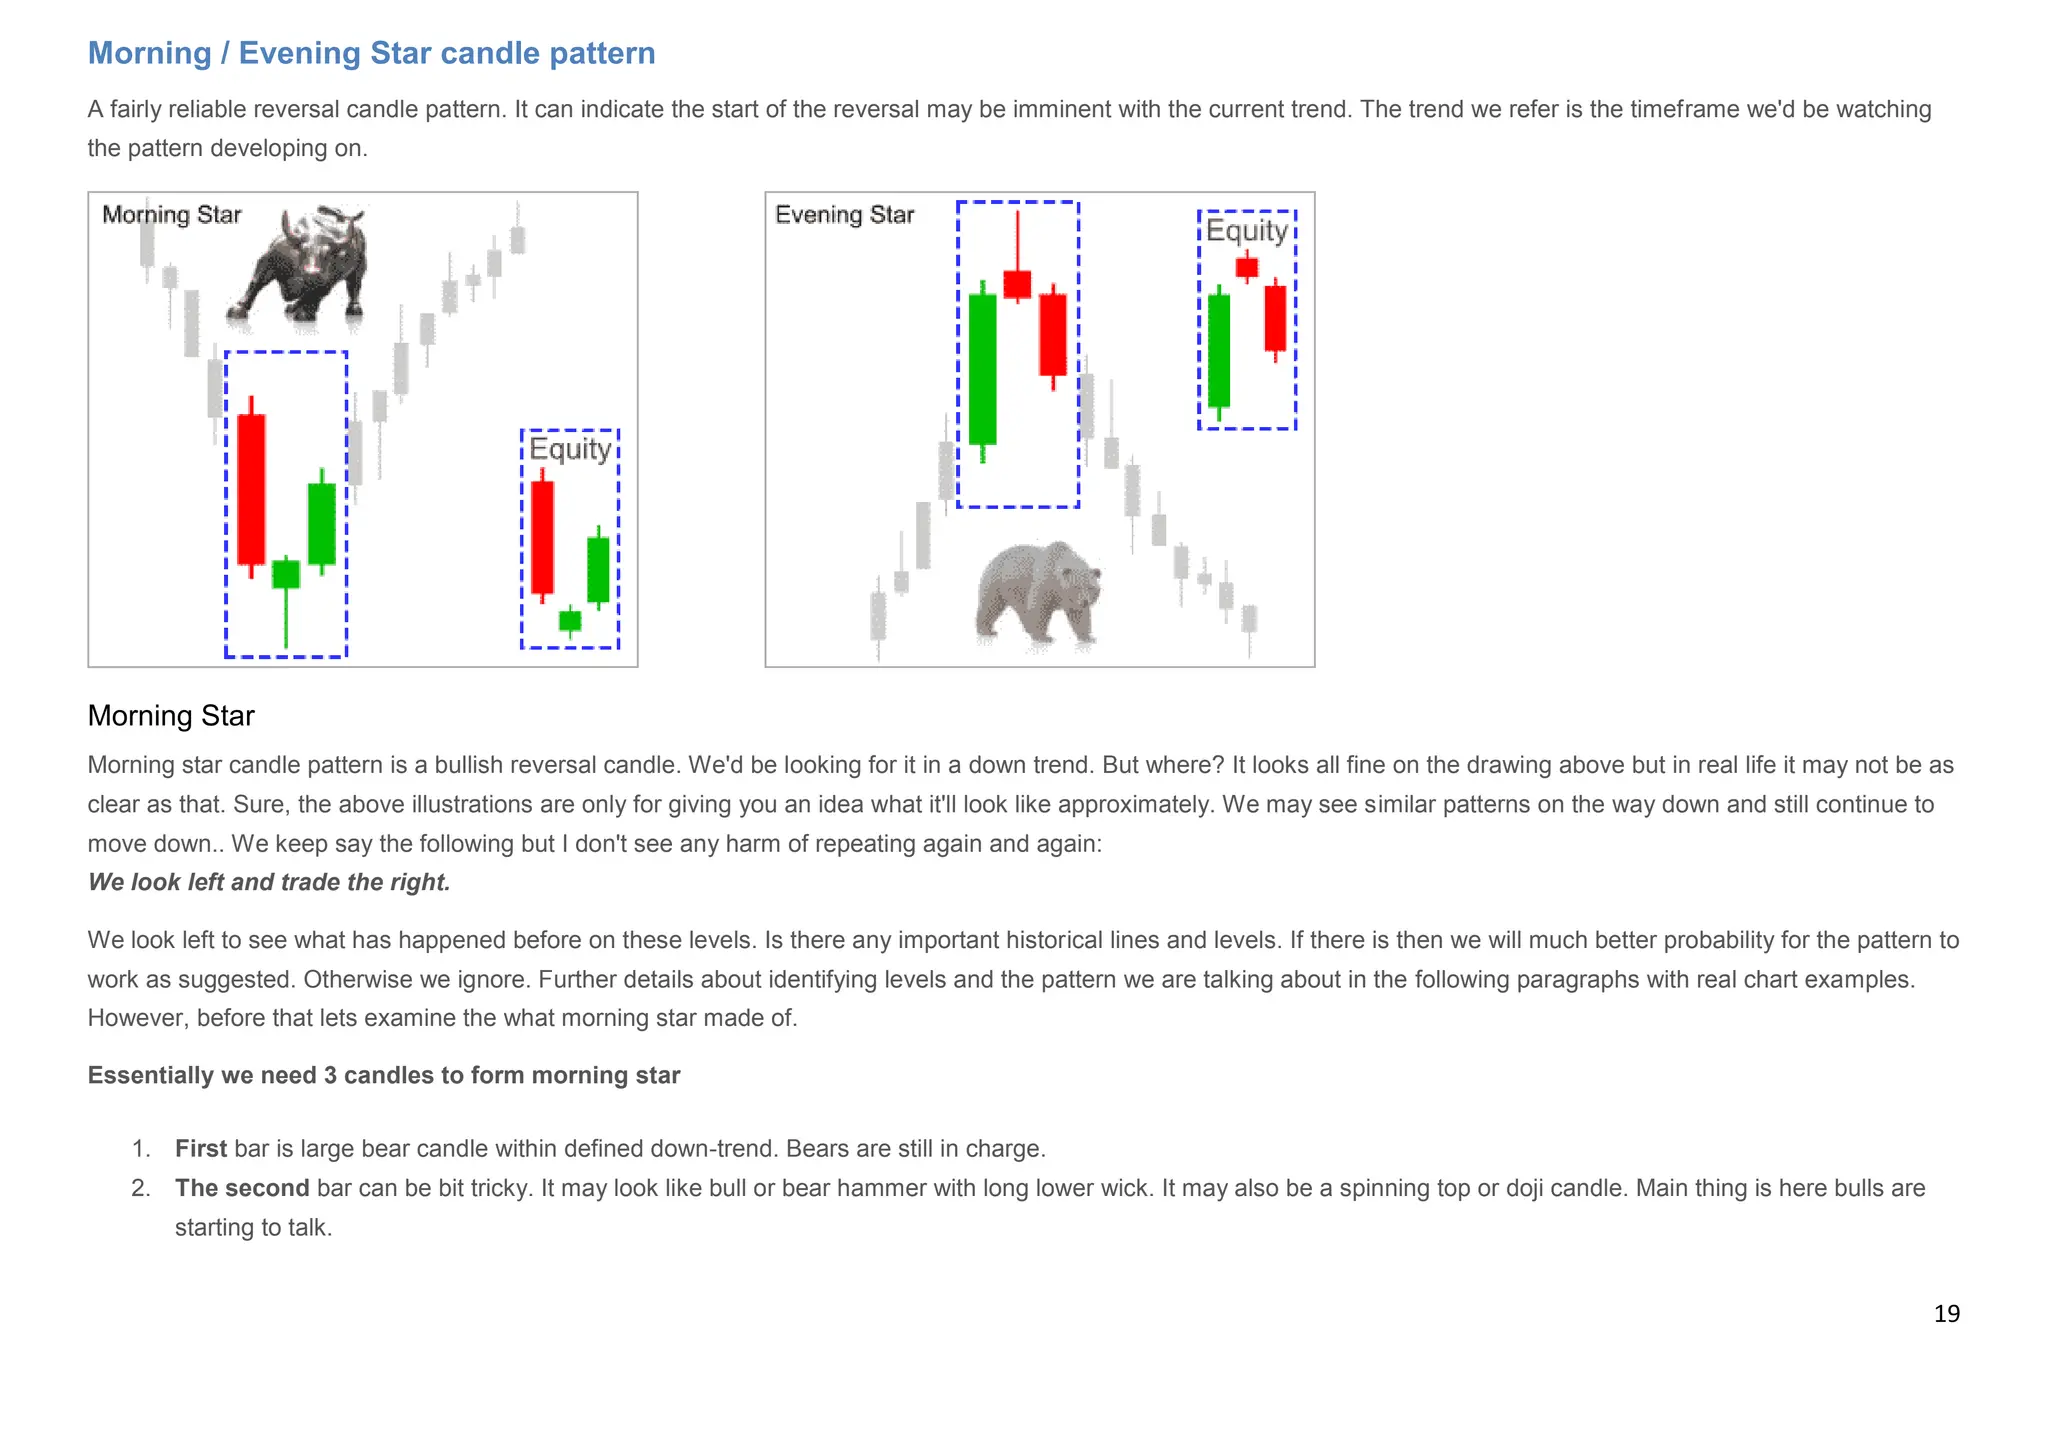
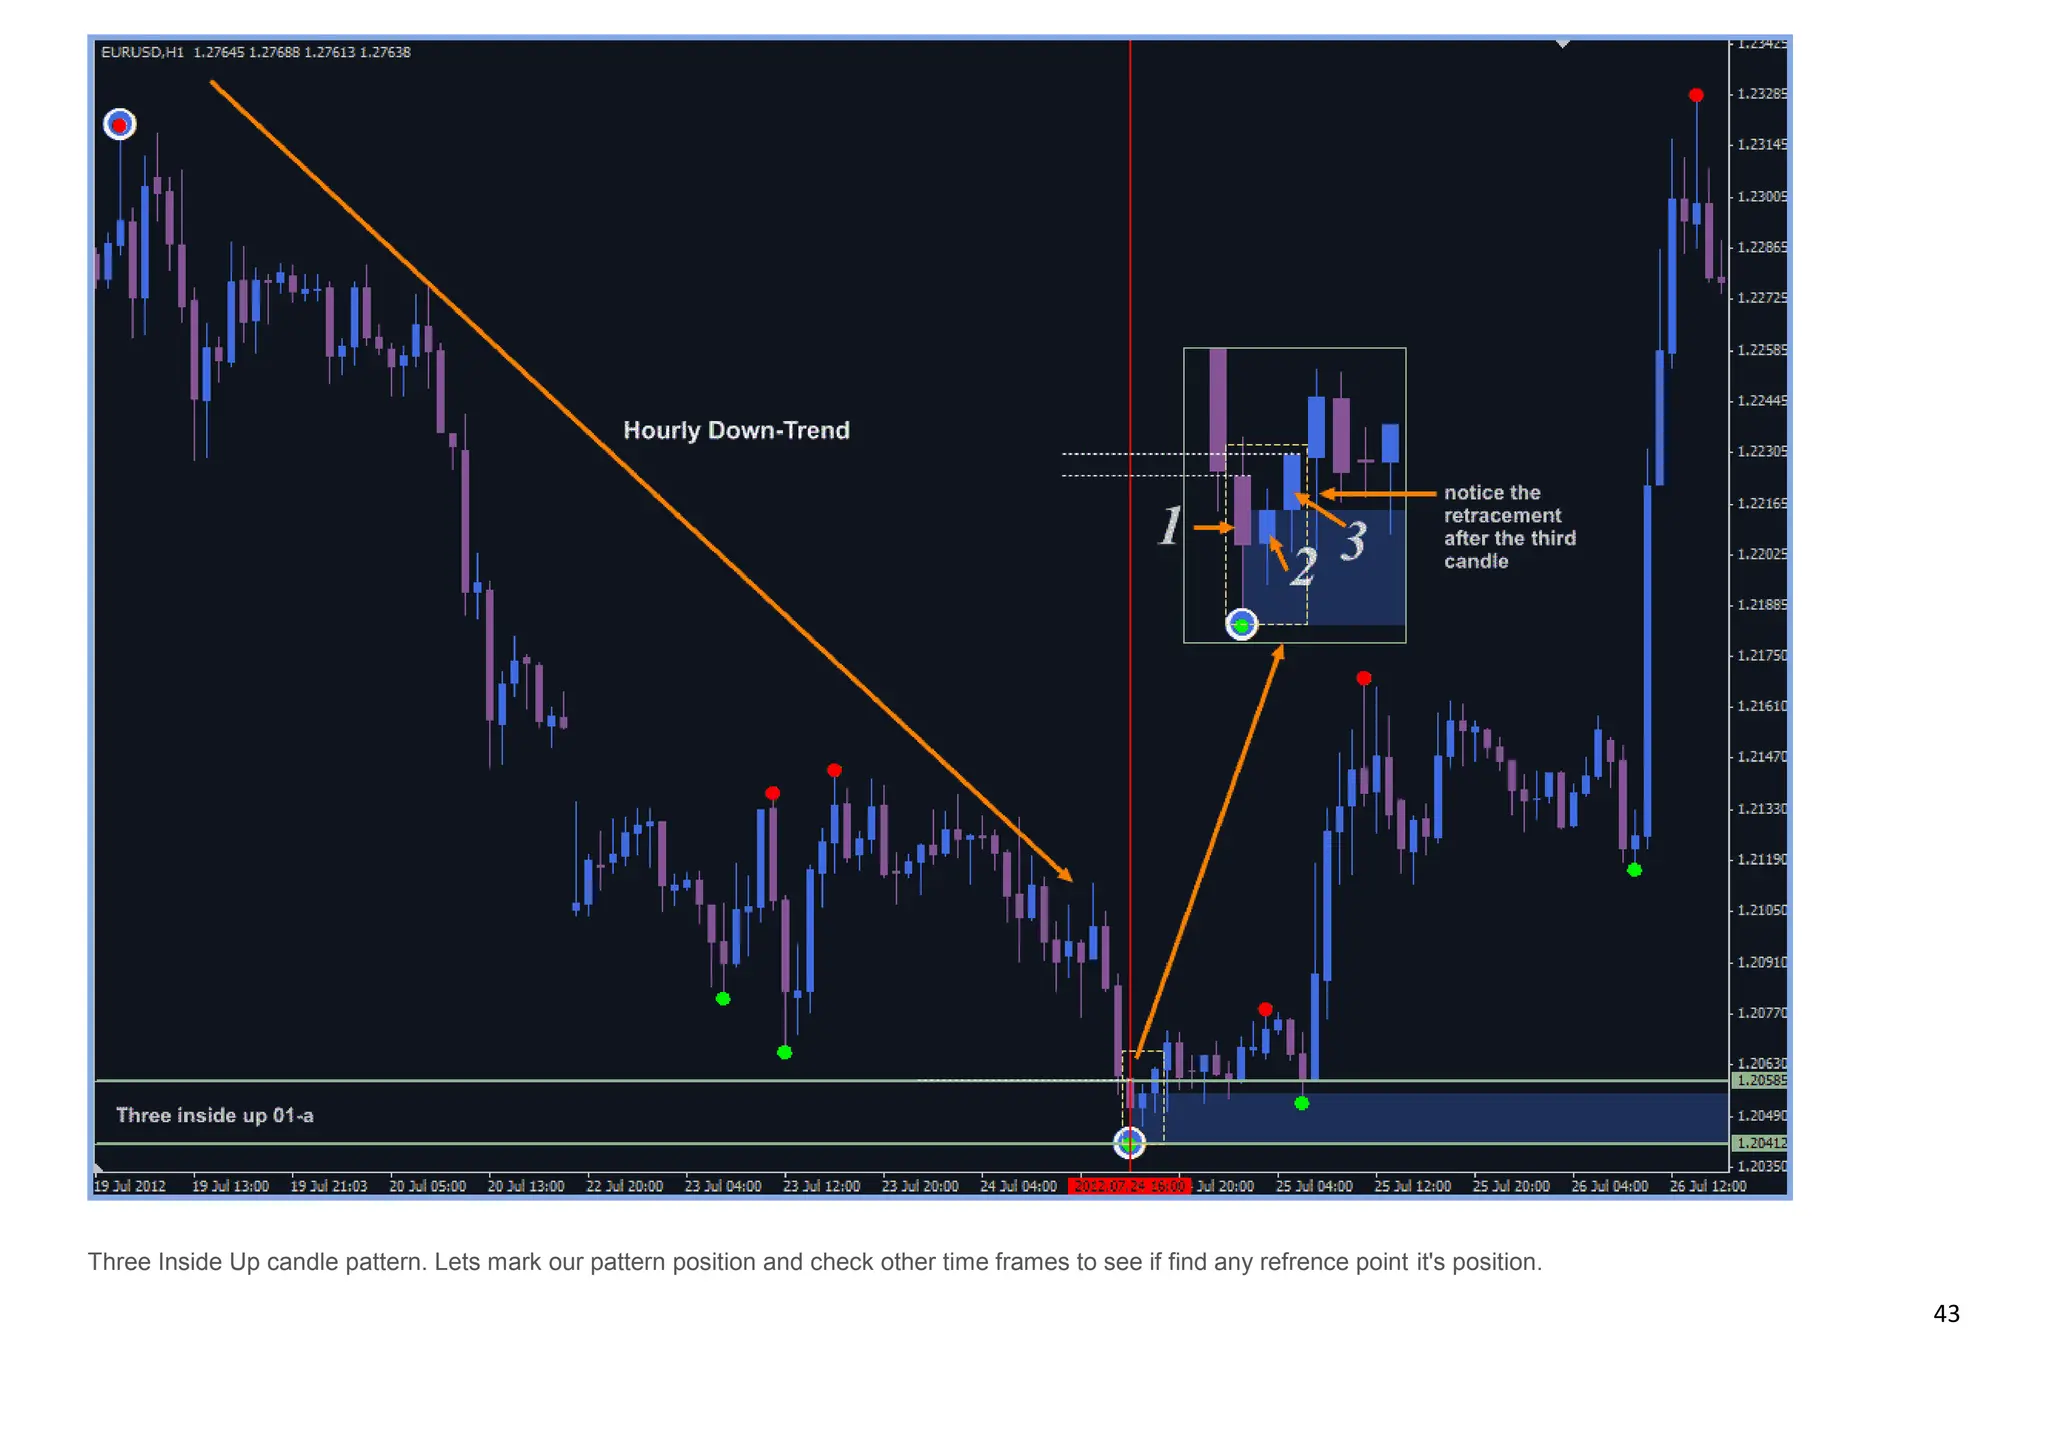
3. The third bar is a largish bull candle. The third candle should close at least more than the halfway above the first candle [large bear candle] We need to wait until
third candle closes to see if it's a valid morning star or not. Let the fat lady to finish her singing before jumping in any conclusion.
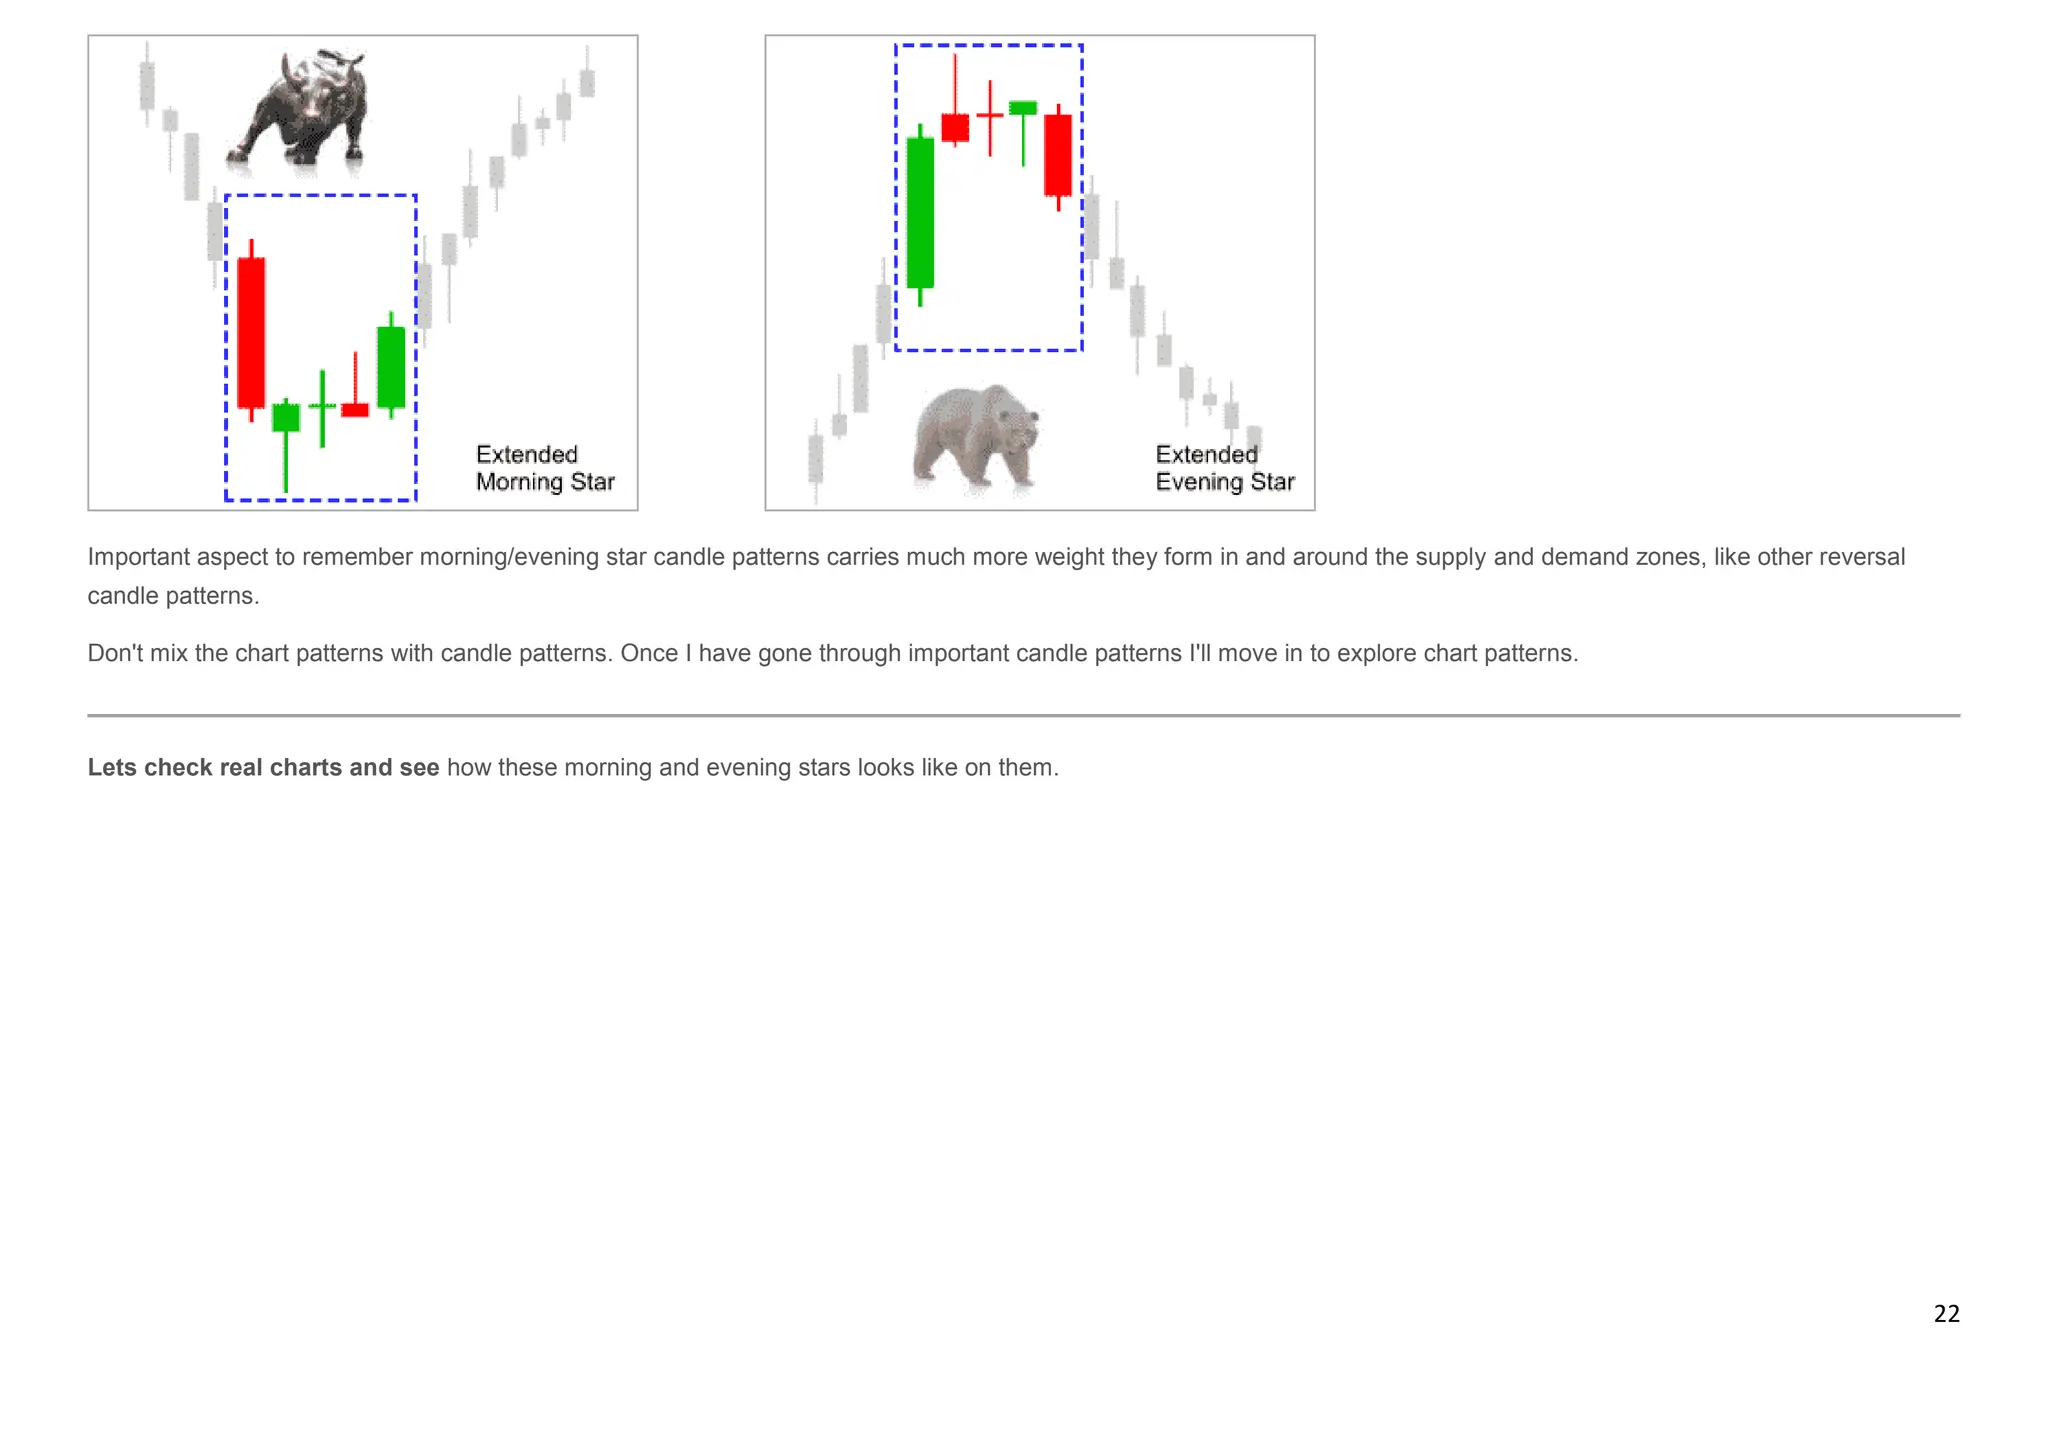
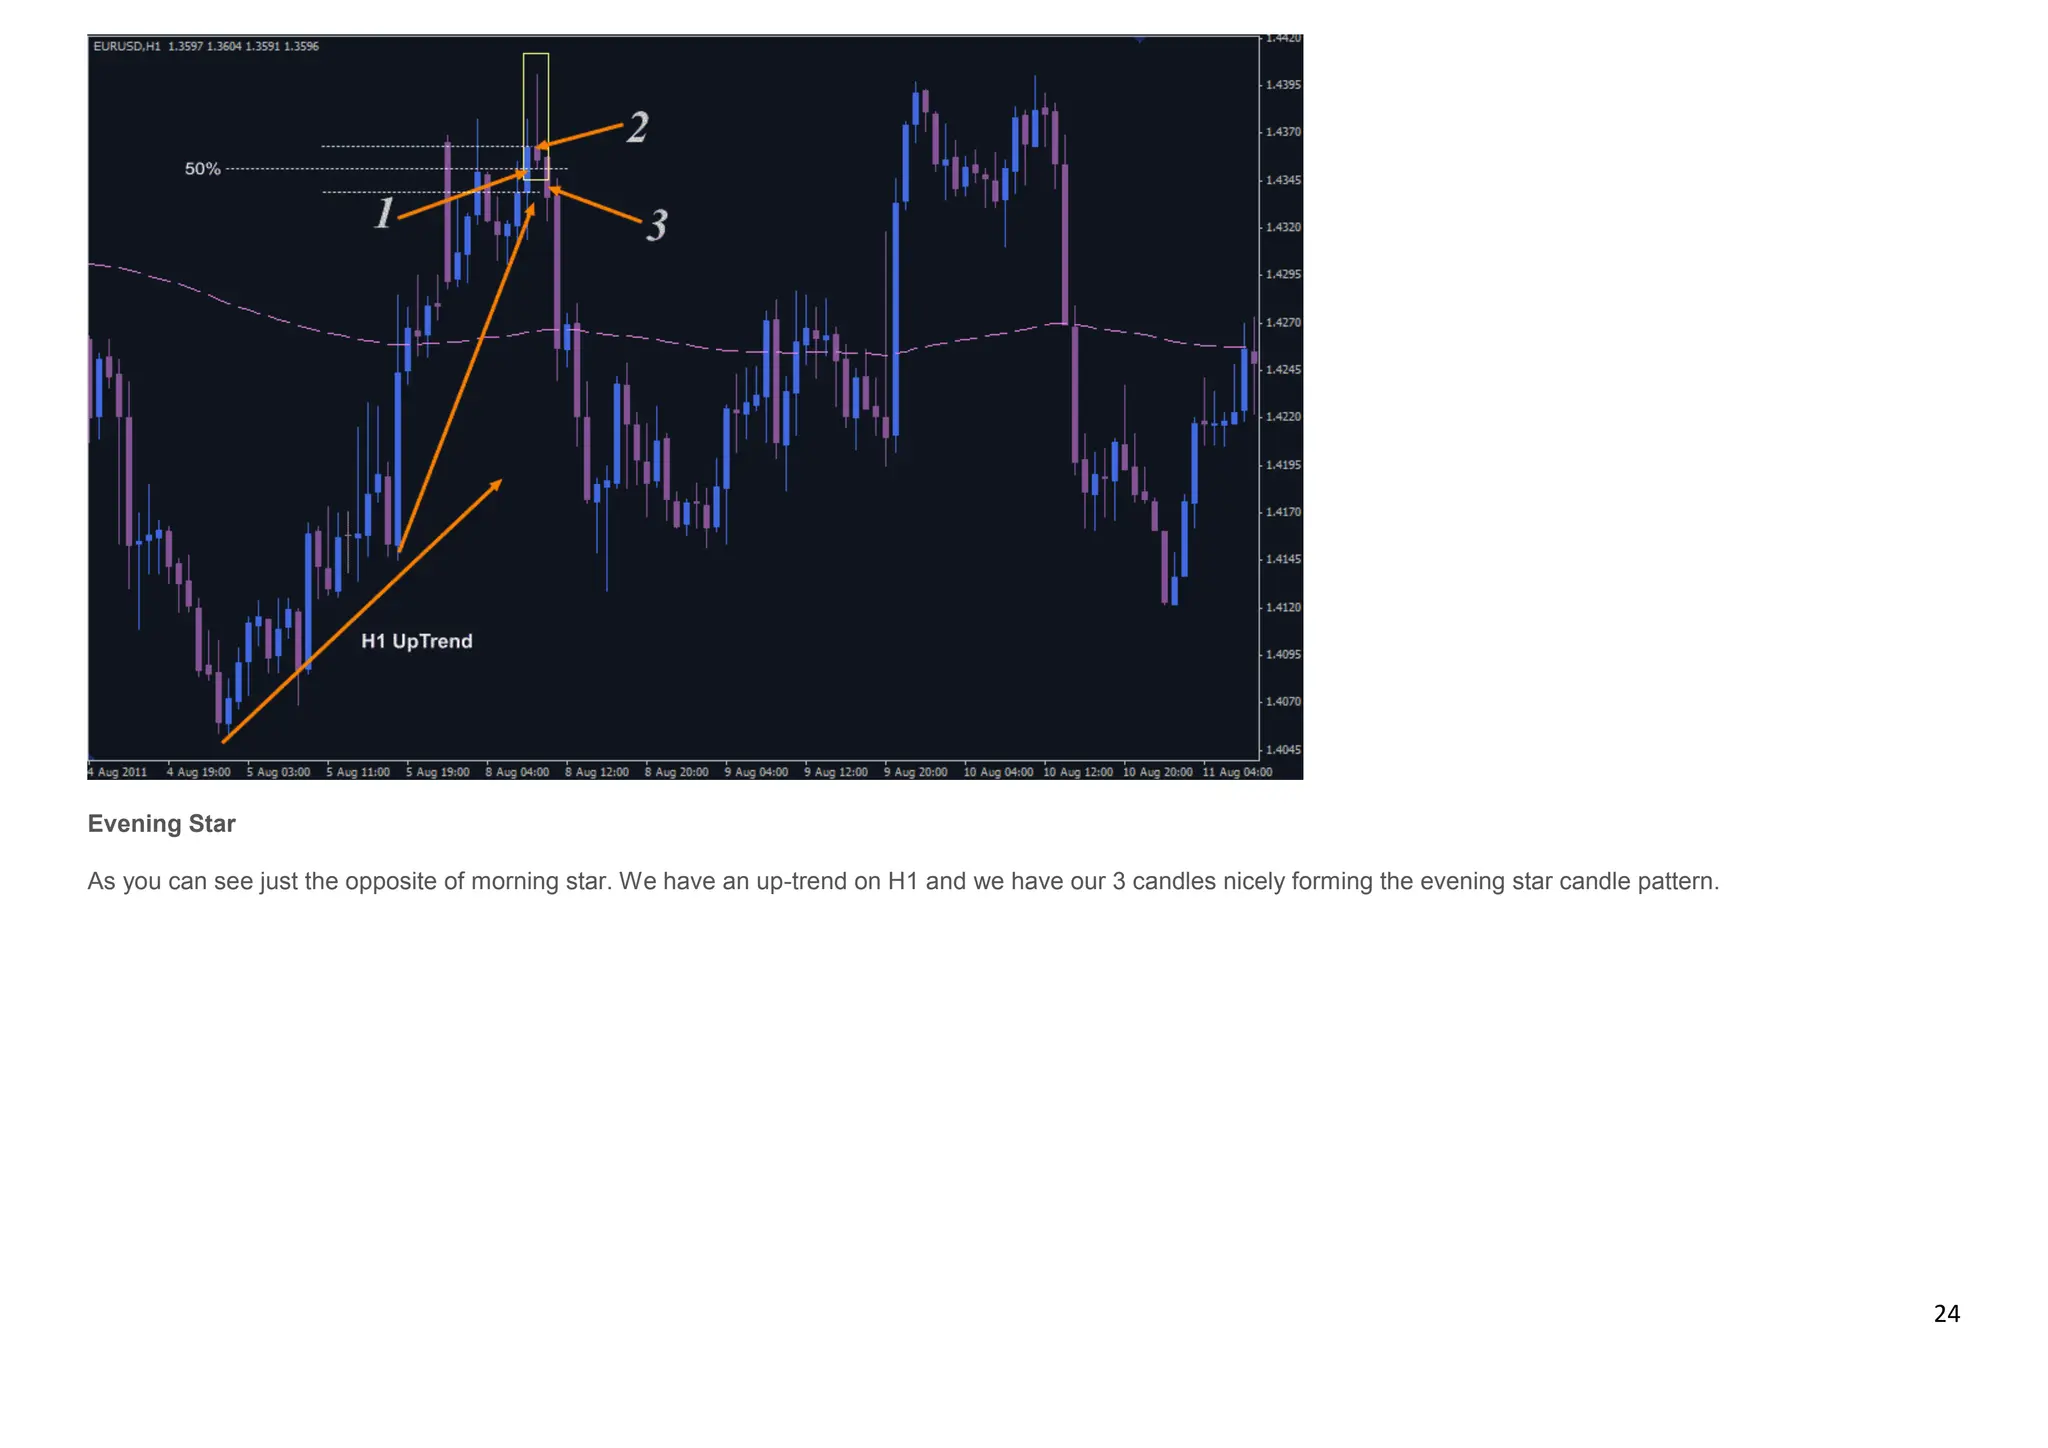
Evening Star
It's simply bearish version of the Morning Star candlestick pattern. We'd look for evening star candle pattern in an up-trend. Just reverse the logic and you'll have evening star.
Still made of 3 candles.
1. First bar is large bull candle within defined up-trend. Bulls are still in charge.
2. The second bar can be bit tricky. It may look like bull or bear hammer with long upper wick. It may also be a spinning top or doji candle. Main thing is here bears are
starting to talk.](https://image.slidesharecdn.com/basiccandlestickpatterngood-8-240323021609-8ef0aaba/75/Basic-Candlestick-Pattern-in-stock-market-finance-20-2048.jpg)
![21
3. The third bar is a largish bear candle. The third candle should close at least more than the halfway down the first candle [large bull candle] We need to wait until third
candle closes to see if it's a valid evening star or not.
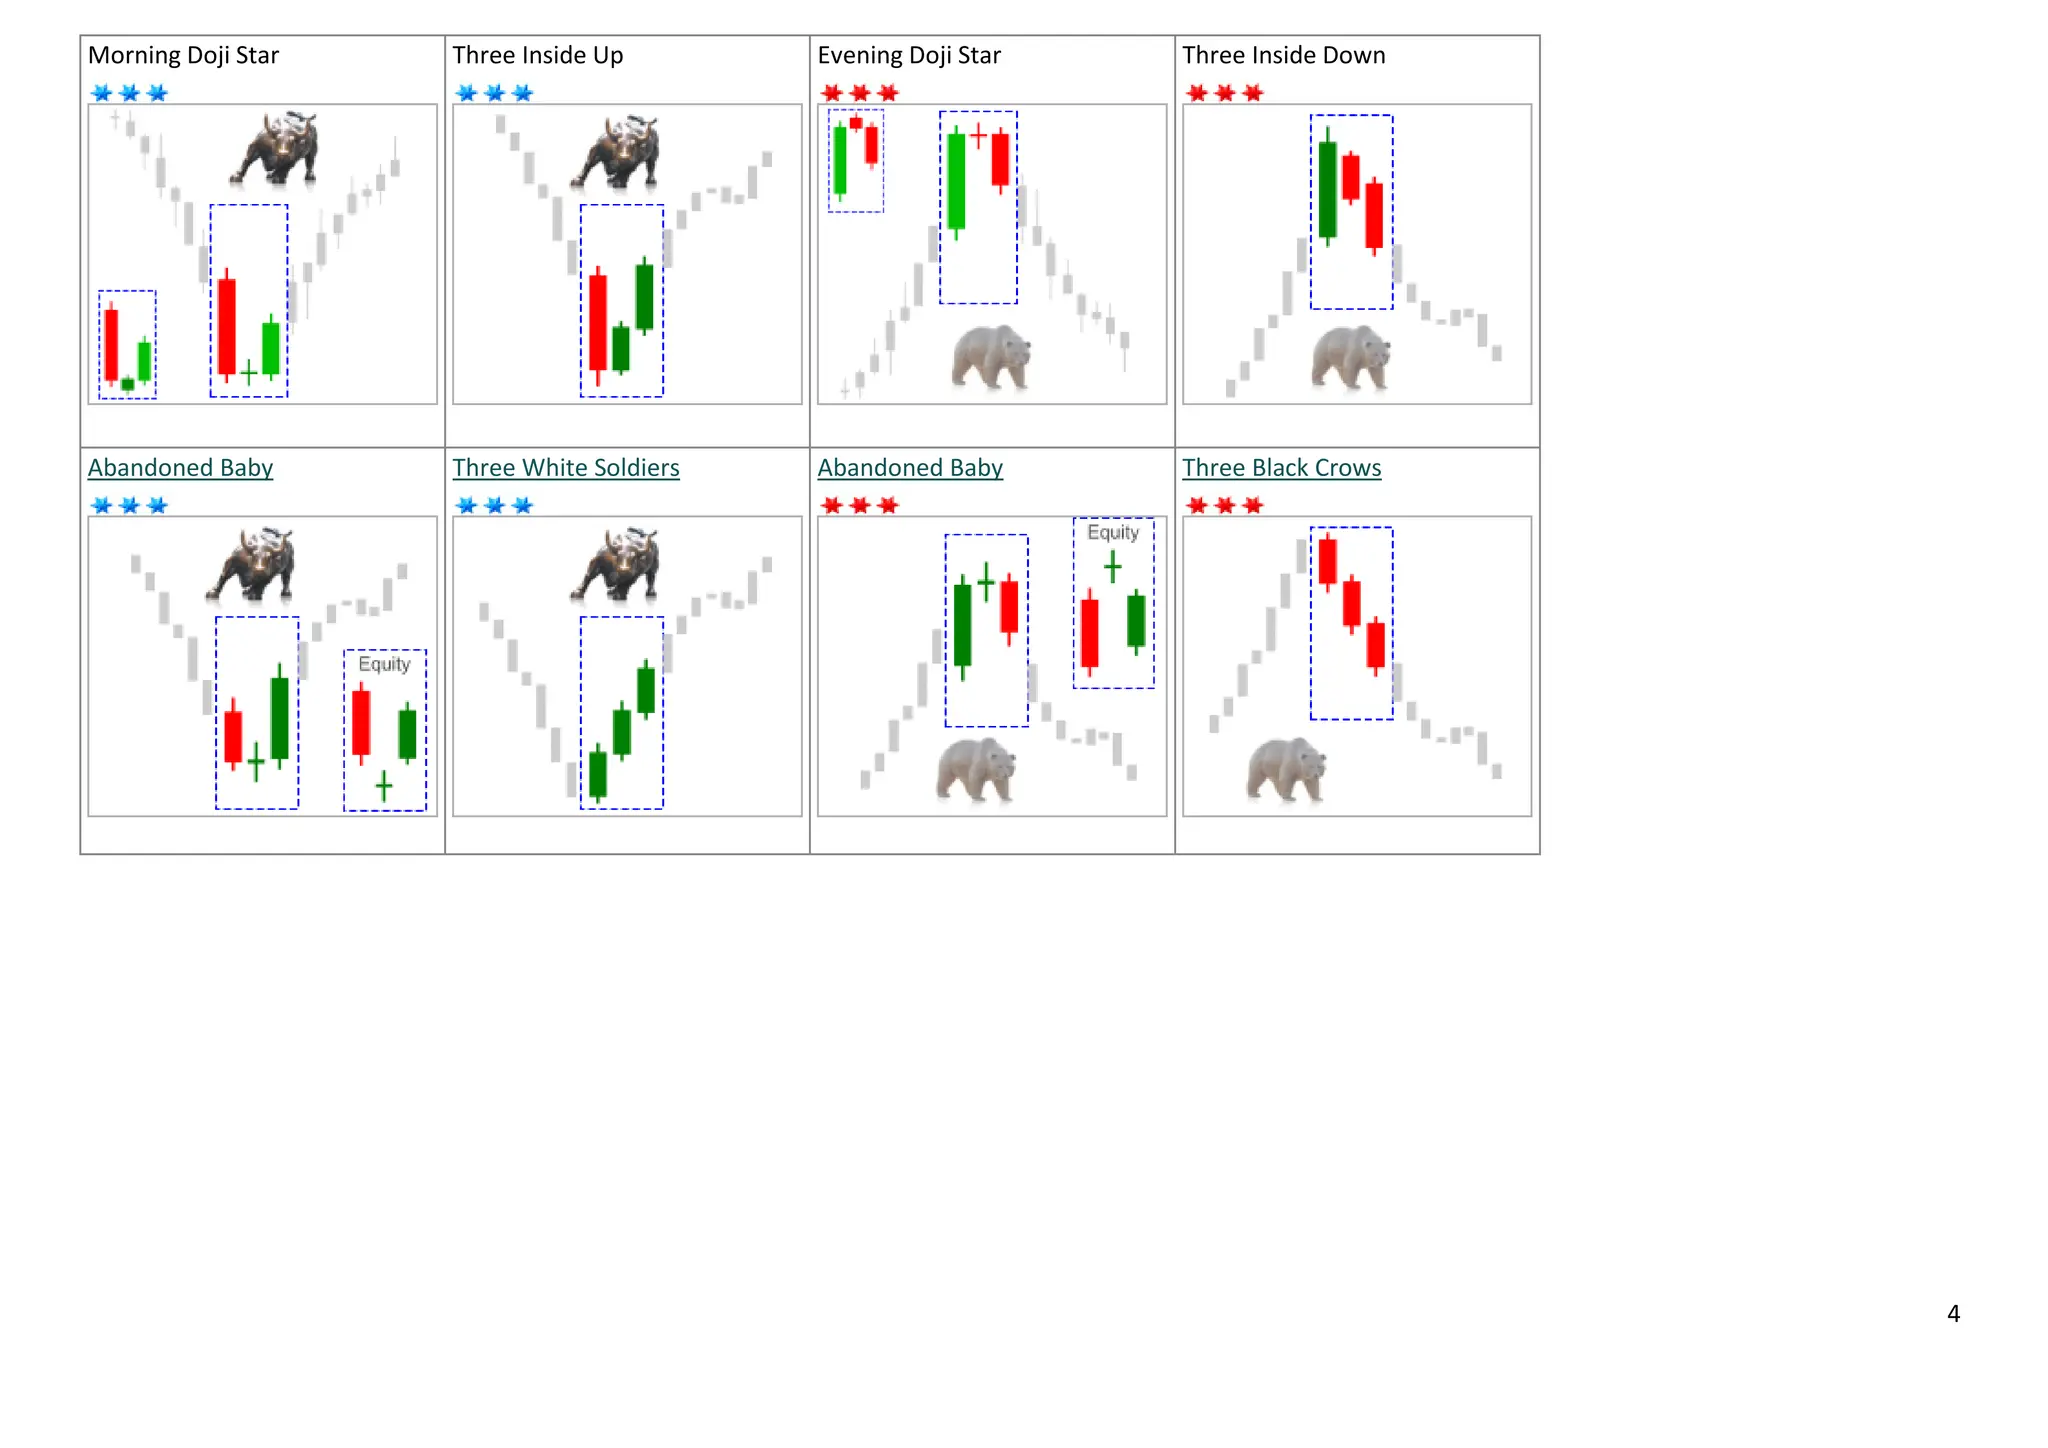
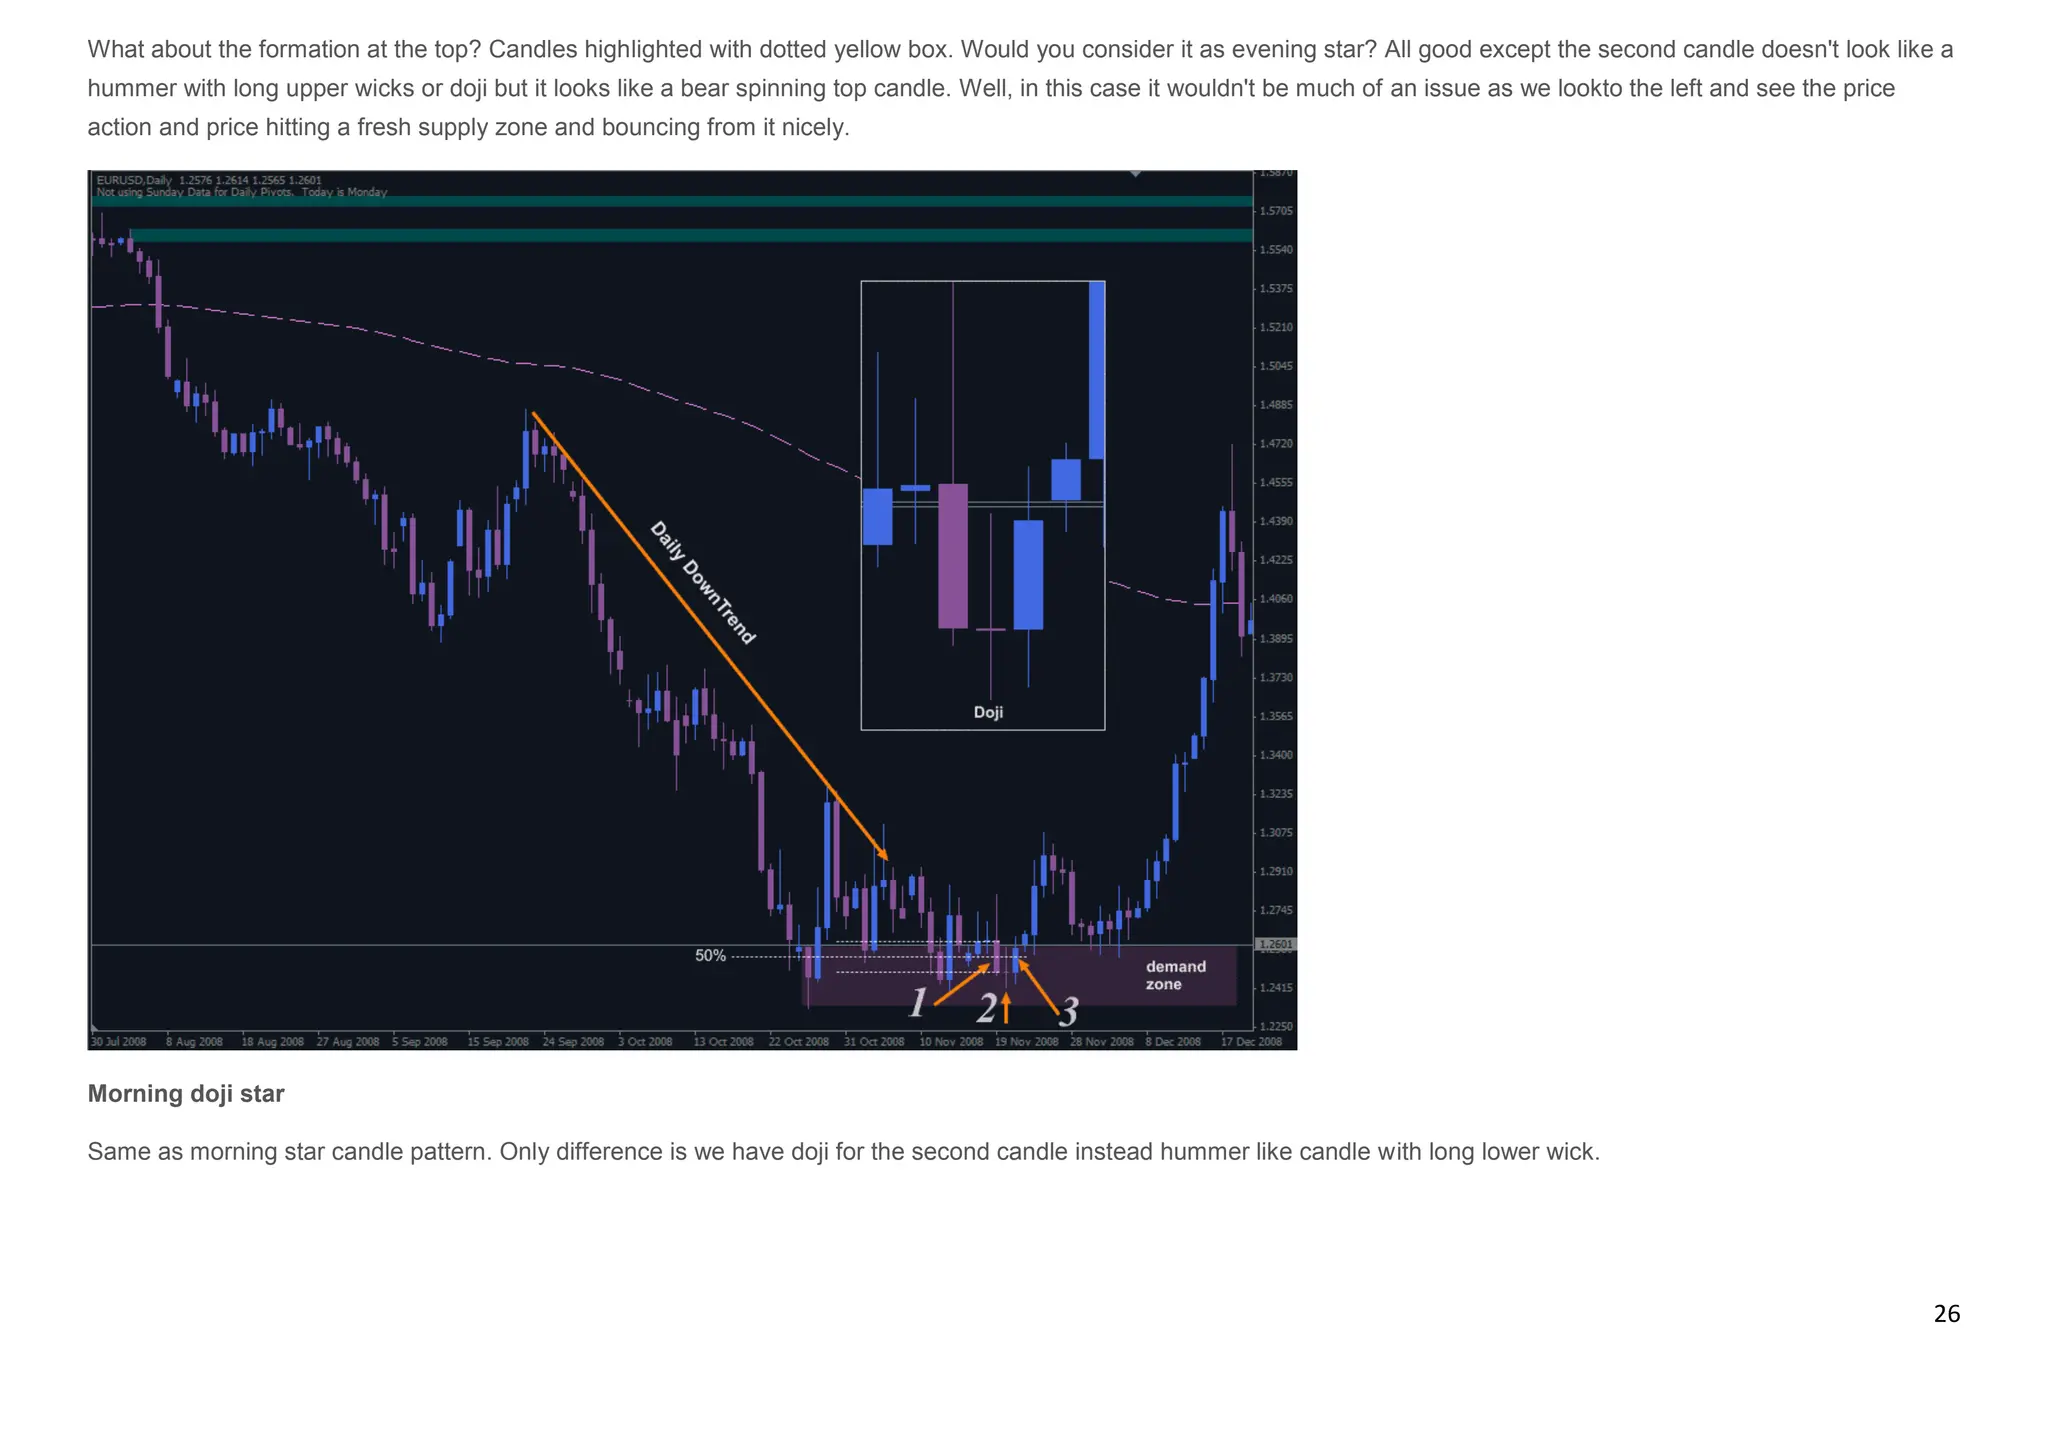
Morning Doji Star Candle Pattern
Same as above.. only difference is that second candle formed as doji rather than hammer like.
Evening Doji Star Candle Pattern
Same as above.. only difference is that second candle formed as doji rather than hammer like.
Some says morning and evening stars can have more than 3 candles as illustrated below. I'll try to stick with the basic definitions rather than complicating things.](https://image.slidesharecdn.com/basiccandlestickpatterngood-8-240323021609-8ef0aaba/75/Basic-Candlestick-Pattern-in-stock-market-finance-21-2048.jpg)
![23
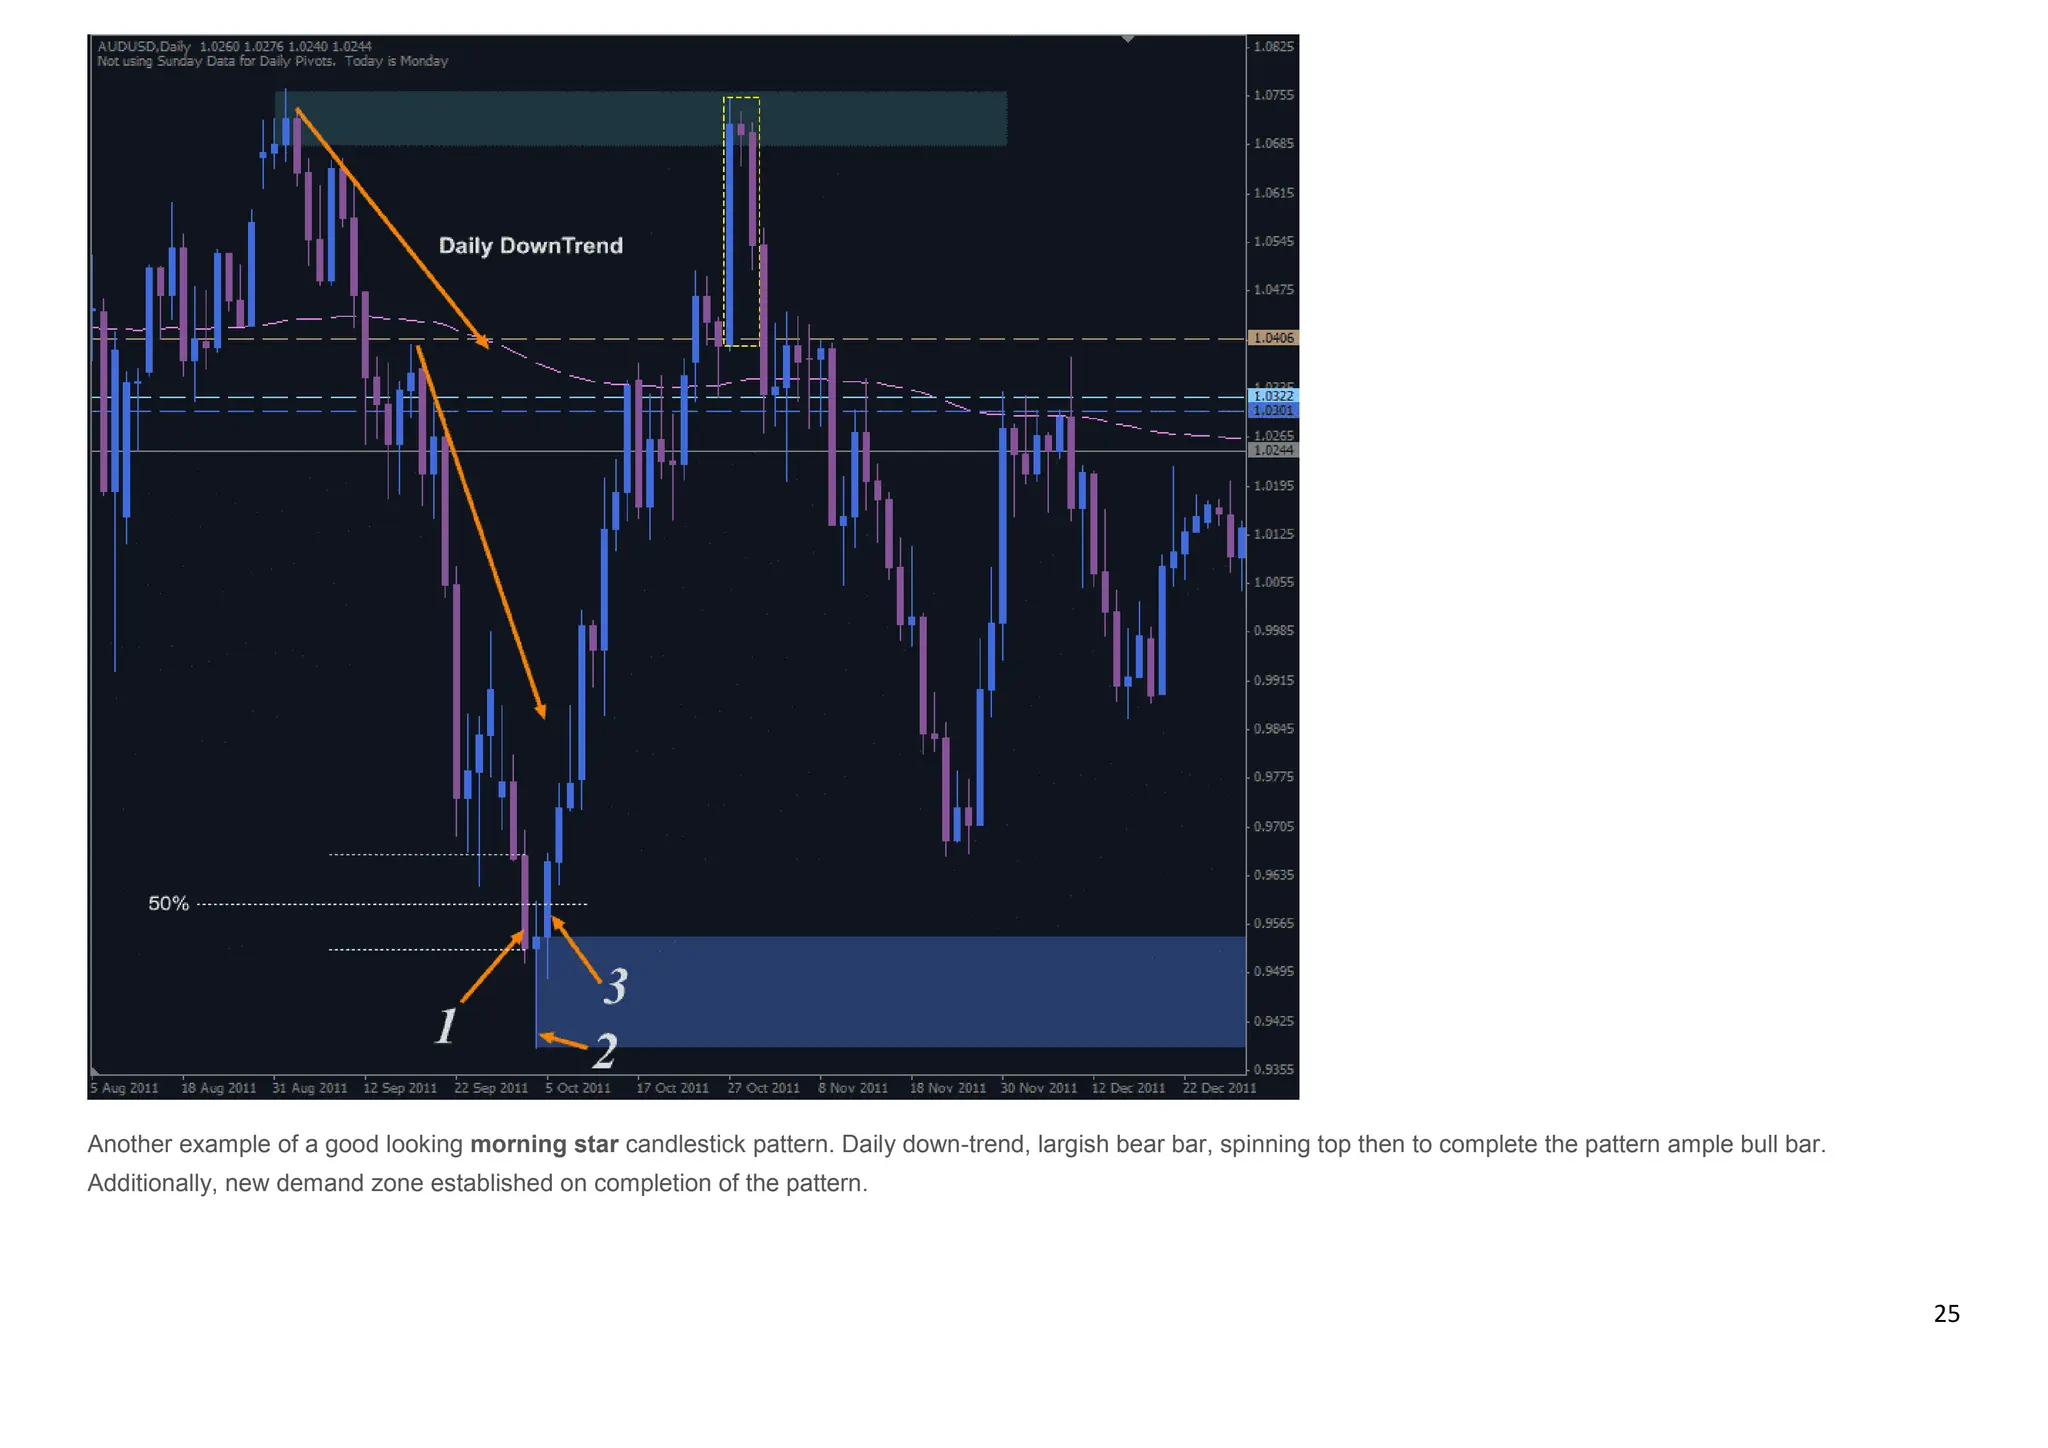
Morning Star
A very nice looking morning star. If the third bar wasn't quite large it'd would have been even more nicer. We are in daily down-trend. We have our large bear candle [1], then
hammer look a like bar with a long lower wick [2], and finally [3] we have our bull candle which is more than half of first candle [bear] body, we have our pattern completion
bull candle.
When we see such large bars [candle number 3 in this case], sometimes it pays much better if we wait and enter on retracement. More often than not after large bars we
usually see some retracement. Most likely there will be some quick profit taking and re-loading take place. However, in news and unexpected events times the above will not
apply as described. In such times price can move very fast 100+ pips in one direction without any retracement.. Extreme greed or panic would be the story of the day.](https://image.slidesharecdn.com/basiccandlestickpatterngood-8-240323021609-8ef0aaba/75/Basic-Candlestick-Pattern-in-stock-market-finance-23-2048.jpg)
![32
Bullish and Bearish Abandoned Baby Candle Pattern
Lets start with engulfing pattern which is considered to be most strong of all in the right place.
Who'd want to abandon their baby? I don't think many people does it. Similar situation applies to markets when it comes to Abandoned Baby candlestick pattern. It's
appearance is pretty rare on trading charts but once it appears in a correct place [zone] it's considered to be quite a reliable indicator of the trend reversal.
Most of the online sites describes Abandoned Baby that appears on equity market charts. Let's make it clear again, Abandoned Baby candle pattern like many others is
different to ones we may see on Forex charts. The key difference is the gap required for equity markets Abandoned Baby candle pattern while it's not the case for the 24
hours traded Forex markets, unless, somehow it appears with a gap on market opening after the weekend break.
Remembering that Abandoned Baby Candle Pattern is a trend reversal one, bullish Abandoned Baby Candle Pattern appears at the bottom while bearish Abandoned Baby
Candle Pattern appearing at the bottom.
Of course we don't know when that top or bottom may be establishing. In general terms in Financial markets there is no such a thing as bottoms and tops. We can only define
them once established on any given time frame charts not as a whole market for any instrument. Just like trends, unless you specify time a time frame asking such question
as "What's the EUR/USD trend?" would be meaningless.](https://image.slidesharecdn.com/basiccandlestickpatterngood-8-240323021609-8ef0aaba/75/Basic-Candlestick-Pattern-in-stock-market-finance-32-2048.jpg)
![33
As always we look and see if the Abandoned Baby Candle Pattern appears in and around any significant supply and demand zones.
The above illustrations give pretty clear idea about what Abandoned Baby Candle Pattern may be looking like on our trading charts.
Bullish Abandoned Baby Candle Pattern
Appears on a down-trend when price reaches significant lows. We wouldn't be looking for this pattern on an up-trend.
First bar of the pattern is as continuation of the current trend which would be a bear bar/candle. It's noticeably a largish bear candle with a smaller wicks compare to it's body.
Second candle forms as a doji where opening and closing prices of the candle almost the same. We see buyers start to show their hand but it's inconclusive at this point as
they are not able to take control at this point. It may be bear or bull doji.
Third candle is a strong bull candle with smallish wicks compare to it's body, where we can see buyers gaining the control. Third candle needs to penetrate well into first [bear]
candle and in some cases above.
Bearish Abandoned Baby Candle Pattern
Opposite the bullish version. Just reverse the logic and you'll have the description of Bearish Abandoned Baby Candle Pattern.
You'll also notice that Forex Abandoned Baby Candle Pattern is almost identical to Morning/Evening Doji Star Candle Pattern [See here]. There are not much to separate
these two candle patterns. Therefore it's more of an insufficient equity markets candle pattern with it's full implied meaning - abandoned [gap is the cause of abandonment]](https://image.slidesharecdn.com/basiccandlestickpatterngood-8-240323021609-8ef0aaba/75/Basic-Candlestick-Pattern-in-stock-market-finance-33-2048.jpg)
![34
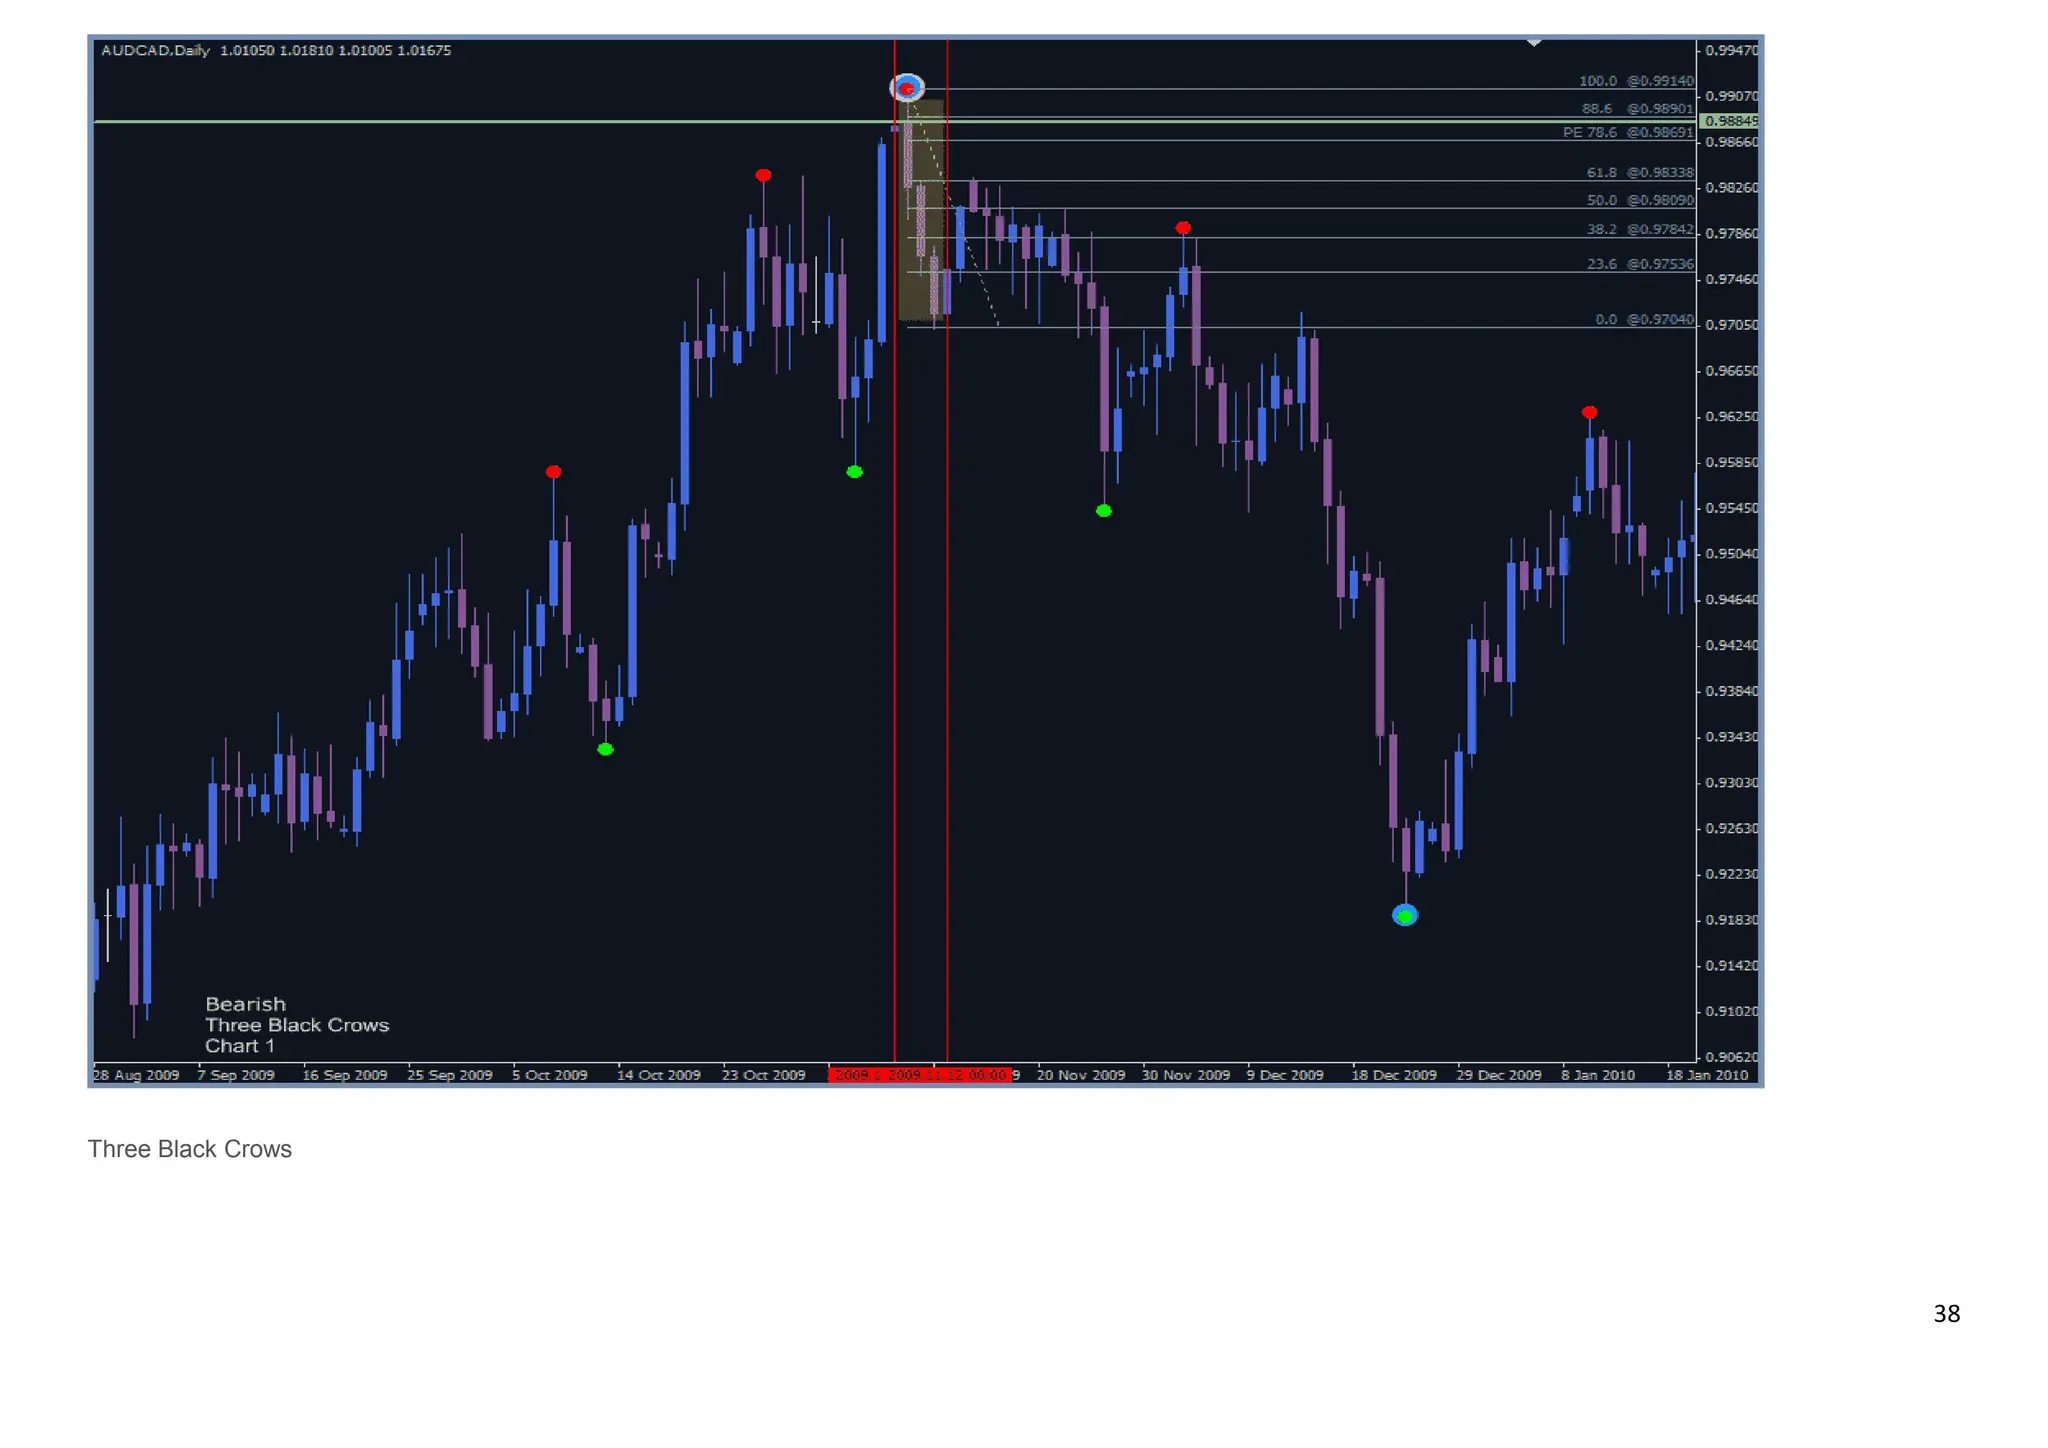
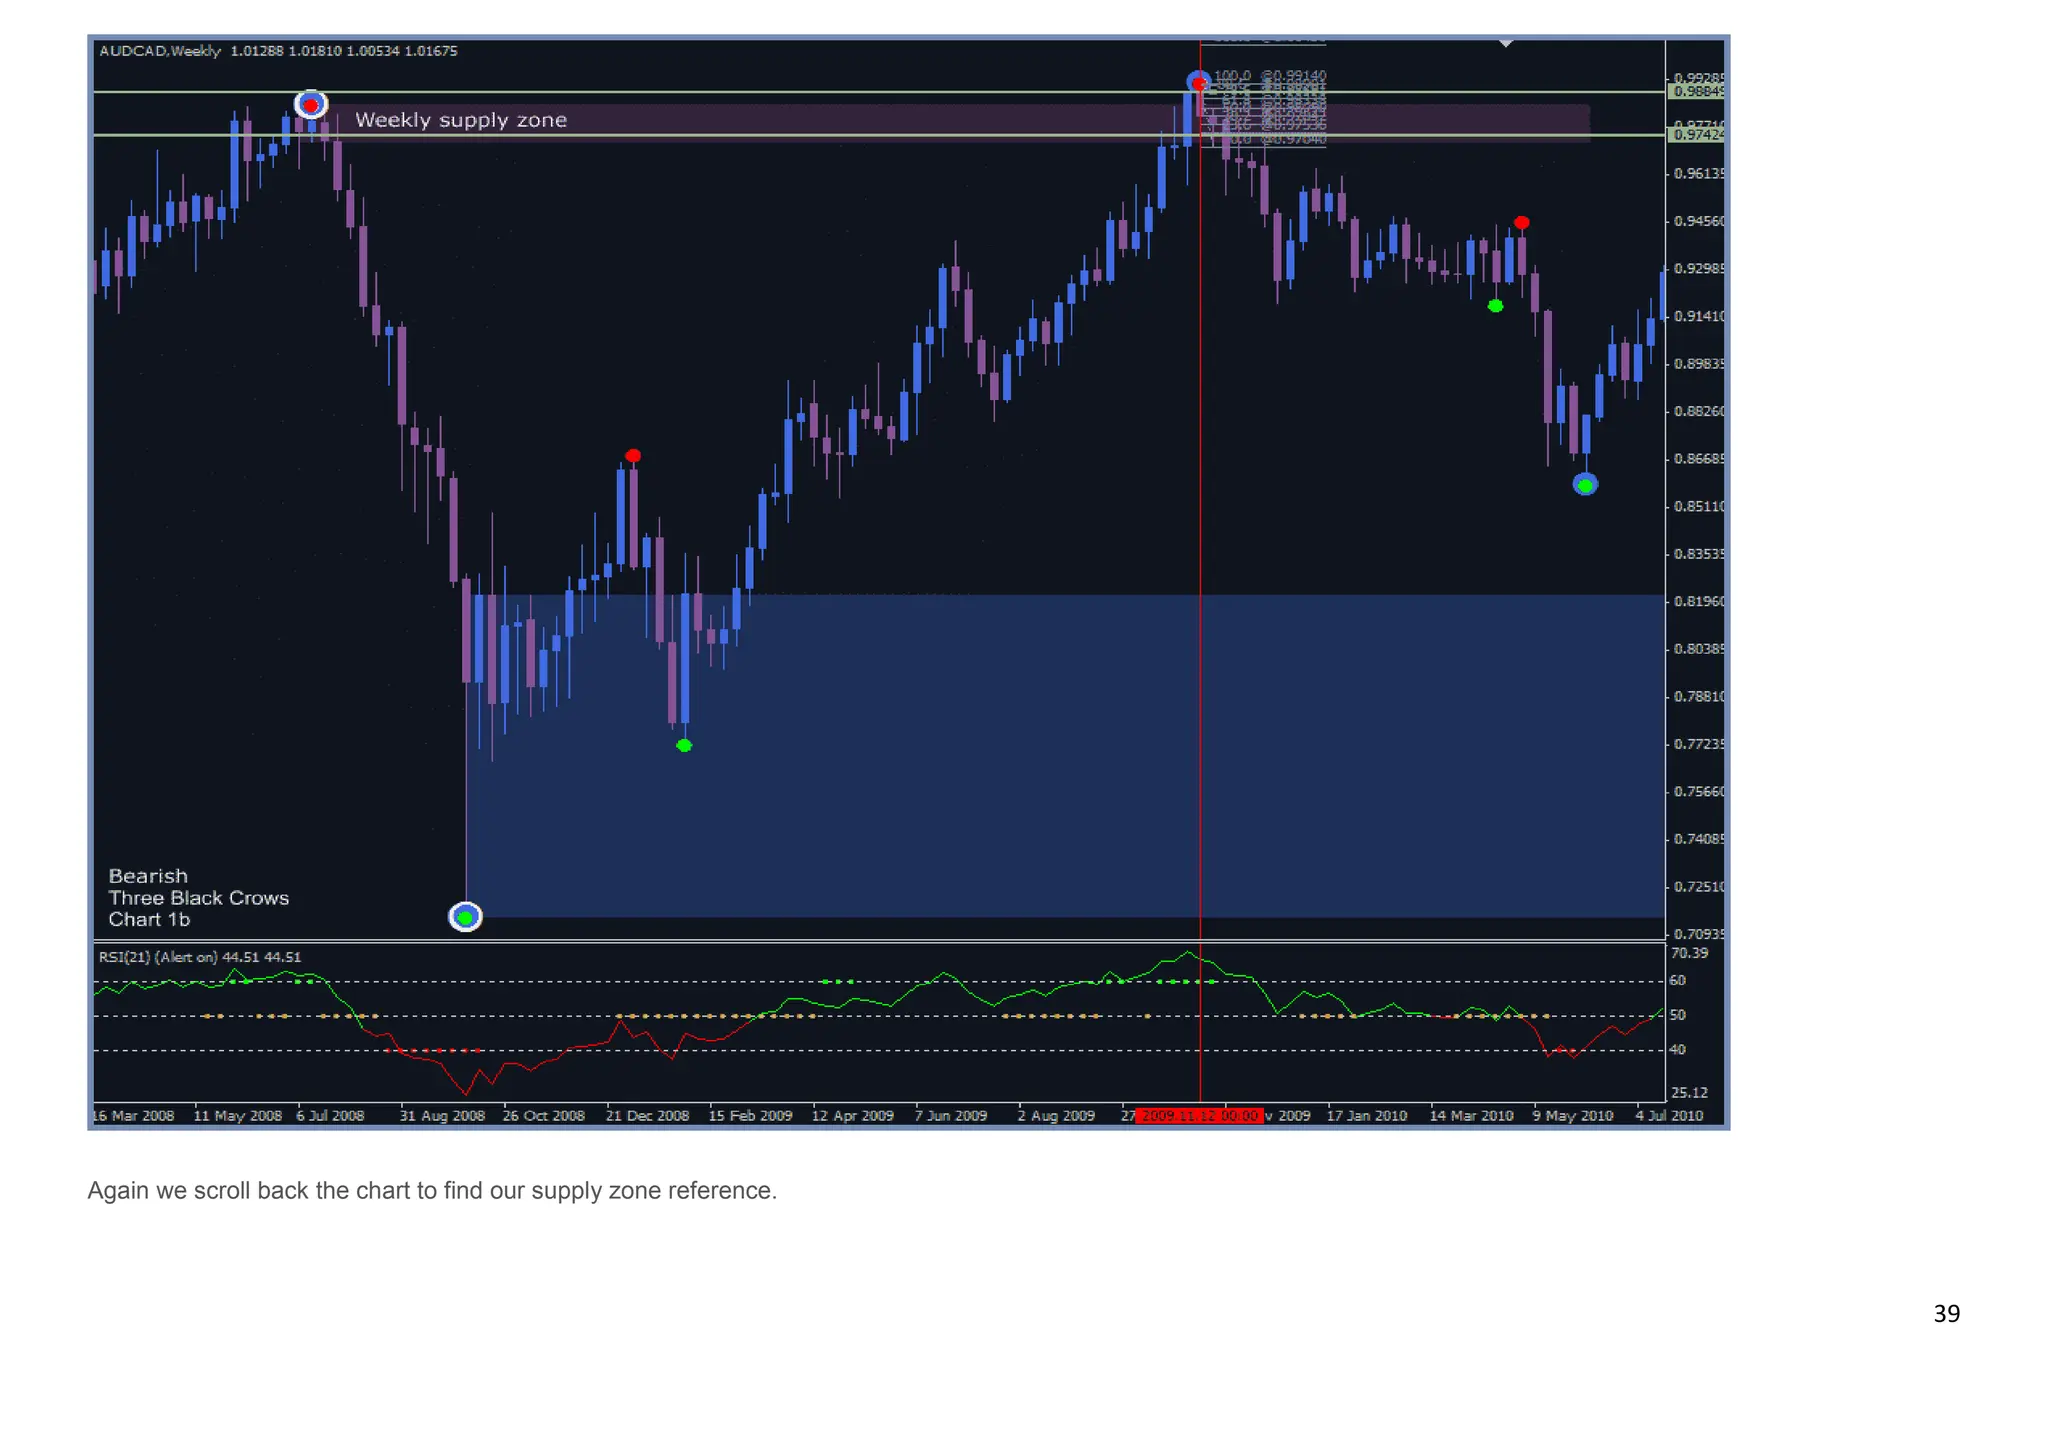
Bullish - Three White Soldiers Candle Pattern & Bearish - Three Black Crows Candle Pattern
We have another couple of candle patterns with an interesting names. While the bullish version of the same pattern named as a white soldiers, the opposite of version called
not 3 black soldiers but 3 Black Crows. I guess they tried to avoid any possible tone of racism. Well, if I was naming them I'd have used for bullish version 3 Brave Soldiers
and bearish version 3 Rebel Soldiers if were to stick on with soldiers theme. Perhaps more simpler approach would have been better by just naming them 3 Up Pattern and 3
Down Pattern.
They say the reason they called as white soldiers and black crows is that in those old days they were drawn as white and black candles. Additionally in early days of
computing they didn't have color monitors, just black and white.
Have look above Three White Soldiers Candle Pattern and Three Black Crows Candle Pattern illustrations. What do you see?
It clearly shows that price reached in certain bargain levels that buyers [Three White Soldiers] or sellers [Three Black Crows] get ecstatic and jump in the market with a force.
Keeping in mind these are trend reversal patterns. We'd be looking for Three White Soldiers Candlestick Pattern on a down-trend and for Three Black Crows Candle Pattern
on a up-trend. Once again within the context of major supply and demand zones.
Both patterns are made of 3 bull or bear candles. Each new candle is making new highs in respect of the previous candle.](https://image.slidesharecdn.com/basiccandlestickpatterngood-8-240323021609-8ef0aaba/75/Basic-Candlestick-Pattern-in-stock-market-finance-34-2048.jpg)
![41
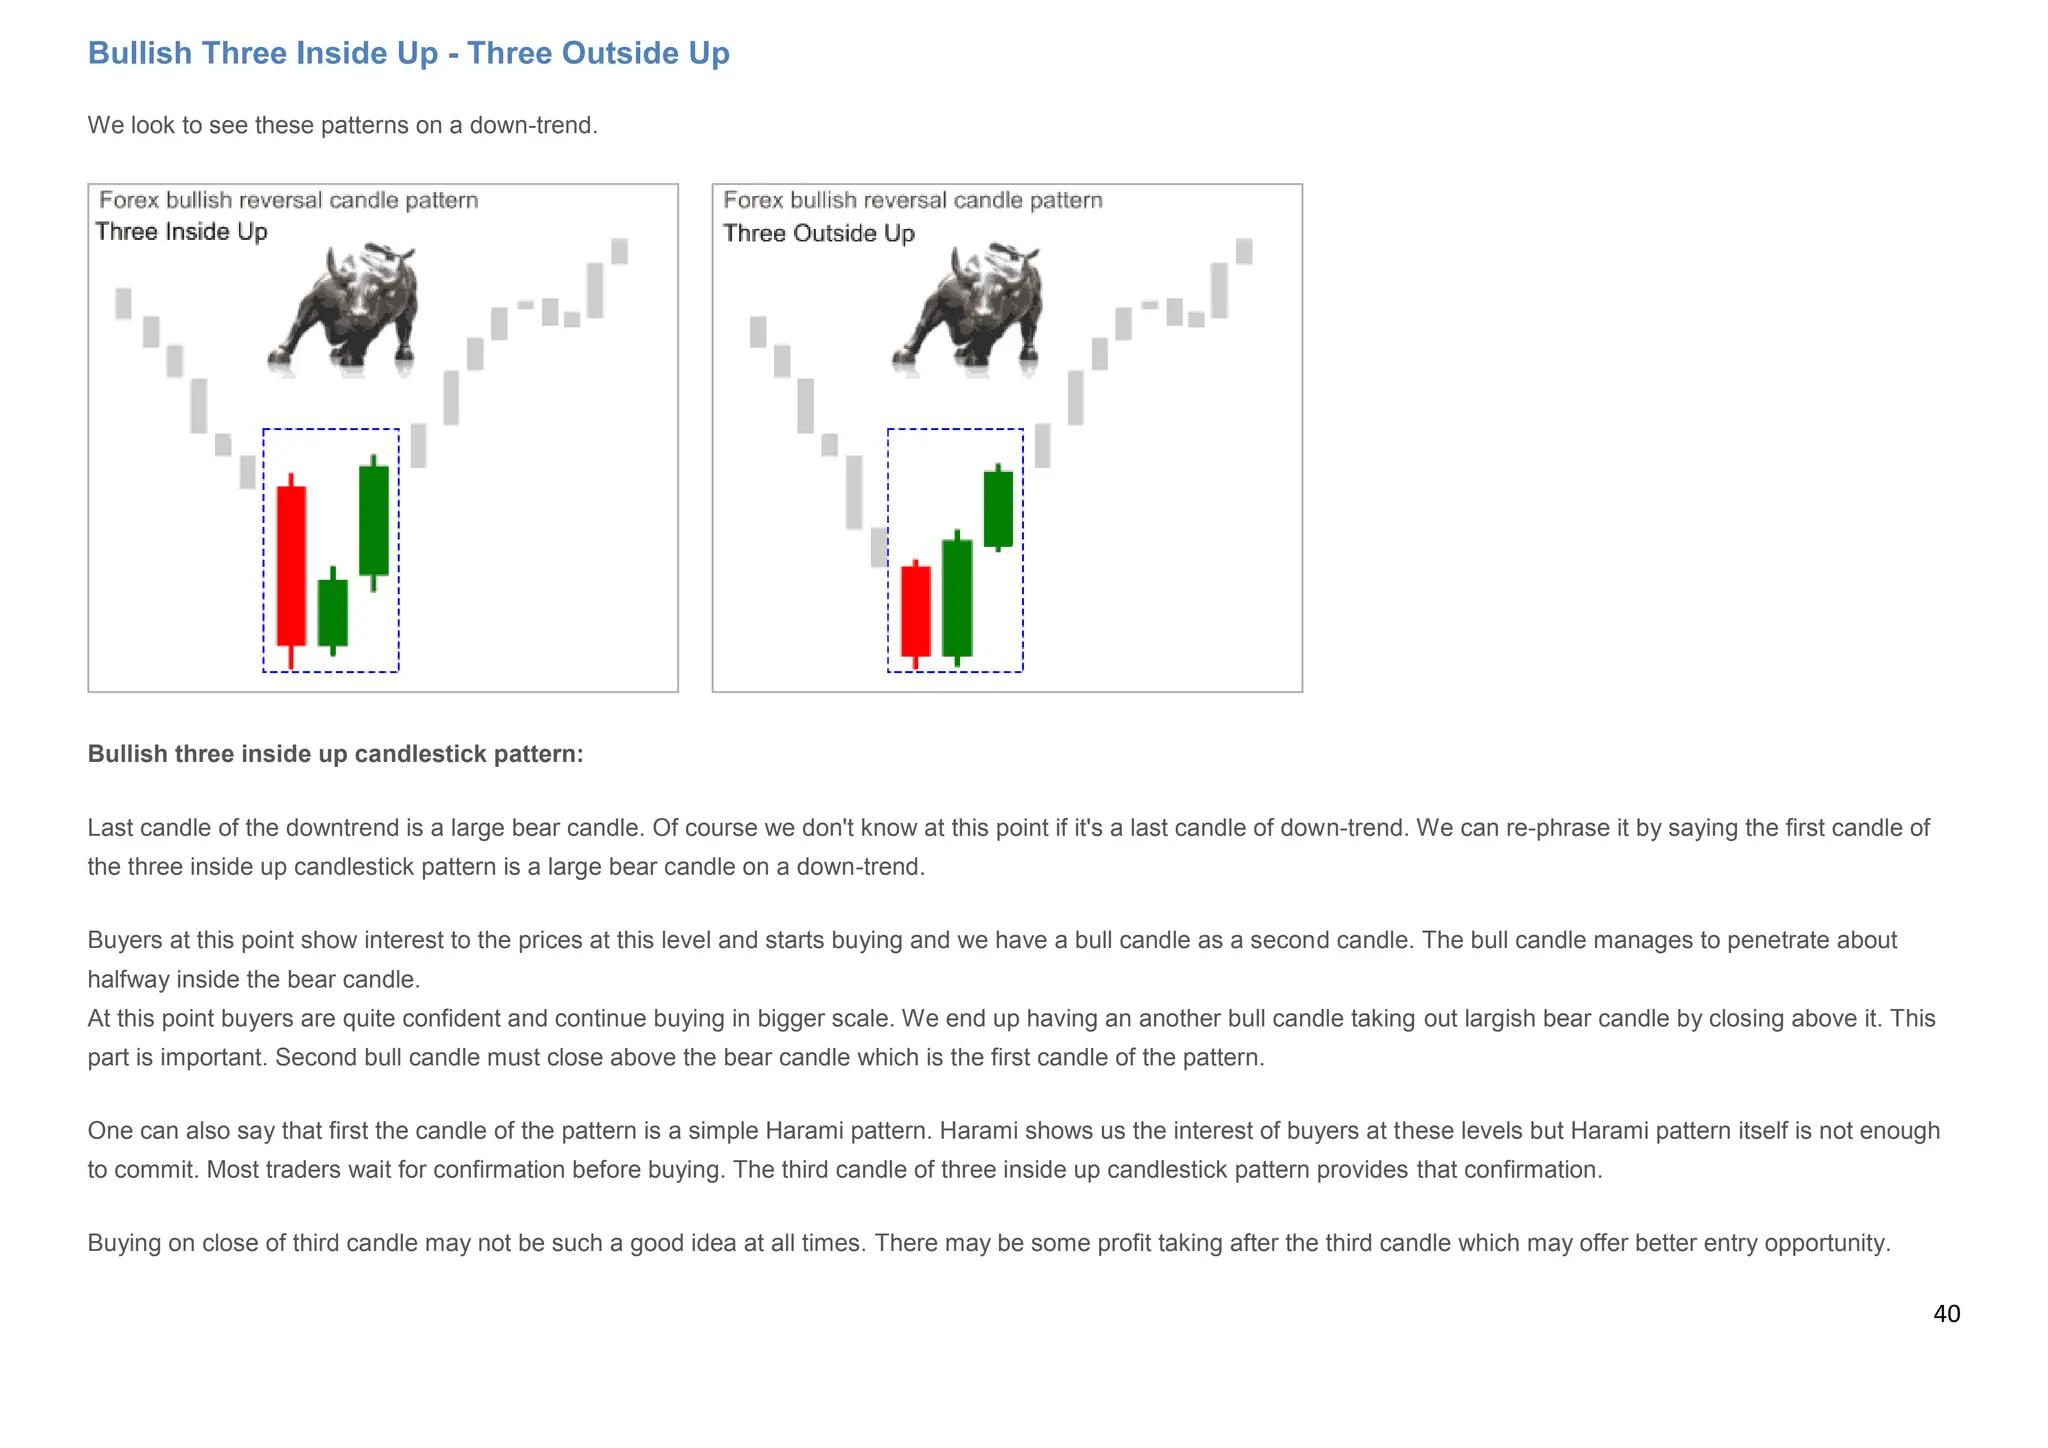
Bullish three outside up candlestick pattern:
The first candle of the three outside up candlestick pattern is a largish bear candle on a down-trend.
Buyers at this point show interest to the prices at this level and starts buying and we have a bull candle as a second candle. Like in three inside up pattern, the second candle
closes as a bull candle but unlike it closes well above the first candle [bear] of the pattern.
At this point buyers are quite confident and continue buying in bigger scale. The third candle again is a bull candle and closing well over the previous candle close.
When we see three outside up candlestick pattern, it may be one of the better opportunity to buy. As you can see, first two candles themselves already created a nice two
candle pattern we know as a engulfing; in the case of the above illustration bull engulfing candle pattern.](https://image.slidesharecdn.com/basiccandlestickpatterngood-8-240323021609-8ef0aaba/75/Basic-Candlestick-Pattern-in-stock-market-finance-41-2048.jpg)
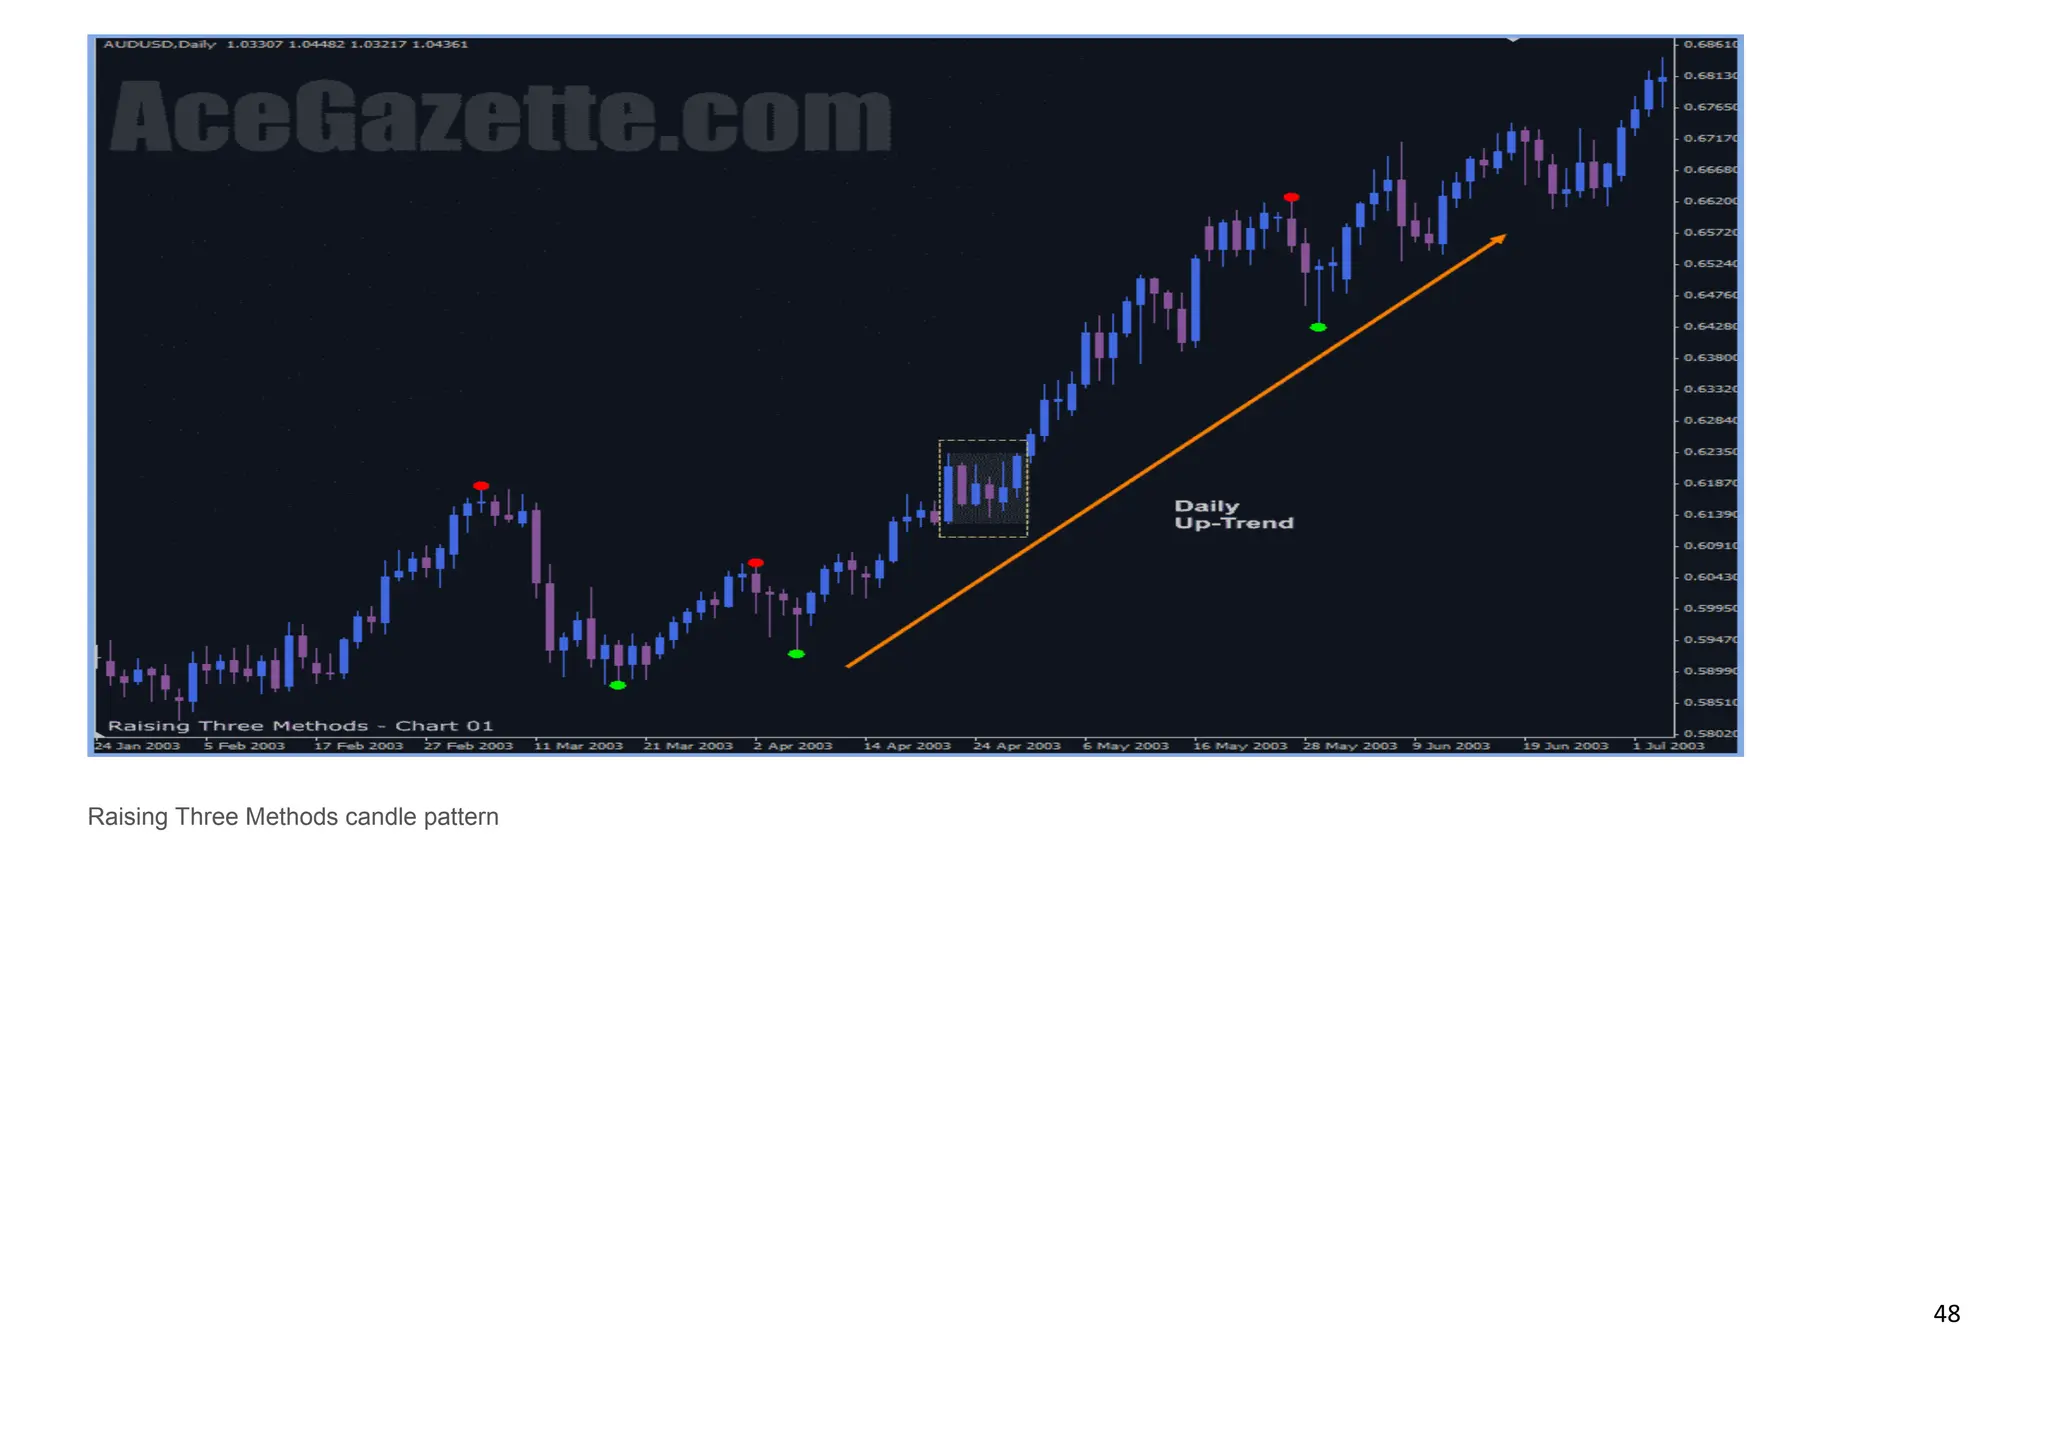
![47
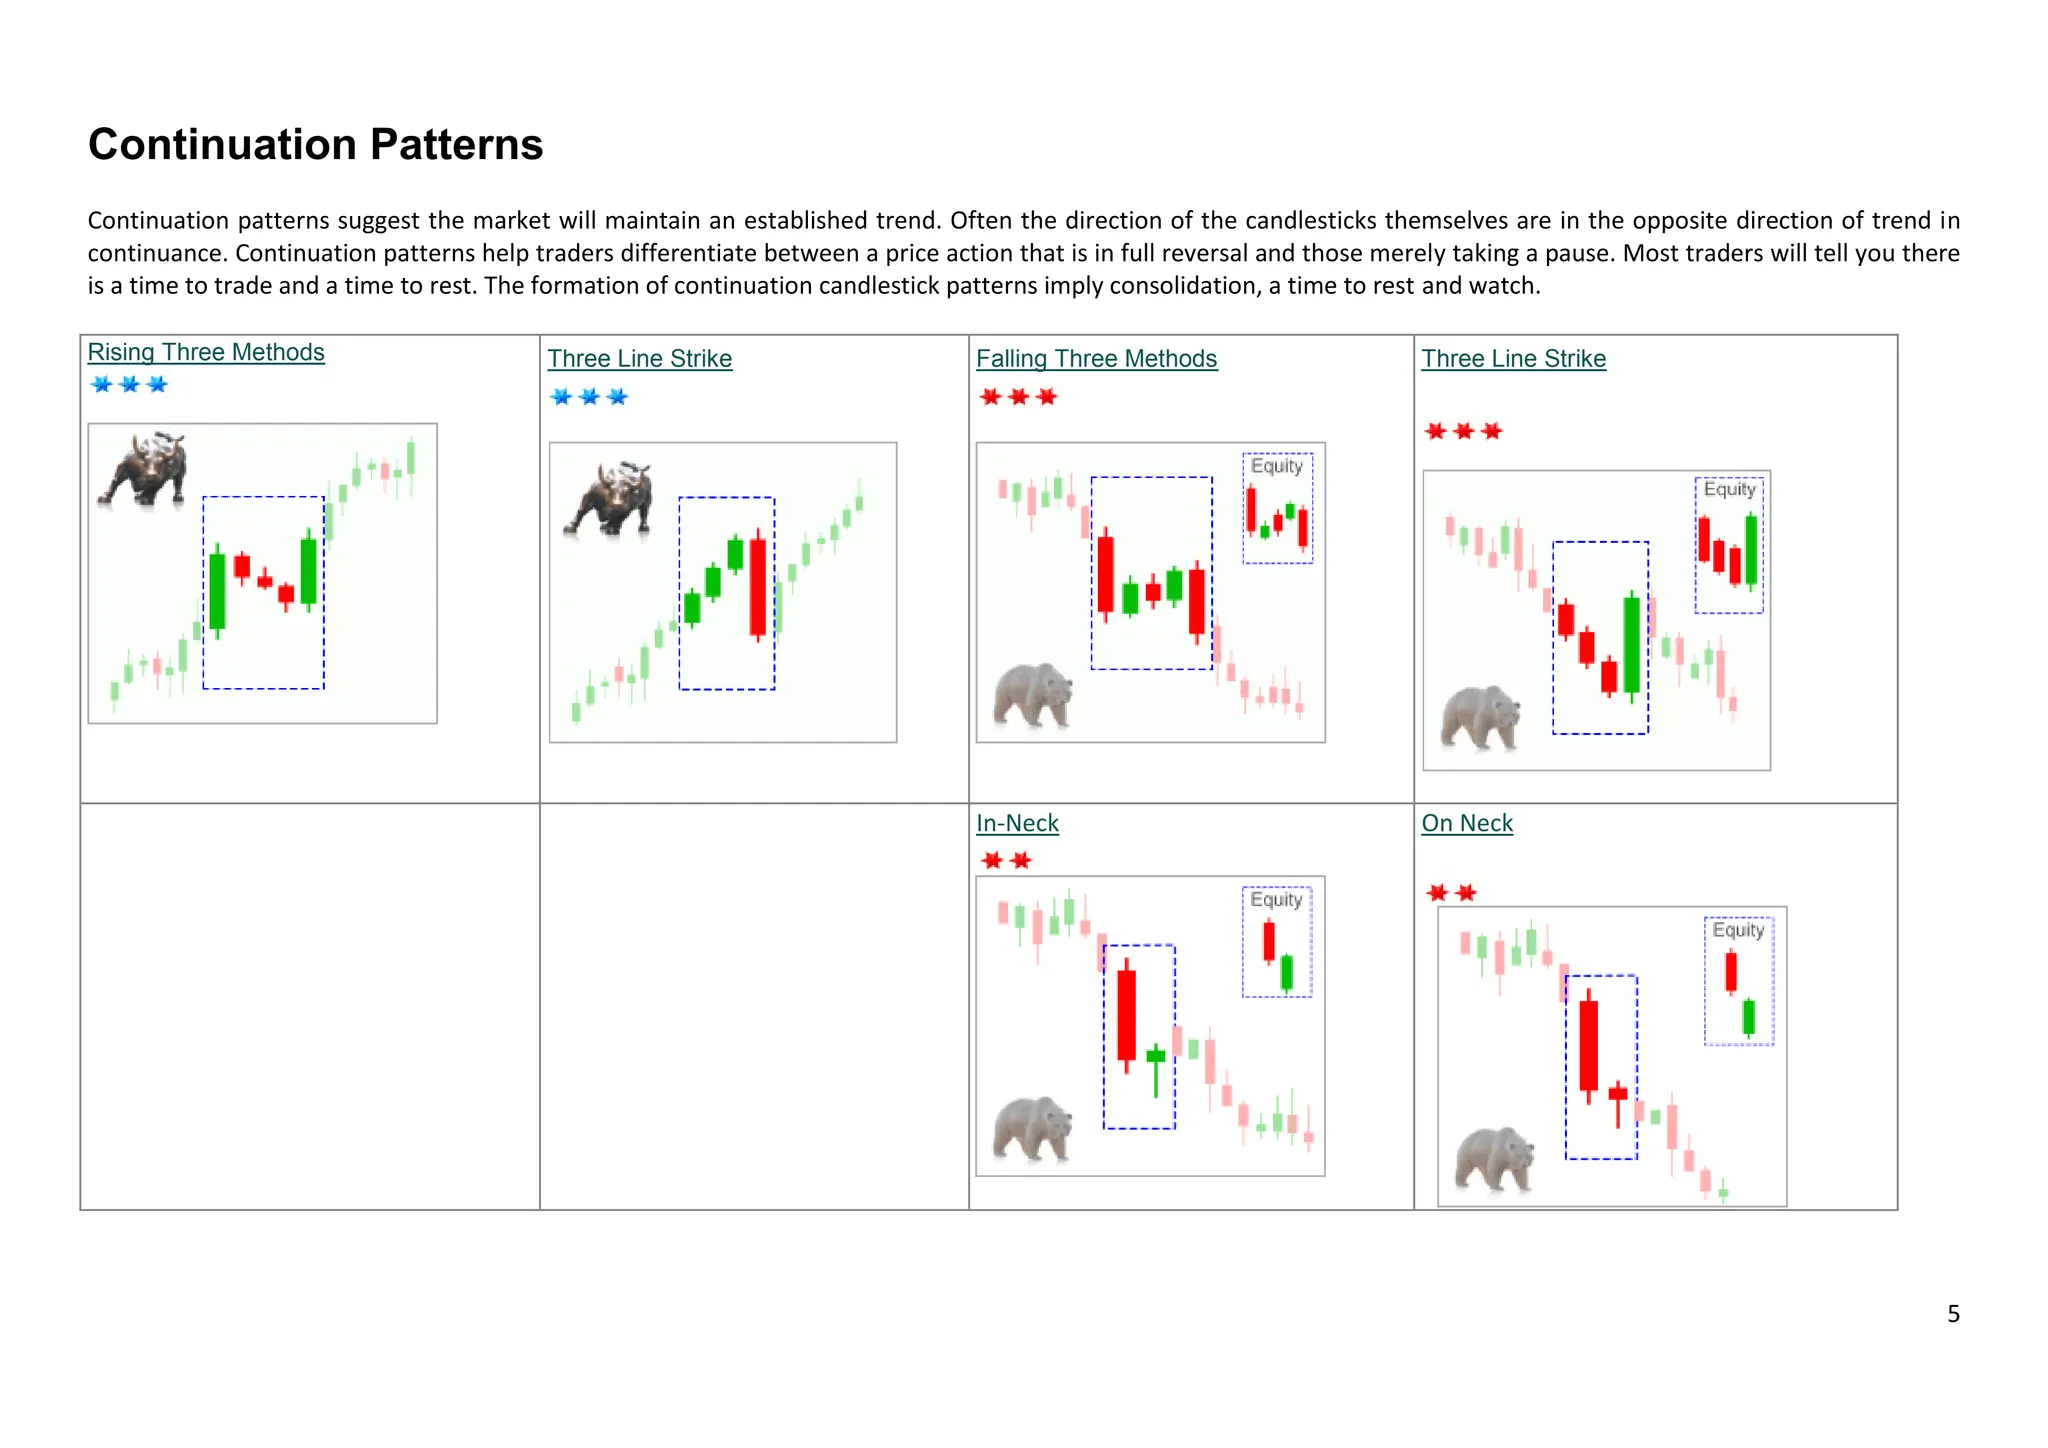
One may have bit of different outlook. It's nothing to do with sellers power or market resting etc. After such a long bear candle we have new high on price. Some profit taking
and re-loading may be in order at this point as the trend has already been decided. Conveniently, just before the last bull candle there usually are some financial news, report
or speech.
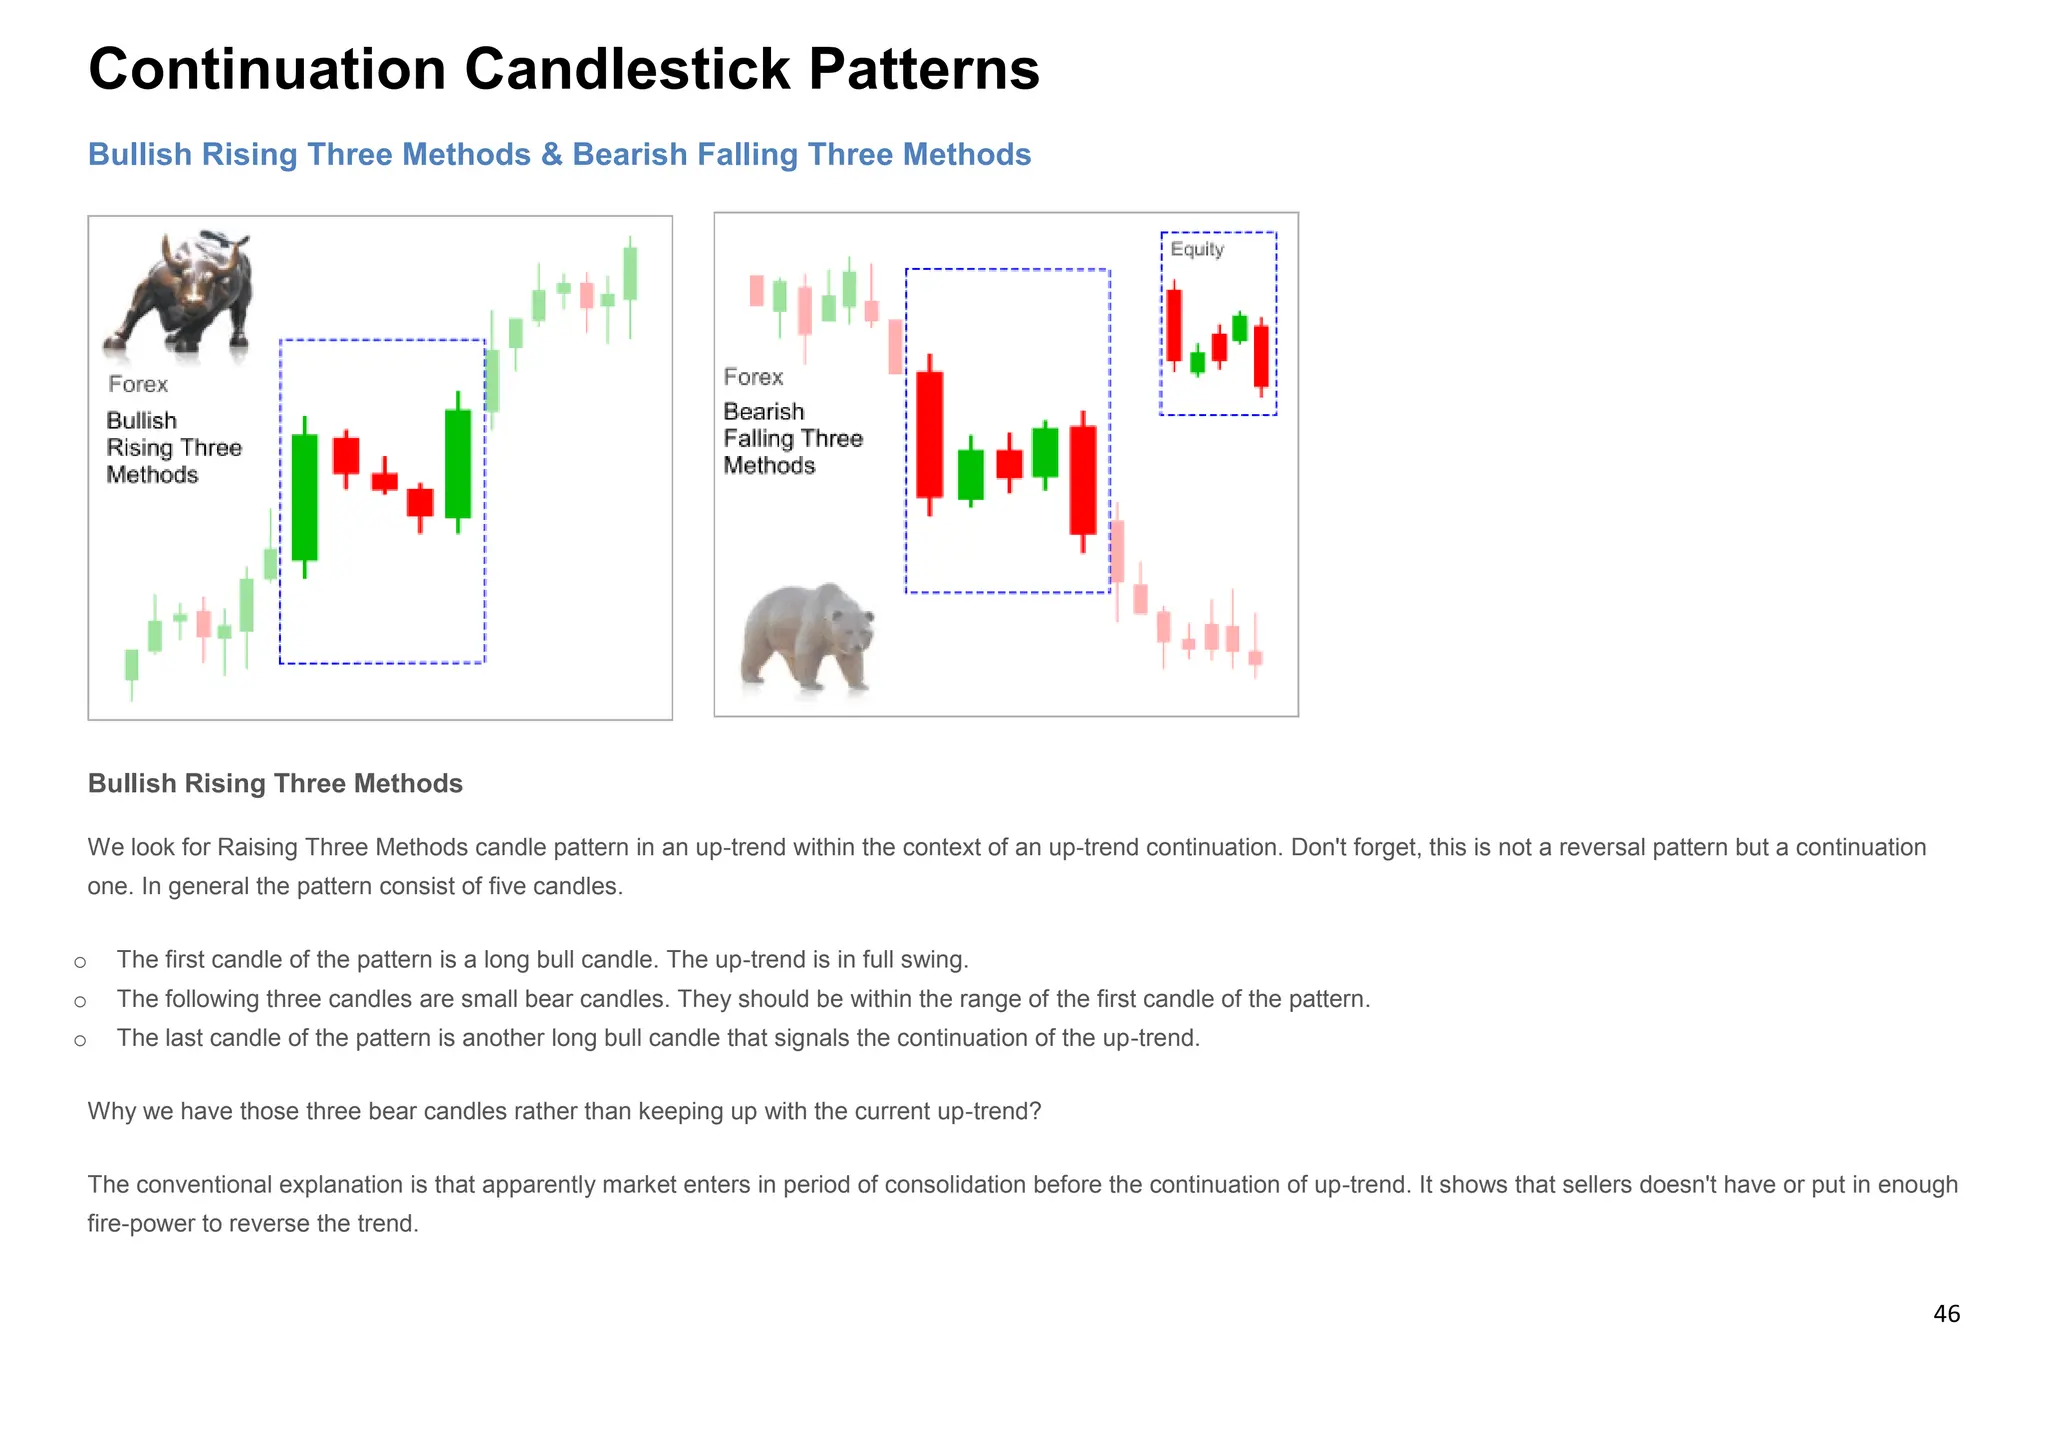
Couple of things to keep in mind with Three Methods pattern:
o In an ideal formation there are three middle bear candles, but in reality pattern may have more than three middle candle or even less than three. There could be only two
middle candles.
o Each middle candle can be in different shapes, types and sizes, such as Doji, Star, bear or bull.
o Middle candles may have wicks in various sizes but important thing to remember each of the middle candle wicks needs to stay within the first candle [bull] of the
pattern. By range we mean first candle's high/low. If and when one or more middle candle's wick takes out first candle low then we should have some concern about
validity of the pattern. Remember, nothing is sure in markets.
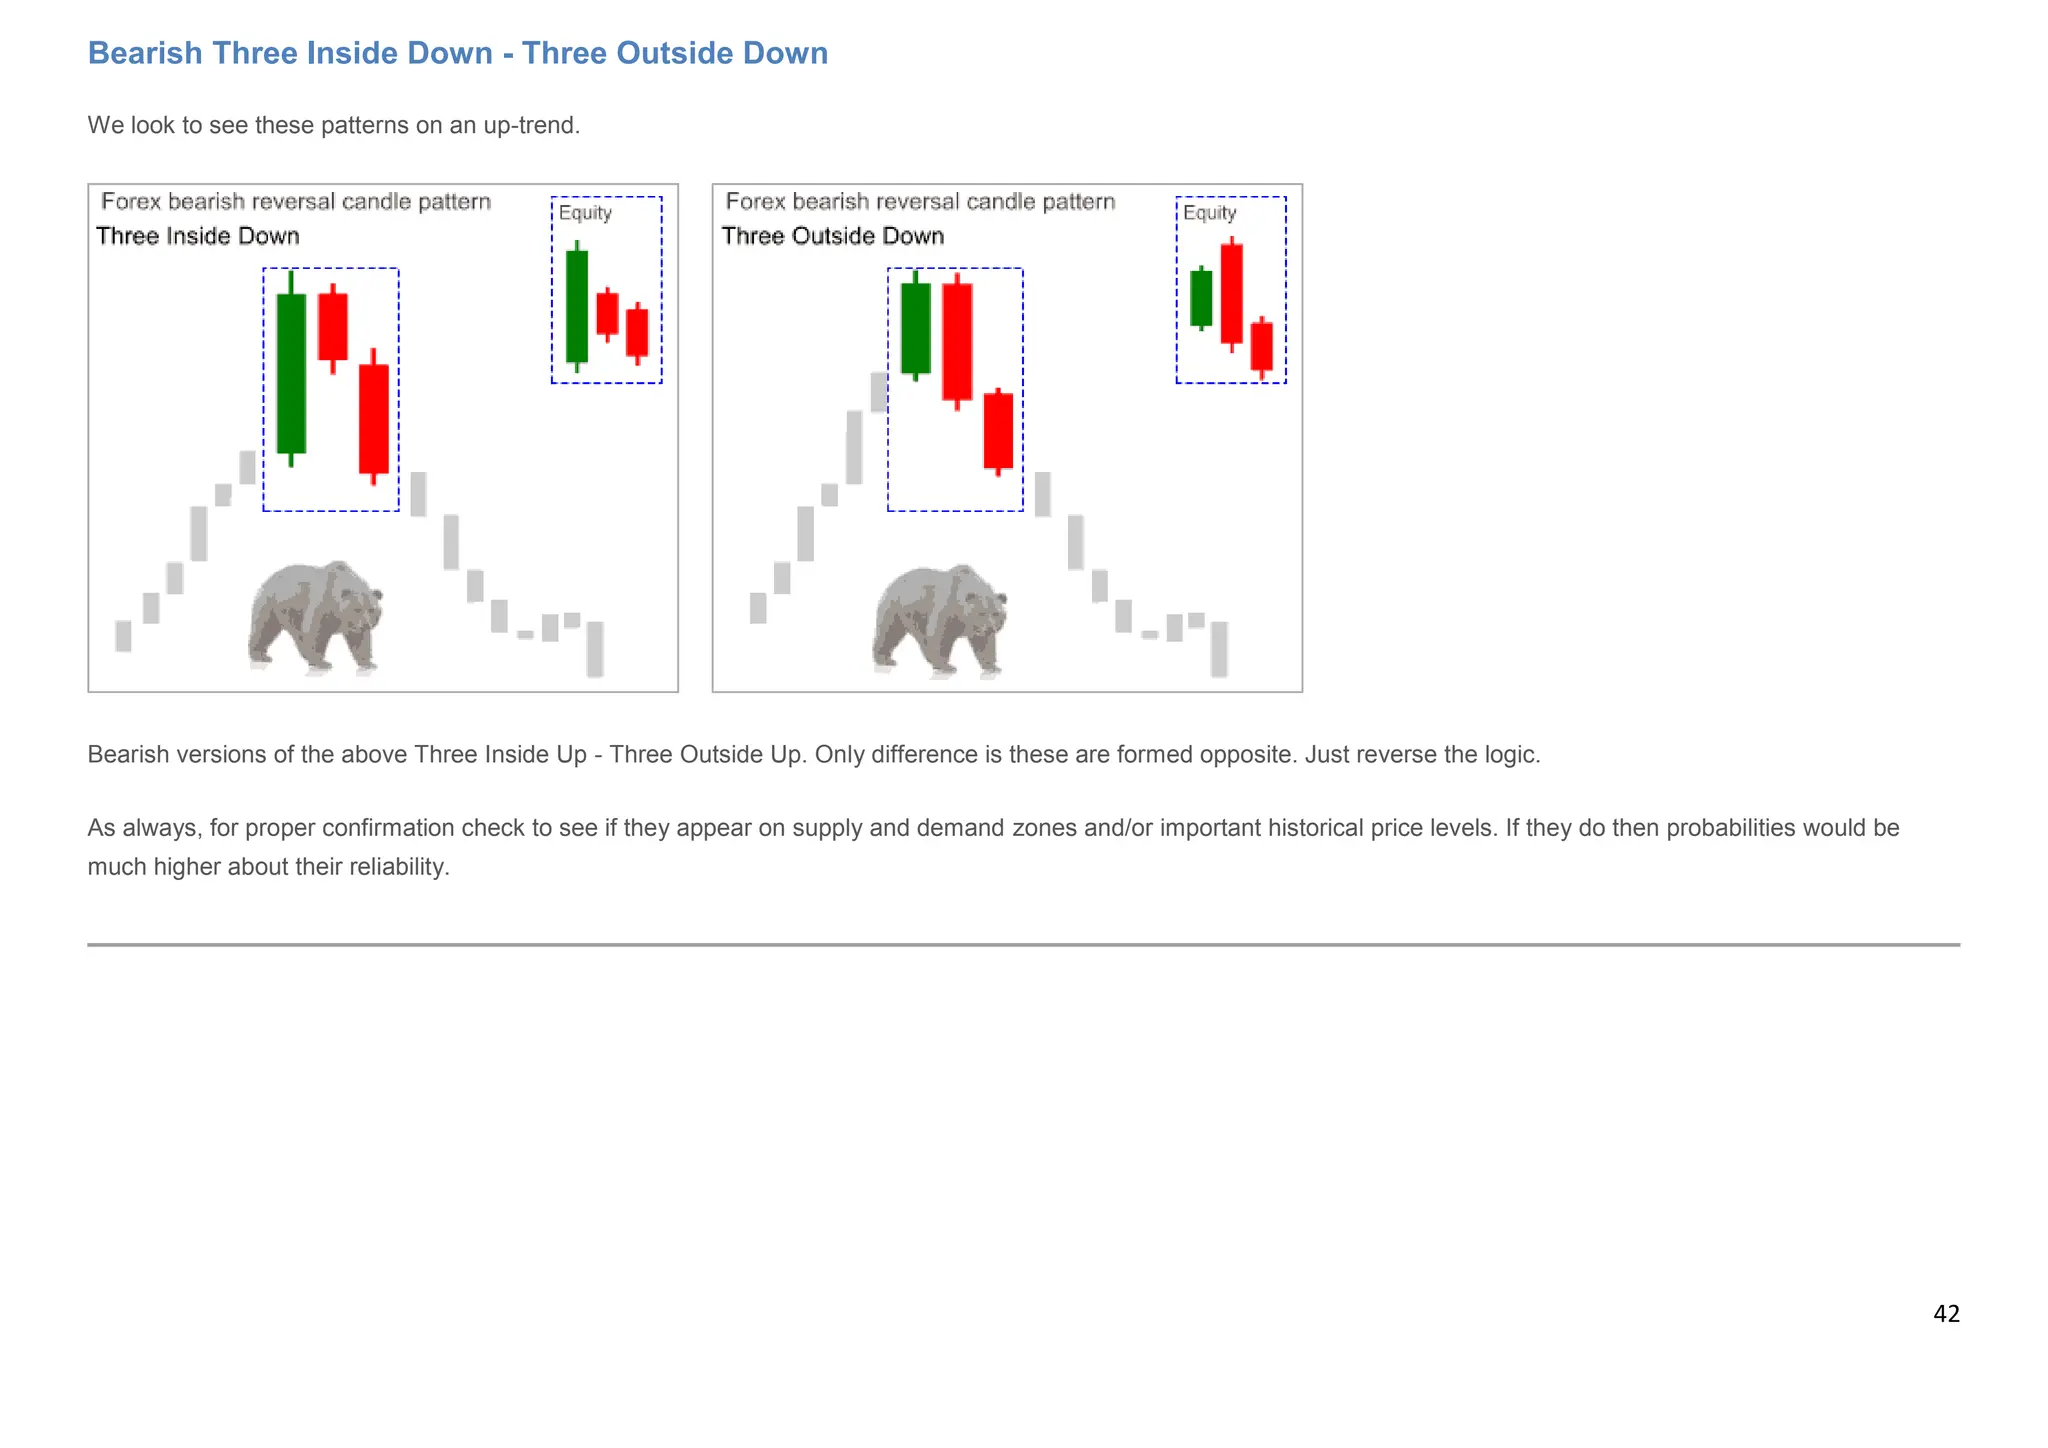
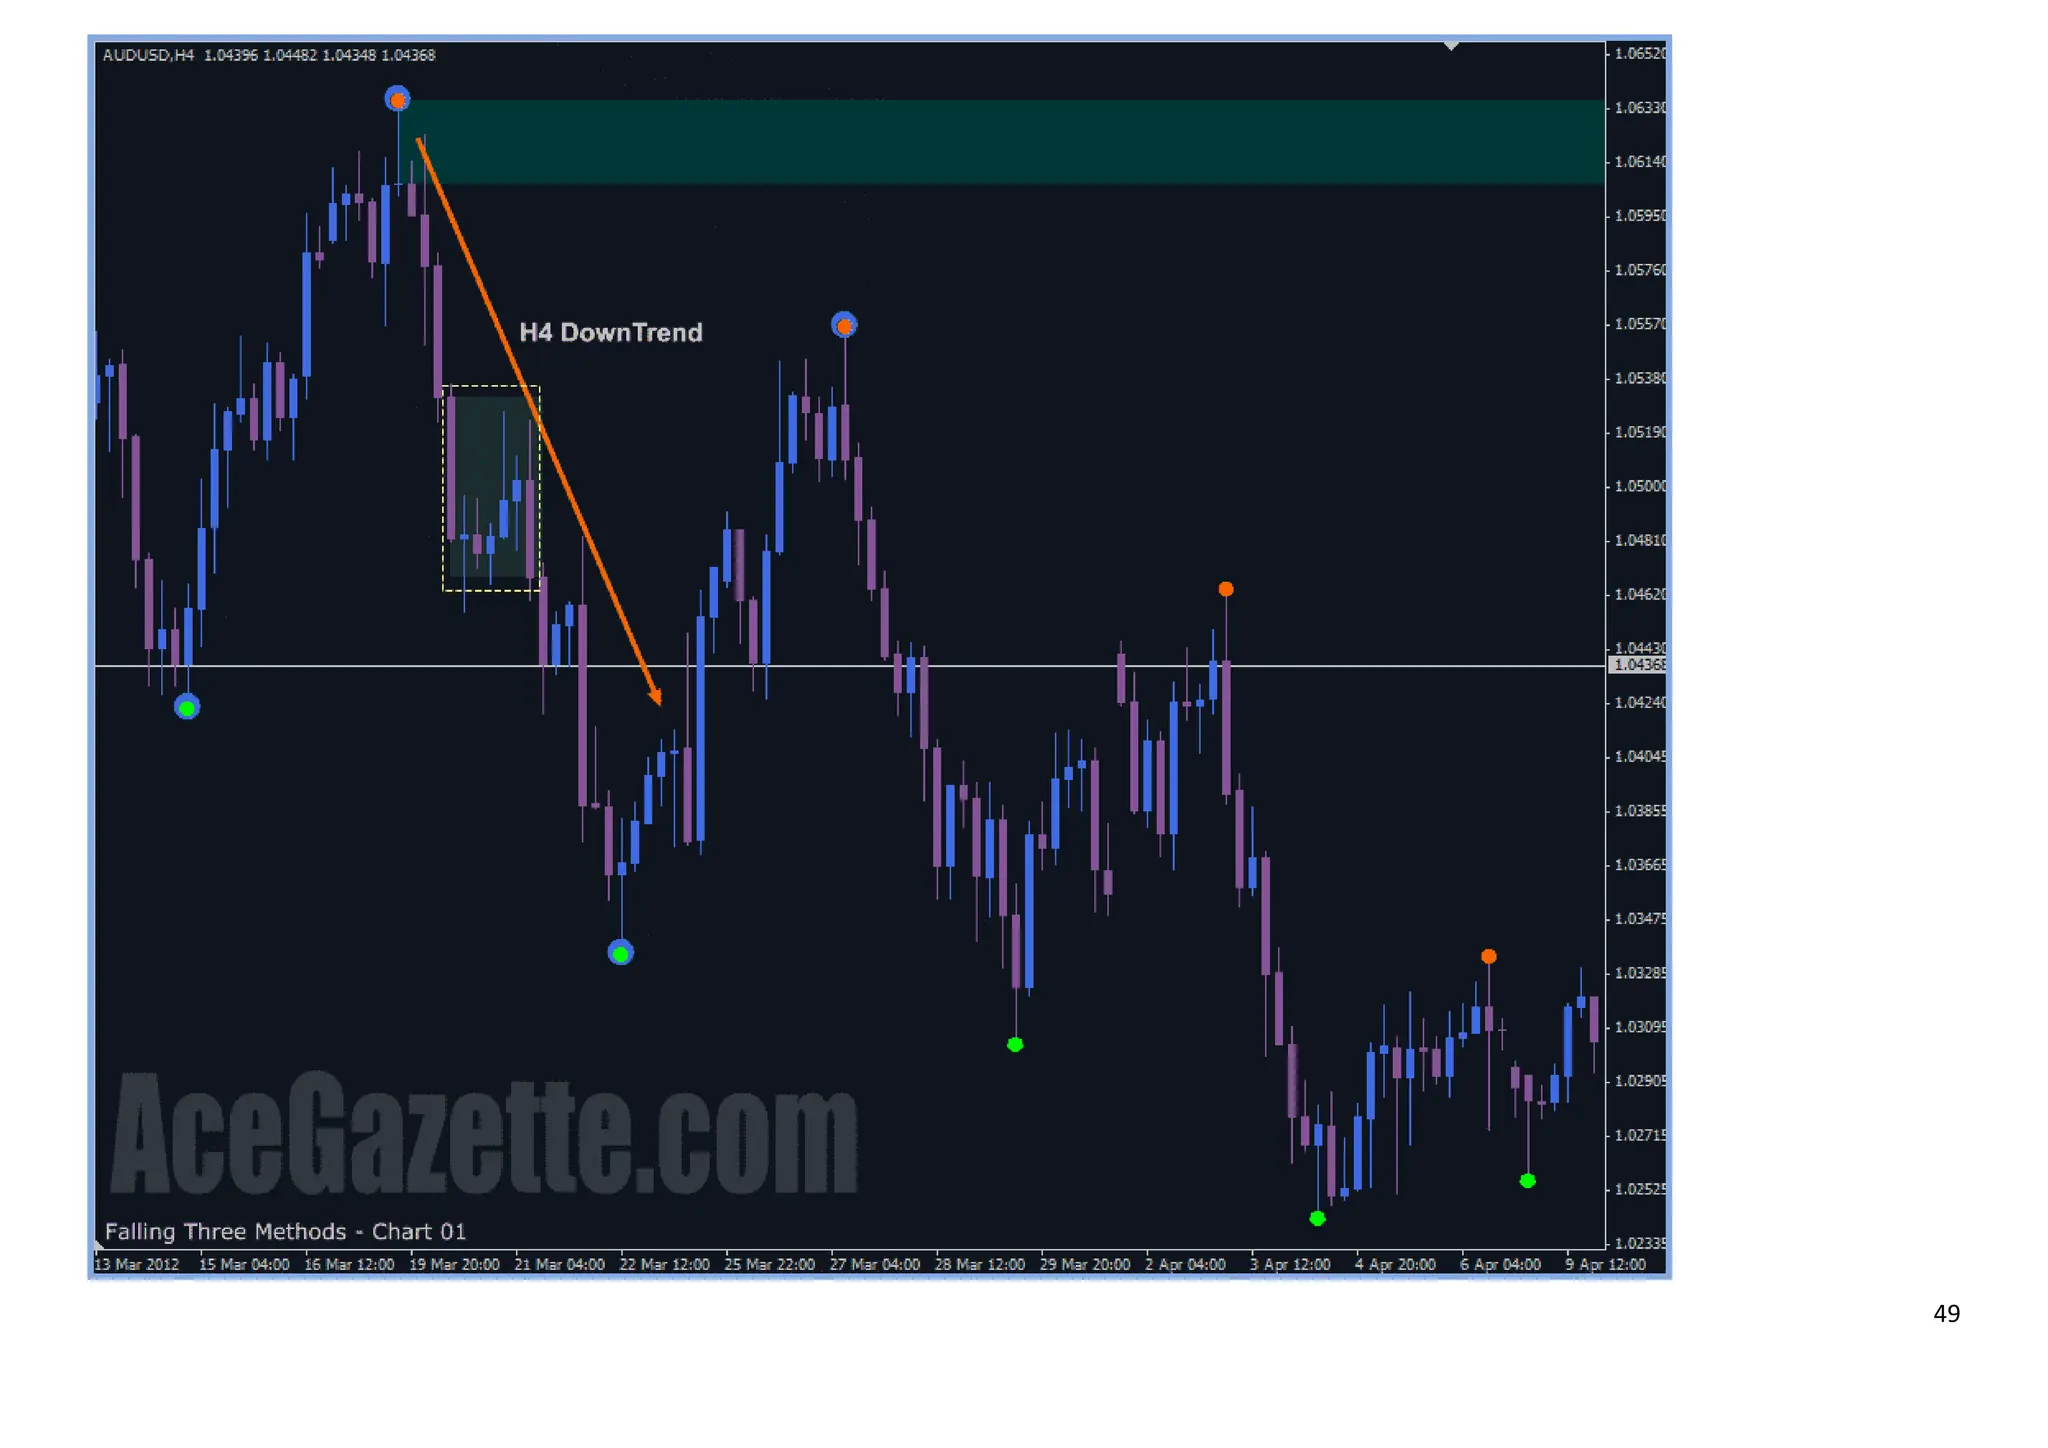
Bearish Falling Three Methods
It's the opposite of Raising Three Methods pattern. Just reverse the logic. Naturally we'd be looking for Falling Three Methods pattern in a down-trend.](https://image.slidesharecdn.com/basiccandlestickpatterngood-8-240323021609-8ef0aaba/75/Basic-Candlestick-Pattern-in-stock-market-finance-47-2048.jpg)
![51
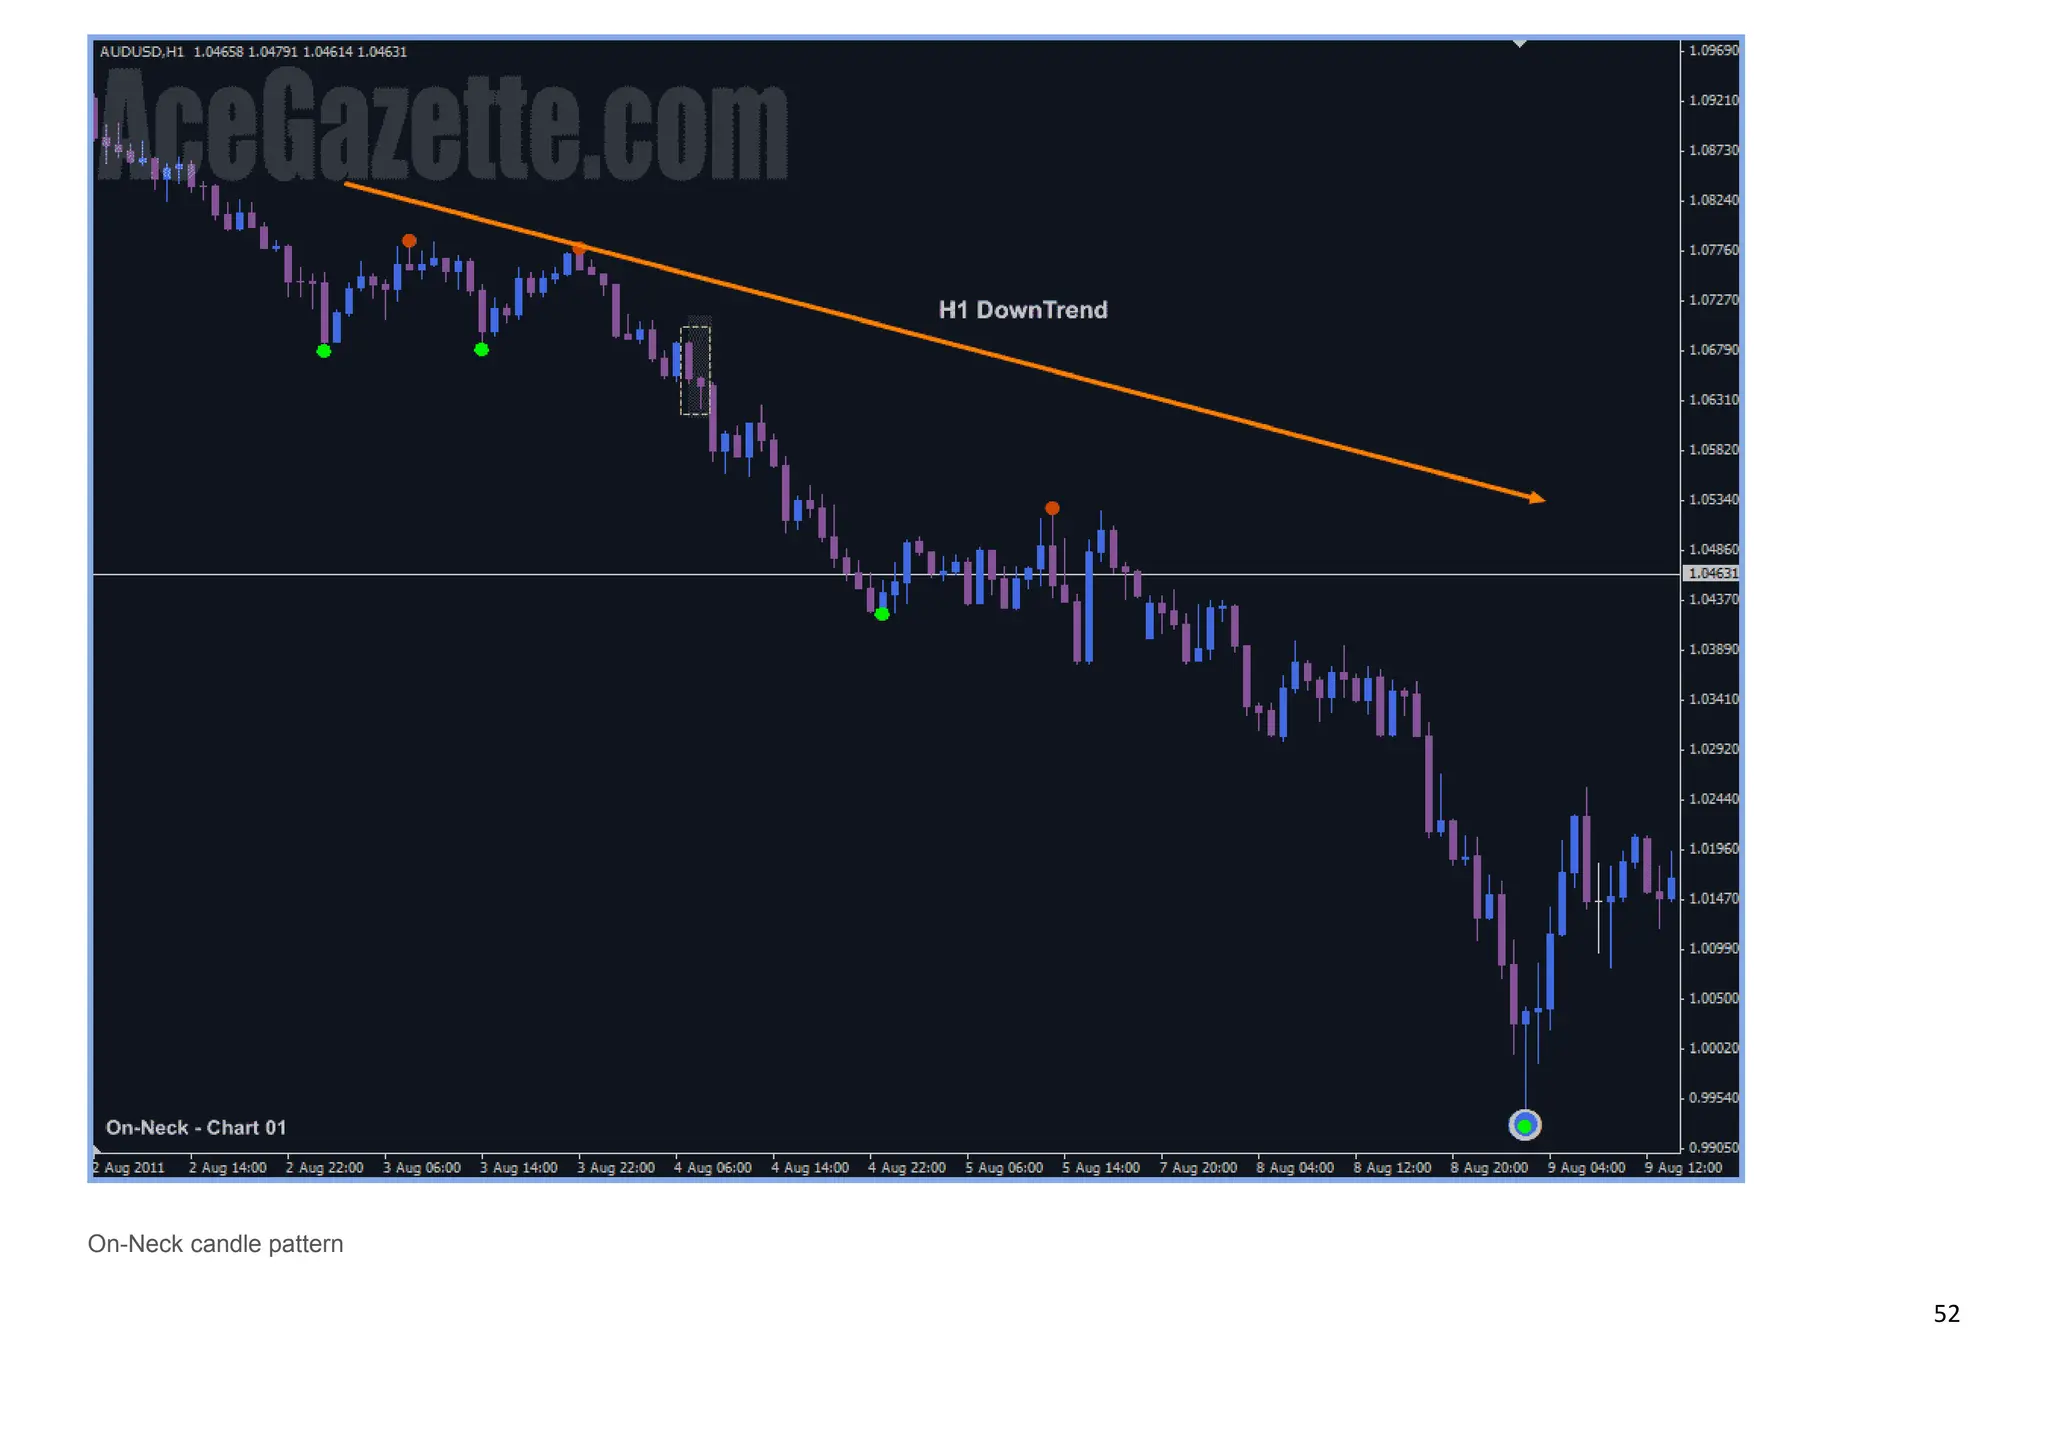
Bearish In-Neck, On-Neck &Thrusting Candle Patterns
Strong continuation On-Neck - Medium Continuation In-Neck - Weak Continuation Thrusting.
We look for these bearish patterns in a down-trend within the context of continuation pattern. Don't forget, this is not a reversal pattern but a continuation one. These patterns
consist of two candles.
Bearish On-Neck candle pattern
We have a long bear candle as a first candle of the pattern. Normally we'd see some profit taking after a large candle but in this occasion profit taking [some retracement]
doesn't happen as the down-trend continues with the second bear candle of the pattern.
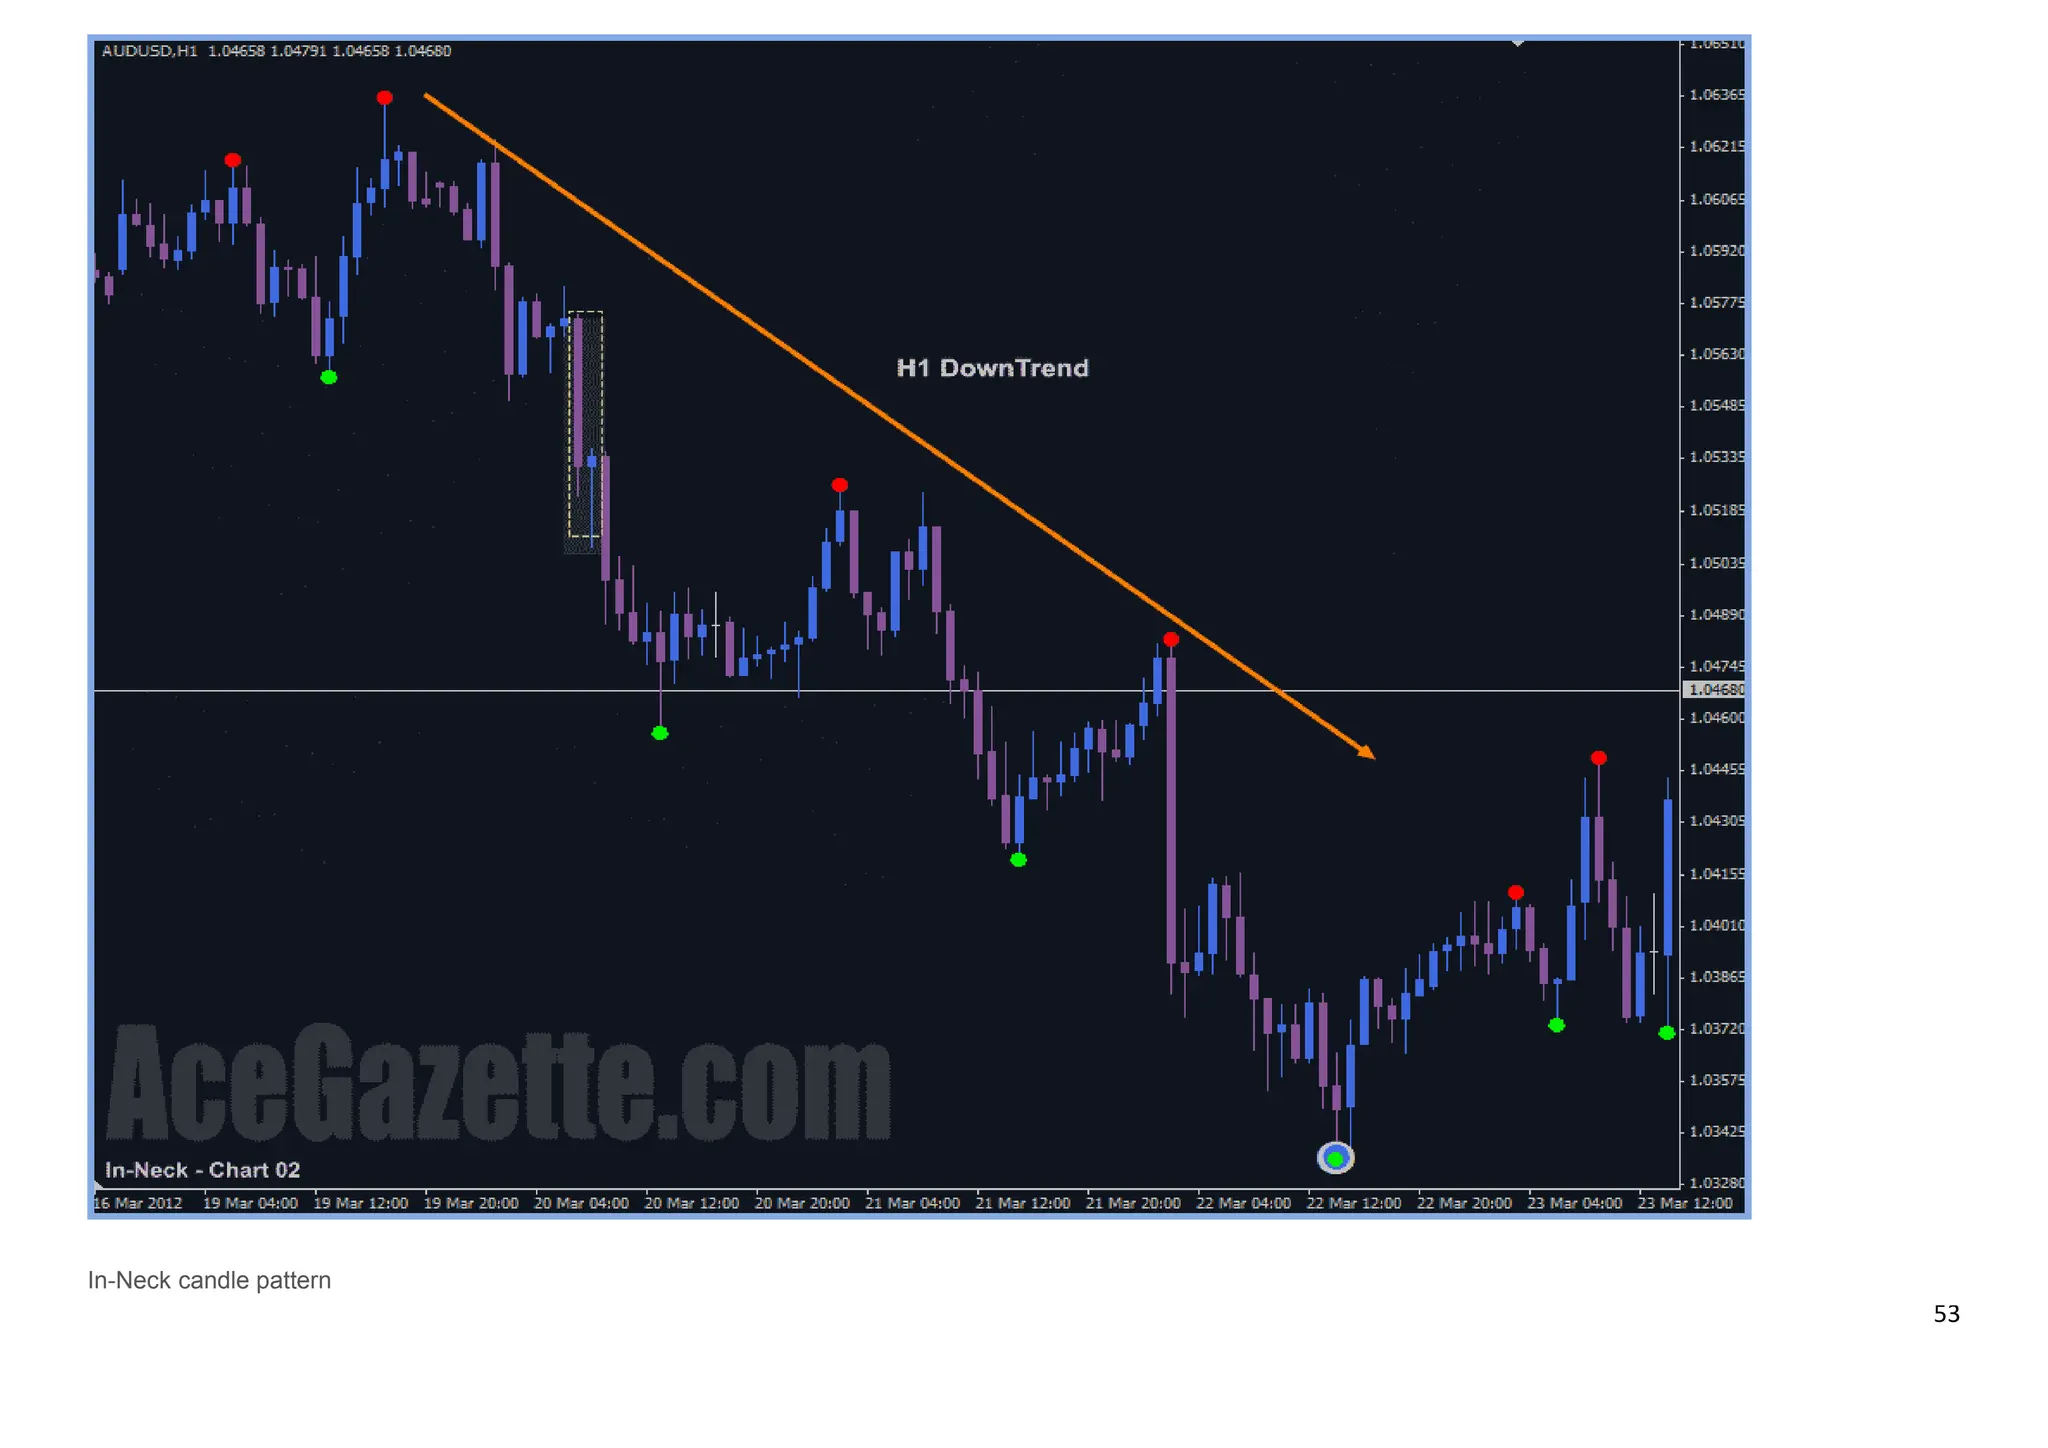
Bearish In-Neck candle pattern
Very similar first bear candle as in On-Neck candle pattern in a down-trend. However, second candle of the pattern starts as a bear candle but closes over the previous
candle to produce a bull candle. In this occasion sellers decides to take some profit on the way down.
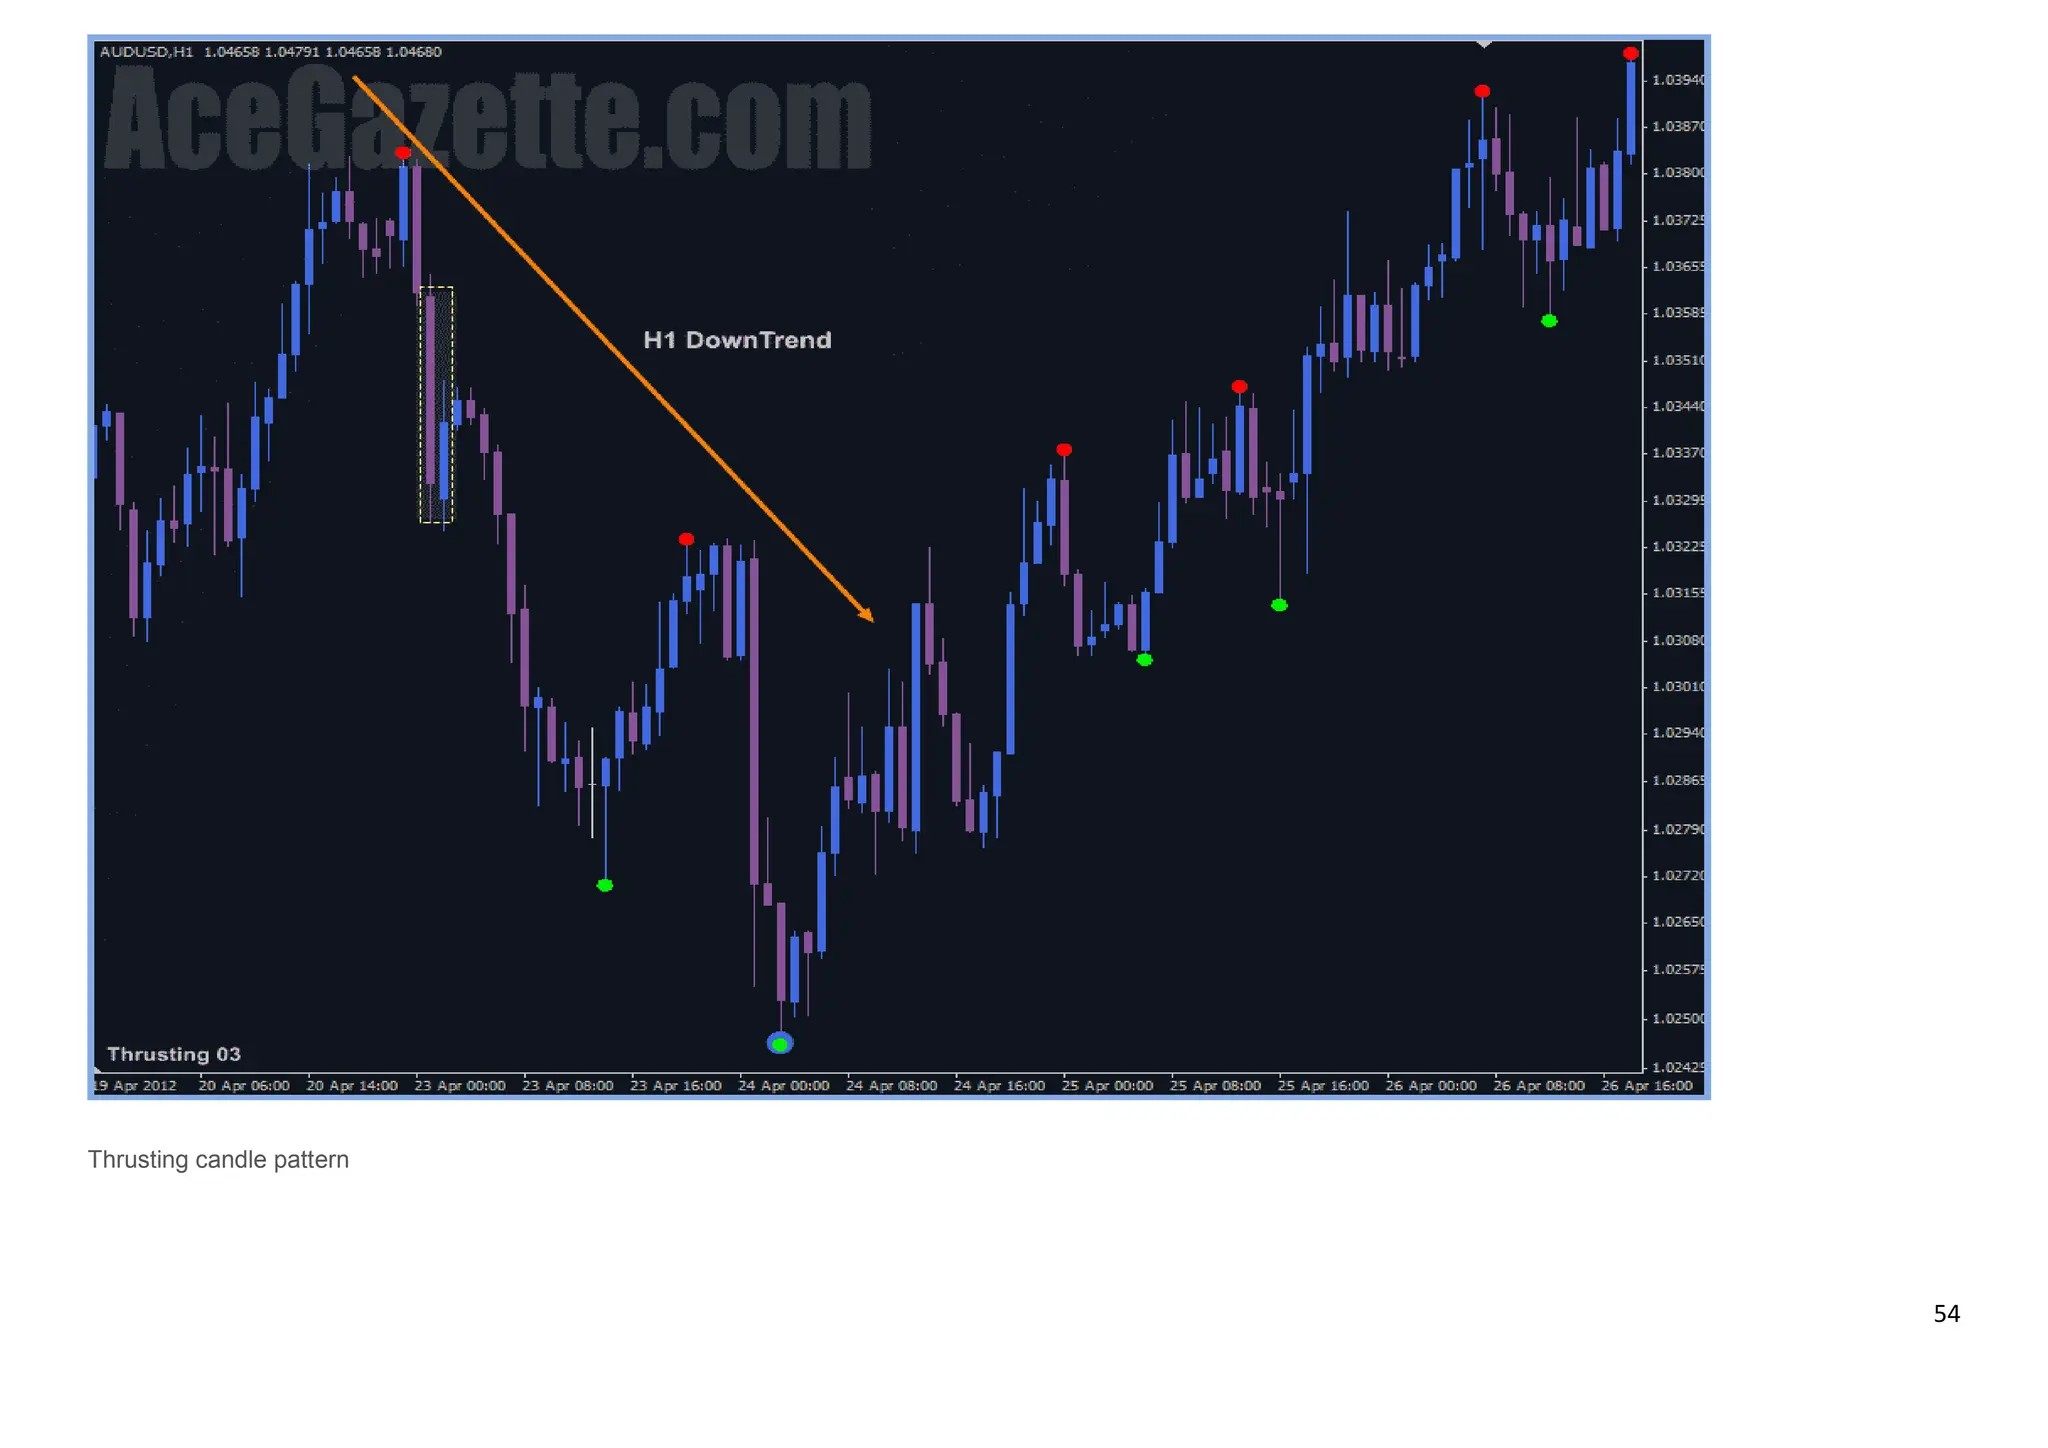
Bearish Thrusting candle pattern
Again we have similar long bear candle as the first candle of the pattern. The second candle starts similar to Bearish In-Neck one but it penetrates further into the first candle,
about halfway but not above. It's just that profit taking by sellers is bit more intensive.
The Bearish Thrusting Candle Pattern looks quite similar to bullish harami pattern but it's much weaker one as bullish Harami closes above the midpoint of first candle.](https://image.slidesharecdn.com/basiccandlestickpatterngood-8-240323021609-8ef0aaba/75/Basic-Candlestick-Pattern-in-stock-market-finance-51-2048.jpg)

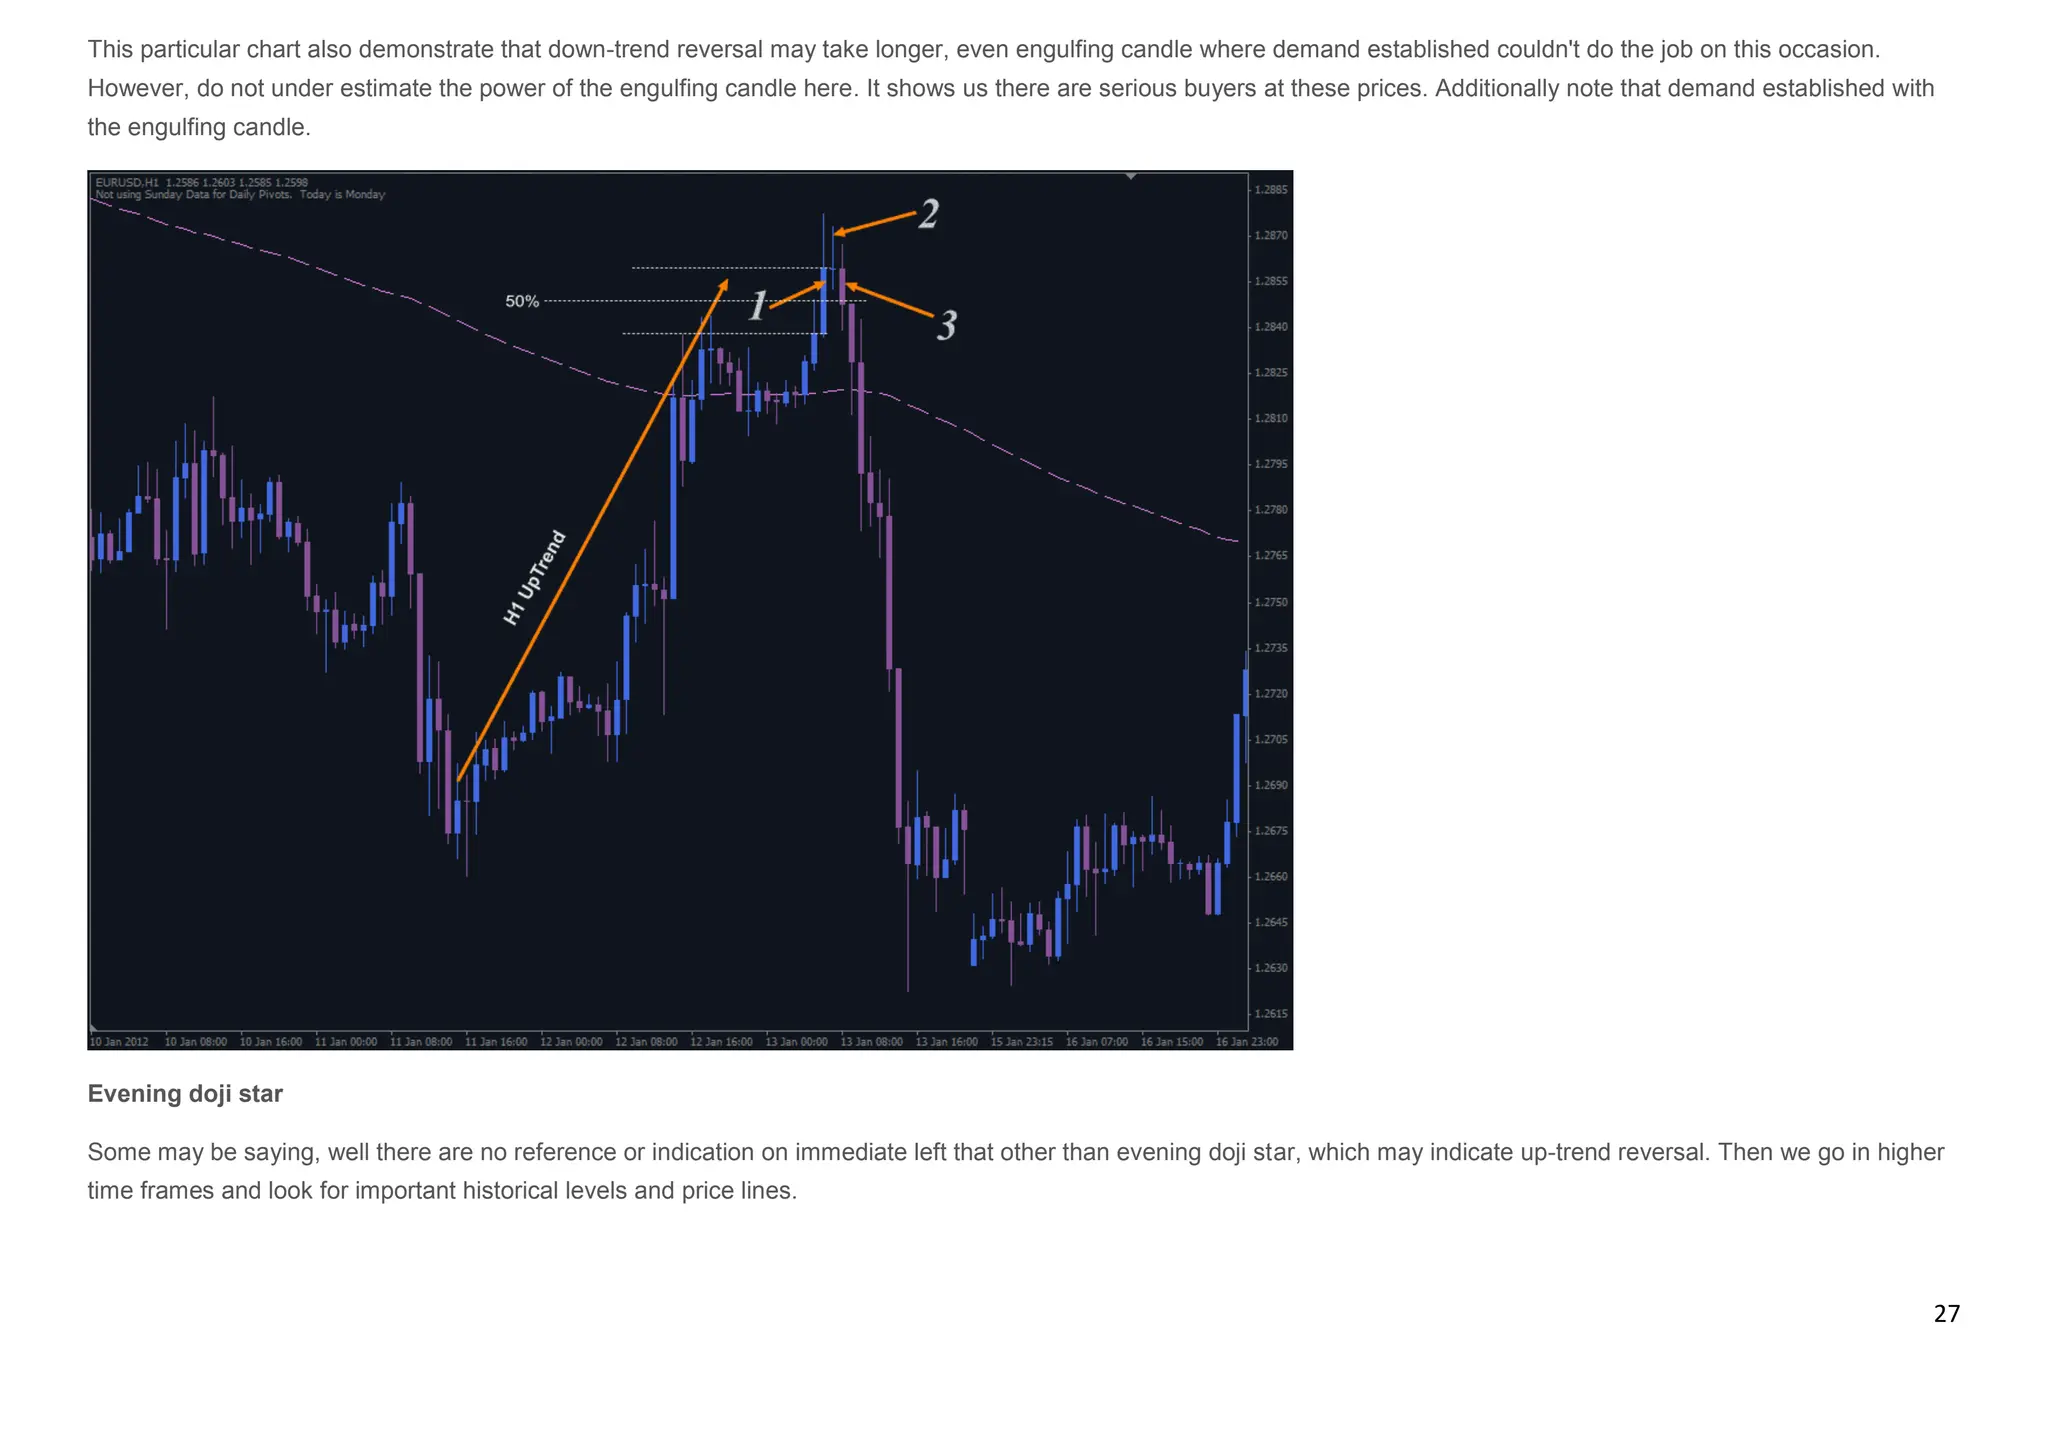
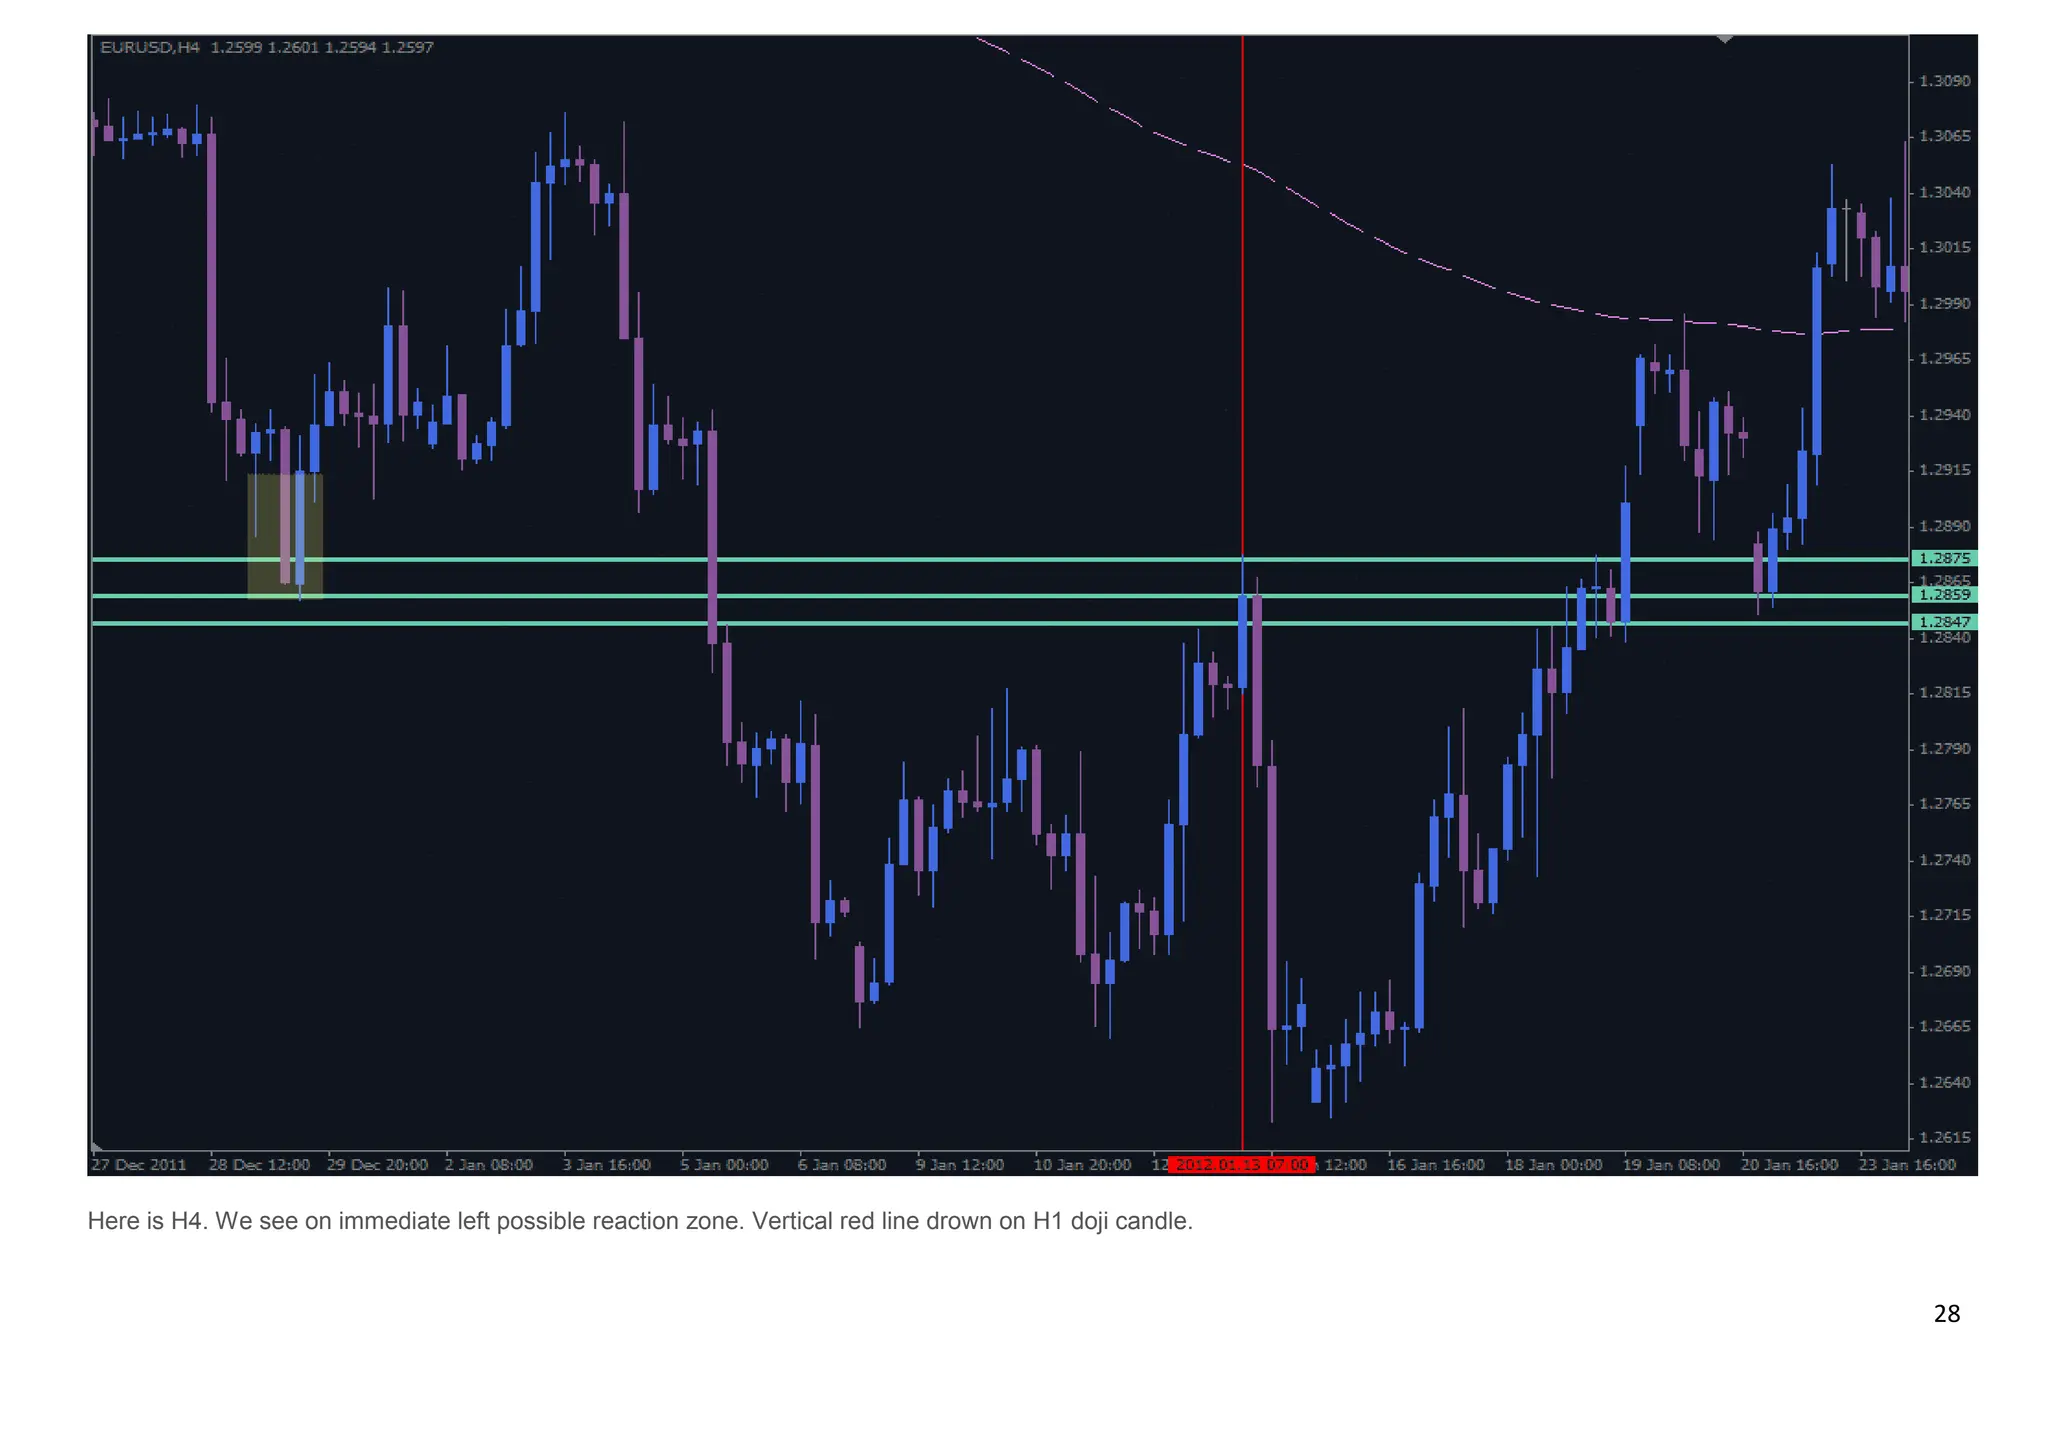
The document provides information on various candlestick patterns used in technical analysis of financial markets. It begins with definitions of basic candlestick types like doji and hanging man candles. It then outlines several reversal patterns like morning star and engulfing patterns that indicate a change in trend. Continuation patterns like rising three methods and falling three methods that suggest the current trend will persist are also discussed. The document provides illustrations and explanations of many common candlestick patterns to help readers understand how to interpret these visual representations of market price action.