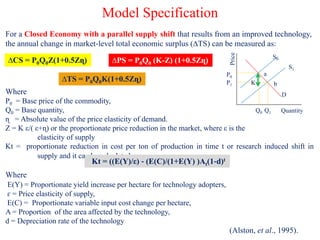
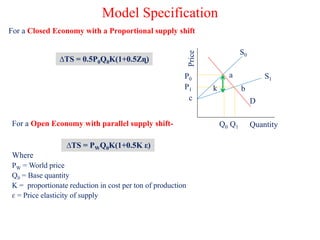
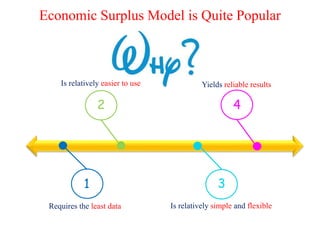
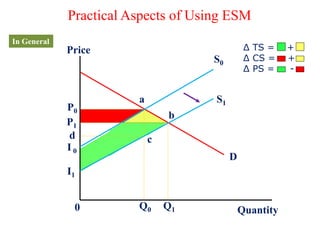
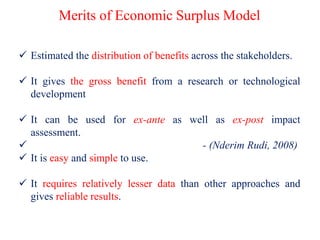
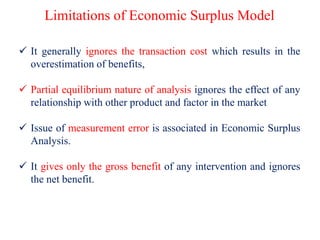
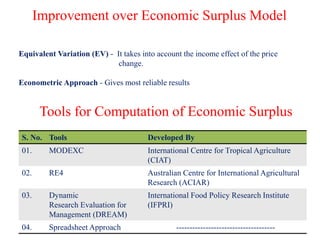
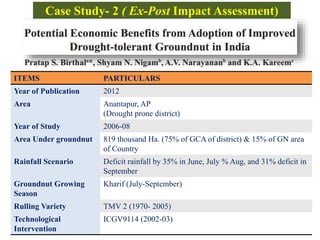
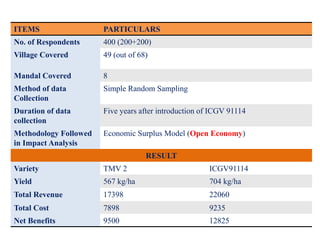
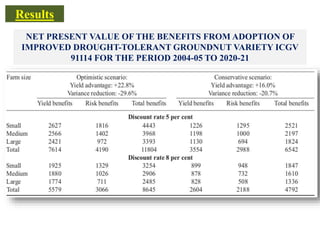
The document discusses the economic surplus model, which is a tool used for ex-ante impact assessment. It provides an overview of the concept, assumptions, specifications, data requirements, and computation of the economic surplus model. The model is popular because it requires relatively little data and provides reliable results. While it has merits such as estimating distribution of benefits, it also has limitations like ignoring transaction costs. The document examines case studies applying the model to assess potential impacts of Bt brinjal in India and actual impacts of a drought-resistant groundnut variety in Andhra Pradesh.
Building Institutional Capacity in Thailand to Design and Implement Climate P...UNDP Climate
23-25 November 2016, Thailand - A centerpiece of the Integrating Agriculture in National Adaptation Plans Programme (NAP-Ag) in Thailand is its support to develop a new five-year Strategy on Climate Change in Agriculture (2017-2021). This is spearheaded by the Ministry of Agriculture and Cooperatives (MOAC) and its Office of Agriculture Economics (OAE). The strategy was unveiled after a series of meetings by a Technical Working Group at a three-day workshop held on 23-25 November 2016 in Bangkok, organized by UNDP. Over 60 participants from each MOAC line department and 10 participants from academia and civil society were briefed by the Office of the Natural Resources and Environmental Policy and Planning (ONEP) and GIZ on the status of the National Adaption Plan (NAP) and learned how NAP-Ag programme efforts could support a broader NAP process and align with the Sector Plan. The new strategy focuses on improving evidence and data for informing policy choices, building the capacity of farmers and agri-businesses to adapt, promoting low-carbon development and productivity growth in the sector, and building institutional and managerial capacities to cope with climate change impacts.
Soil Conservation and Small-scale Food Production in Highland Ethiopia: A Sto...SIANI
This study was presented during the conference “Production and Carbon Dynamics in Sustainable Agricultural and Forest Systems in Africa” held in September, 2010.
Fitman webinar 2015 06 Socio-Economic Impact Assessment MethodologyFITMAN FI
A webinar on the Socio-Economic Impact Assessment Methodology developed in FITMAN project. This methodology has been developed to analyse and estimate the social and economic impacts of the FITMAN use case trials by adopting FIWARE technologies. Presented by Vegard Engen from the IT Innovation Centre, University of Southampton.
This presentation discusses the following topics:
What is Engineering Economics?
Why Engineering Economics?
Scope of Engineering Economics
Example of Engineering Economics
Rational Decision-Making Process
Engineering Economics Decision
Role of Engineers in Business
Types of Business Organizations
Thailand UNDP-GIZ workshop on CBA - A review of conduction cost-benefit analysisUNDP Climate
Thailand, 27-28 November 2017 - UNDP and GIZ partnered with the Thailand Office of Agriculture Economics (OAE) to launch a workshop designed to connect vital stakeholders to build an effective National Adaptation Plan.
The two-day workshop at the Rama Garden Hotel had 20 participants from each department under the Ministry of Agriculture and Cooperatives (MOAC). The workshop was designed to build capacity of planning officers to formulate better projects and budget submissions as well as potential climate finance proposal using cost-benefit analysis and ecosystem-based analysis appraisal tools.
Exploring the Dynamics of Production Functions.pdfTEWMAGAZINE
Production Functions it represents the technological relationship between inputs and outputs in the production process. It specifies the maximum quantity of output
Decision Support System for Energy Saving Analysis in Manufacturing IndustryIJRES Journal
Nowadays the attempts to optimize energy efficiency and environmental impact are increasingly present in all activity areas and specifically in manufacturing industry. An innovative approach to achieve these optimizations lies in advanced combination of decision support technologies and Knowledge Management. A benchmarking energy saving tool (decision support tool) was carried out in four (4) different years, 2007 to 2010 in Niger mills limited, located in Calabar to generate energy intensity and energy intensity index of the period. The result obtained for energy intensity in 2007 was 2.30GJ/m3, Energy intensity for 2008 was 2.30GJ/m3, Energy intensity for 2009 was 2.40GJ/m3, and energy intensity for 2010 was 2.30GJ/m3. This result shows that for the period of these four years, that the energy consumed is in an average range of 2.30GJ/m3. That if the productivity increase as the result of increase in production, the energy intensity will increase to 2.40GJ/m3 or there about as the case maybe as a result of increase in production.
20151112 Conference Call on Economic Opportunities for Clean Energybusinessforward
As America transitions to using cleaner energy sources, new opportunities should emerge for American businesses. A report released this week by ICF International and NextGen Climate America found that accelerating the transition to a clean energy economy will decrease energy costs and create over a million jobs by 2030.
Please join us for a conference call with Dan Lashof, Chief Operating Officer of NextGen Climate America, who will discuss the economic opportunities of clean energy.
Modelling Production Performance of Small Scale Production PlantIJAEMSJORNAL
This paper is about development of a model to evaluate capacity utilization (CU) of small scale production plants. The model employed short term production function with key independent variables of: plant operators, capital, R&D, energy and machinery maintenance expenditure. CU of small scale plant is the output and dependent variable for this study. The developed model is tested on a small scalewater production plant. The output results show that the average CU is 74% for six months of operations. The model test results revealed that all the inputs are positively correlated (R>0.893) to CU, with major inputs are significantly contributing to CU. About 80% (R2=0.797) of the inputs are consumed to achieve CU of production process. The model estimated value was found to be close to actual recorded outputs (<2% difference). The model is found to be statistically significant at 95% confidence level with p-value less than 0.05. The developed model is useful for small scale plants in evaluating the production performance to achieve technical and economical sustainability. For further research in this topic, this study suggests building a model to optimize the contribution of inputs to CU of small scale production plants.
International Journal of Engineering Research and Applications (IJERA) is an open access online peer reviewed international journal that publishes research and review articles in the fields of Computer Science, Neural Networks, Electrical Engineering, Software Engineering, Information Technology, Mechanical Engineering, Chemical Engineering, Plastic Engineering, Food Technology, Textile Engineering, Nano Technology & science, Power Electronics, Electronics & Communication Engineering, Computational mathematics, Image processing, Civil Engineering, Structural Engineering, Environmental Engineering, VLSI Testing & Low Power VLSI Design etc.
“Beyond Experiments: General Equilibrium Simulation Methods for Impact Evaluation" presented by Xinshen Diao, IFPRI and Edward Taylor, University of California at the ReSAKSS-Asia Conference, Nov 14-16, 2011, in Kathmandu, Nepal.
Attempt to control efficiency in manufacturing aaron81462
Up until now, manufacturers have been seeking doable ways to lower costs and boost productivity in their operations. Many of them prefer reducing product quality to save production expenses, but doing so will only hurt their profitability because customers who aren’t satisfied will quit buying.
MSM - Multi-Layer Stream Mapping as a Combined Approach for Industrial Proces...António J. Baptista
Abstract
Nowadays achieving sustainable development is a global concern. The issue of unsustainability can be related to population growth and excessive consumption of natural resources. To tackle these issues, several management tools and methodologies have been developed in the last years, to assess, analyse and improve the environmental and economic performance of production systems. This work presents an approach based value stream mapping in order to assess and improve energy efficiency, environmental performance and financial performance of a production system. The developed approach can be applied to any industry or production system, where all the unit processes involved are identified and the inputs/outputs of each unit system quantified and easily perceived. Key environmental performance indicators and the corresponding eco efficiency ratios arise as outcomes of this approach, in which a Multi Layer Stream Mapping (MSM) with visual management attributes is created
Building Institutional Capacity in Thailand to Design and Implement Climate P...UNDP Climate
23-25 November 2016, Thailand - A centerpiece of the Integrating Agriculture in National Adaptation Plans Programme (NAP-Ag) in Thailand is its support to develop a new five-year Strategy on Climate Change in Agriculture (2017-2021). This is spearheaded by the Ministry of Agriculture and Cooperatives (MOAC) and its Office of Agriculture Economics (OAE). The strategy was unveiled after a series of meetings by a Technical Working Group at a three-day workshop held on 23-25 November 2016 in Bangkok, organized by UNDP.
Over 60 participants from each MOAC line department and 10 participants from academia and civil society were briefed by the Office of the Natural Resources and Environmental Policy and Planning (ONEP) and GIZ on the status of the National Adaption Plan (NAP) and learned how NAP-Ag programme efforts could support a broader NAP process and align with the Sector Plan. The new strategy focuses on improving evidence and data for informing policy choices, building the capacity of farmers and agri-businesses to adapt, promoting low-carbon development and productivity growth in the sector, and building institutional and managerial capacities to cope with climate change impacts.
Determination of Optimum Parameters Affecting the Properties of O Rings
Credit Seminar
1. ECONOMIC SURPLUS MODEL:
A Tool for Ex-Ante Impact Assessment
JAIPRAKASH BISEN (10562)
Ph.D. Ist Year
Division of Agricultural Economics
Indian Agricultural Research Institute, Pusa
New Delhi-110012
Speaker
2. Scheme of Presentation
1) Concept of Impact and Impact Assessment
2) Basic Questions on Impact Assessment
3) Economic Approaches to Impact Assessment
4) Economic Surplus Model (ESM)-
a) Introduction
b) Basic Assumptions of ESM
c) Model Specification
d) Reasons for Popularity of ESM
5) Practical Aspects of Using the ESM-
a) Type of Data Required
b) How to Use the Model / How to Calculate Economic Surplus
6) Merits of Economic Surplus Model
7) Limitations of Economic Surplus Model
8) Improvements Over ESM
9) Scope of Using ESM
10) Case Studies
3. Concept of Impact & Impact assessment
Impact Assessment is the process of identifying the future consequences of
a current or proposed action.
The “impact” is the difference between what would happen with
the action and what would happen without it.
Adopted from- Ruth Simsa et.al., 2014
OUTCOME IMPACTINPUT ACTIVITIES OUTPUTS
Results that are
measurable
(Tangible)
Results that are
not measurable
(Intangible)
Outcome with
intervention -
Outcome
without
intervention
Fig: The Impact Value Chain, Adopted from- The Goldman Sach Foundation, 2003
4. • Why to do Impact Assessment? (Reason)
Feasibility study; Beneficiary; Change in variable- Poverty,
Education, Employment, Environmental quality, Income, Prices,
Living Standard etc.
• When to do Impact Assessment?
Before ( Ex- Ante) and After ( Ex-Post )
• Approaches in Impact Assessment?
Before and After (But it needs the benchmark information and
sometimes the benefits may be exaggerated)
With and Without (Can be used only when the two comparing
units are homogenous)
• What to Measure in Impact? (Indicators)
Efficiency, Food security, Sustainability, Employment generation,
Institutional capacity, Net Benefits etc.
• Level of Impact Assessment?
Farm; Household; Regional; National; Global level
Basic Questions on Impact Assessment
5. Impact Indicators
FARM Level
Increase in average yield
Increase in net income
Decline in unit cost of production
Enhance employment and labor productivity
Price premium due to quality
Increase of improved seed demand
Household food & nutritional security
Gender related issues
REGIONAL Level
Food production
Sustainability of natural resources
Food security
Employment issues
Equity issues
Poverty
Trade
Inter- sectoral linkages
Production
Prices
Trade:
Export
Import
Spill-over effect
Sustainability of natural resources
NATIONAL Level
Note: it’s not the exhaustive list of indicators. They may vary as per objectives of research
Source- Kumar P., Slideshare. net
Accessed on -07/07/2016
6. Types of Impact Assessment
Before the project or
program is initiated
Aid in priority
setting
Expected values
Perspective
After adoption of a research
product
Tangible and intangible
outcomes after its successful
implementation
Actual Values
Retrospective
Ex-Ante
Ex-Post
7. Significance of Impact Assessment
.
It identifies the under and over represented functions and factors of the
policies and structures.
It acts as the supporting pillar in the development of policies and structures.
Applicable, acceptable and equally useful in all the field of life.
Helps in improving the performance of the procedure or product.
Enlightens the environmental, health social and economics consequences of
the application under process.
8. Provides assured structure and reduces the risk of practical performance.
Enlightens the logical and conceptual objectives.
Provides testimonials for the fundamentals of policies.
Improves and assess the quality of the policy, product or a procedure.
Considered a the integrated approach which analyze both the disadvantages
and advantages
Provides confidence to the new initiatives in the society.
Also help the organization in evaluating the cost and maintenance of the
policies or structures.
Continue…
9. Economic Approaches to Impact Assessment
1) Econometric Approach- The econometric approach employs a production
function, cost function, or a total factor productivity analysis to estimate the
change in productivity due to investment in research.
It also uses regression models (like probit, logit, tobit, and two-stage least squares
(2SLS) regressions) to explain the impact of investment on socio-economic and
agro-ecosystem services.
• The main constraint on the wider application of econometric approaches in
developing countries is data availability (good-quality time-series data) and
quality.
• Alternative to time series data- Panel Data (Cassman and Pingali,1995;
Pender, 2005)
2) Project Approach- It uses the tools like Benefit-Cost Ratio, Net Present Worth of
project, Internal Rate of Returns, Sensitivity Analysis etc. to assess the project
impact. But, its purely Economic and overlooks the social impact.
10. 3) Economic Surplus Approach- Most popular and fruitful approach used to
assess the consequences of investments in agricultural research (Griliches,1958)
4) Bio-Economic Model- Its the integration of biophysical and economic
information into a single integrated model which is capable of simultaneously
addressing various dimensions of agriculture and NRM technology changes and
the resulting trade-offs among economic, sustainability and environmental
objectives. (Barbier, 1998; Barbier and Bergerson, 2001; Holden and Shiferaw,
2004;Holden et.al. 2004)
5) Meta Analysis- is effectively an analysis of analyses. It is a relatively new
methodology and its main purpose is to collate research findings from the previous
studies, and distil them for broad conclusions.
Meta-analysis is helpful to policymakers, who may be confronted by numerous
conflicting conclusions
6) Programming Methods- try to identify one or more optimal technologies or
research activities from a set of options. Thus, these methods try to maximize one
objective, i.e. farmers’ profit subjected to constraints like availability of land,
labour and other inputs.
11. APPROACHES MAJOR ADVANTAGE MAJOR LIMITATIONS
Econometric Approach All sectors are included Non- availability of time
series data
Project Approach Give precise results and are
quick to estimate
Only Economic impact are
measured., Sensitive to
discount rate and no of
years of project
Economic Surplus
Approach
All sectors are included &
it needs less information
than the other methods
Elasticity of demand &
Elasticity of supply
sensitive
Bio-Economic Model Whole system is included,
Optimization
Meta Analysis Provides a macro picture Aggregation bias
Adopted from- K. Palanisami et.al, 2011
12. Concept of Economic Surplus
PRICE
QUANTITY
P
D
S
S
D
e
O
Q
Consumer’s Surplus
Producer’s Surplus
Economic Surplus
Economic surplus represents the difference between the monetary value
of the units consumed and the monetary value of units produced up to
the equilibrium price and quantity.
13. • ESM, based on some of the tools of welfare economics look at
how the interaction of demand and supply determine the value
of economic transaction.
• ESM shows how the research affect the supply and demand
and their resultant market outcomes.
• By augmenting product quality that increase the product
demand, or lowering the cost of production that increase the
supply, research can expand the market and change the
economic rewards for market participants.
14. Assumptions of Economic Surplus Model
1) A parallel shift of the supply curve following the adoption of
technology/ Investment,
2) The functional form of the supply curve is unknown
3) Assumption of closed economy
4) Country is the only exporter of product and rest of world do not
adopt the technology (In case of Open Economy)
5) The competitive demand price for a given unit measures the value
of that unit to the consumer.
6) The competitive supply price for a given unit measures the value of
that unit to the producer.
7) The costs and benefits accruing to each member of the relevant
group should be added.
Harberger ,1971 and Alston, 1995
15. Model Specification
For a Closed Economy with a parallel supply shift that results from an improved technology,
the annual change in market‐level total economic surplus (∆TS) can be measured as:
Where
P0 = Base price of the commodity,
Q0 = Base quantity,
ɳ = Absolute value of the price elasticity of demand.
Z = K ε/( ε+ɳ) or the proportionate price reduction in the market, where ε is the
elasticity of supply
Kt = proportionate reduction in cost per ton of production in time t or research induced shift in
supply and it can be calculated as
Where
E(Y) = Proportionate yield increase per hectare for technology adopters,
ɛ = Price elasticity of supply,
E(C) = Proportionate variable input cost change per hectare,
A = Proportion of the area affected by the technology,
d = Depreciation rate of the technology
(Alston, et al., 1995).Price
P0
P1
Q0 Q1
a
bK
S0
S1
Quantity
D
∆TS = P0Q0K(1+0.5Zɳ)
Kt = ((E(Y)/ε) ‐ (E(C)/(1+E(Y) )At(1‐d)t
∆PS = P0Q0 (K-Z) (1+0.5Zɳ)∆CS = P0Q0Z(1+0.5Zɳ)
16. For a Open Economy with parallel supply shift-
Where
PW = World price
Q0 = Base quantity
K = proportionate reduction in cost per ton of production
ɛ = Price elasticity of supply
Model Specification
Price
P0
P1
Q0 Q1
a
bk
S0
S1
c
Quantity
D
For a Closed Economy with a Proportional supply shift
∆TS = 0.5P0Q0K(1+0.5Zɳ)
∆TS = PWQ0K(1+0.5K ε)
17. Economic Surplus Model is Quite Popular
1
2
3
4
Requires the least data
Is relatively easier to use
Is relatively simple and flexible
Yields reliable results
18. Practical Aspects of Using ESM
In General
Price
Quantity0
S0
S1
D
P0
P1
a
b
cd
I 0
I1
Q0 Q1
Δ TS = +
Δ CS = +
Δ PS = -
19. Variant- 1 Variant- 2
Technological innovation
leads to COST REDUCTION
Technological innovation
leads to INCREASE IN SUPPLY
PRICE
QUANTITY
P0
D
S0
D
e0
O Q
P1 S1
e1
PRICE
QUANTITY
P0
D S1
D
e0
O Q0
e1
S0
Q1
Change in Economic Surplus = P0e0e1P1 Change in Economic Surplus = Q0e0e1Q1
Continue…
21. Cost of Research/Developing a Technology
• Why it is required to estimate the research cost?
Continue…
I. Several costs are involved in the generation of research and technologies, &
II. To analyse the research’s viability is necessary to estimate the research costs.
• What costs to be considered?
The operation costs-
Fuel, energy, laboratory, field products and other inputs (Same for
capital assets also)
Other Costs-
The administrative expenses, costs of complementary services as libraries and the
costs of technology transfer like extension programmes.
- (Masters et al., 1996)
Wages of the team employed as well as time devoted to generate a technology
-(Pardey et al., 2002)
22. a) Productivity increase generated by research,
b) Equilibrium price of assessed product,
c) Adoption rate and costs,
d) Timeframe between research and adoption, and
e) Price elasticity of supply and demand.
To calculate the magnitude
of change of the supply
curve as a result of the
adoption of technological
innovations
(Maredia et al., 2000).
Data Required for using ESM
24. Merits of Economic Surplus Model
Estimated the distribution of benefits across the stakeholders.
It gives the gross benefit from a research or technological
development
It can be used for ex-ante as well as ex-post impact
assessment.
- (Nderim Rudi, 2008)
It is easy and simple to use.
It requires relatively lesser data than other approaches and
gives reliable results.
25. Limitations of Economic Surplus Model
It generally ignores the transaction cost which results in the
overestimation of benefits,
Partial equilibrium nature of analysis ignores the effect of any
relationship with other product and factor in the market
Issue of measurement error is associated in Economic Surplus
Analysis.
It gives only the gross benefit of any intervention and ignores
the net benefit.
26. Improvement over Economic Surplus Model
Equivalent Variation (EV) - It takes into account the income effect of the price
change.
Econometric Approach - Gives most reliable results
Tools for Computation of Economic Surplus
S. No. Tools Developed By
01. MODEXC International Centre for Tropical Agriculture
(CIAT)
02. RE4 Australian Centre for International Agricultural
Research (ACIAR)
03. Dynamic
Research Evaluation for
Management (DREAM)
International Food Policy Research Institute
(IFPRI)
04. Spreadsheet Approach -------------------------------------
27. Scopes of Using Economic Surplus Model
Ex- Ante Impact Assessment
Feasibility of a research proposal/project; policy
Ex-post Impact Assessment
Economic benefit of policy intervention
Welfare measurement form introduction of new technology
In Agriculture-
• Varietal Impact
• Impact of adoption of new technology
• Impact of research and extension interventions, etc.
28. Case Study- 1 ( Ex-Ante Impact Assessment)
ITEMS PARTICULARS
Year of Publication 2011
Area All over India ( Eastern, Western, Northern, & Southern
regions)
Year of Study 2009
Production Share of
Brinjal in Vegetables
8% (Fourth largest after Potato, Onion, & Tomato)
Major Problem Fruit & Shoot Borer (60-70% Yield losses)
Adoption Level 15% 30% 60%
Methodology Followed
in Impact Analysis
Economic Surplus Model (Open Economy)
Potential Technological
Intervention
Bt. Brinjal
29. REDUCTION IN INSECTICIDE USE AND INCREASE IN FRUIT YIELD
DUE TO Bt BRINJAL HYBRIDS
Results
POTENTIAL ECONOMIC BENEFITS OF Bt BRINJAL CULTIVATION TO
FARMERS AND CONSUMERS UNDER DIFFERENT ADOPTION SCENARIOS
AT ALL-INDIA LEVEL
30. SIMULATED GAINS IN ANNUAL ECONOMIC SURPLUS FROM Bt
BRINJAL CULTIVATION UNDER DIFFERENT SCENARIOS AT
ALL-INDIA LEVEL
Results
31. Case Study- 2 ( Ex-Post Impact Assessment)
ITEMS PARTICULARS
Year of Publication 2012
Area Anantapur, AP
(Drought prone district)
Year of Study 2006-08
Area Under groundnut 819 thousand Ha. (75% of GCA of district) & 15% of GN area
of Country
Rainfall Scenario Deficit rainfall by 35% in June, July % Aug, and 31% deficit in
September
Groundnut Growing
Season
Kharif (July-September)
Rulling Variety TMV 2 (1970- 2005)
Technological
Intervention
ICGV9114 (2002-03)
32. ITEMS PARTICULARS
No. of Respondents 400 (200+200)
Village Covered 49 (out of 68)
Mandal Covered 8
Method of data
Collection
Simple Random Sampling
Duration of data
collection
Five years after introduction of ICGV 91114
Methodology Followed
in Impact Analysis
Economic Surplus Model (Open Economy)
RESULT
Variety TMV 2 ICGV91114
Yield 567 kg/ha 704 kg/ha
Total Revenue 17398 22060
Total Cost 7898 9235
Net Benefits 9500 12825
33. NET PRESENT VALUE OF THE BENEFITS FROM ADOPTION OF
IMPROVED DROUGHT-TOLERANT GROUNDNUT VARIETY ICGV
91114 FOR THE PERIOD 2004-05 TO 2020-21
Results
Make slide attractive as well as add content to it.
Take content from CGIAR file
Make it into bullets and avoid crowding of slide
Check the content of this side once
Research benefits in terms of social gain were computed both for ‘with’ and ‘without’ the
technology and the difference in benefits was attributed to research investment by NATP