Downloaded 129 times
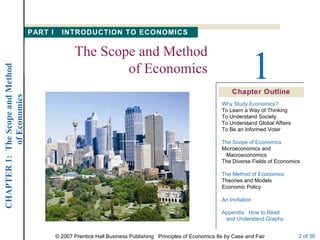
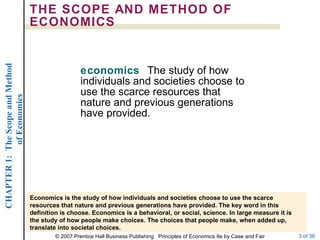
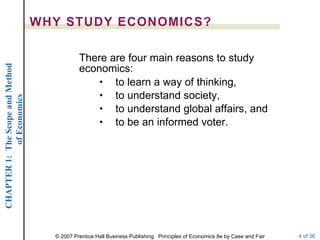
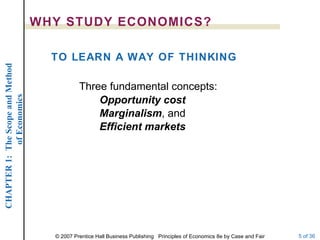

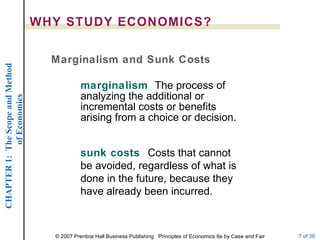


This document provides an overview and introduction to the scope and method of economics. It discusses the following key points in 3 sentences: Economics is the study of how individuals and societies make choices with scarce resources. The document outlines why economics is studied, including to learn a way of thinking, understand society and global affairs, and be an informed voter. It also describes the scope of economics in terms of microeconomics, macroeconomics, and diverse fields, as well as the method which involves theories, models, and empirical testing of economic concepts.