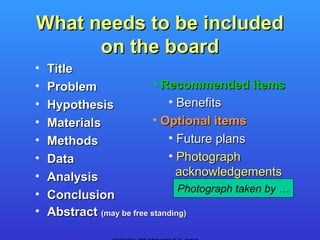
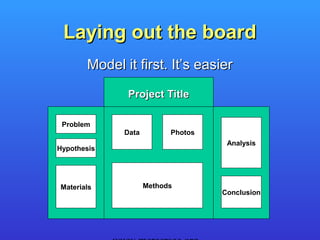
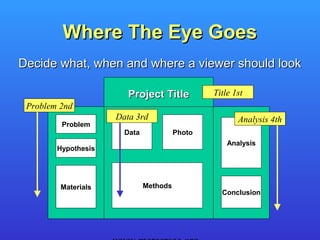
Creating an Effective
Board Presentation


    Mercer Science and Engineering Club
              3 Creek Rim Drive
            Titusville , NJ 08560
Overview
•   The starting point: good research
•   Why is the presentation important
•   What needs to be included
•   Laying out the board
•   Choosing fonts and figures
•   Simplify, simplify, simplify
•   Construction Tips
        KISS (Keep it simple, stupid)
Good Research: It’s a start
• You can’t hide bad research with a
  fancy presentation
• Good research does not sell itself
• Not all details are equally important
• You will know what should be
  presented. It is simply a matter of how.
• A research paper and research
  documents complement a presentation
Why The Presentation Is Important
  • It helps sell your project and results
  • Elementary and Junior Division
    – Entries are judged exclusively on the
      presentation
  • Senior Division
    – Judging includes both the presentation and
      an oral defense
    – The presentation is the backdrop for the
      oral defense
Presentation Components I
• Required
  – Board
  – Abstract (can be on its own stand)
• Recommended
  – Research paper
  – Research documents
  – Detailed results
  – Abstract handouts
Presentation Components II
• Optional
  – Audio/video presentation if it augments the
    static, board presentation
  – Project artifacts if useful for oral presentation
    (senior division)
  – Artifacts built by student (photos recommended)
• Not Recommended
  – Project artifacts not used for oral presentation
  – Tools used for experimentation
What The Presentation Does
• Attracts attention to the project
• Provides the initial introduction to viewers
  of the project (i.e. judges)
• Provides organized overview of the project
• Visual aid when describing a project
• Helps students organize their thoughts
  when describing their project to judges
• A picture is worth a thousand words
Target Your Audience
• Decide who is the target audience
  – Judges, teachers, parents, students
• Design presentation to use terms
  familiar to the target audience
• Explain unfamiliar terms or procedures
• Use drawings and explanations that
  target the audience’s level of
  understanding
Presentation Tells A Story
• The board should speak for itself
• Photos and drawings should enhance
  the story, not the way the presentation
  looks
• The sequence of the story should be
  obvious
What needs to be included
      on the board
•   Title
•   Problem               • Recommended items
•   Hypothesis                • Benefits
•   Materials             • Optional items
•   Methods                   • Future plans
•   Data                      • Photograph
•   Analysis                    acknowledgements
                                 Photograph taken by …
•   Conclusion
•   Abstract (may be free standing)
What NOT to include on the board
 •   Your name
 •   Name or logo of school or affiliation
 •   Sponsors
 •   Photos of identifiable people
     – Remember, it is the experiment that is
       important
     – Caveat: photos relevant to the experiment
       can be included
More on Photos
• Photos of researcher can be included only if
  they are showing something relevant to the
  research that could not be shown otherwise
• No photos showing identifiable people
• Any photographs showing identifiable people,
  other than the student investigator(s), must
  have a signed release form
• No photographs of body parts or tissue,
  except those allowed by ISEF rules
Laying out the board
       Model it first. It’s easier

              Project Title

 Problem
             Data         Photos
                                    Analysis
Hypothesis


Materials           Methods
                                   Conclusion
Where The Eye Goes
Decide what, when and where a viewer should look

                        Project Title           Title 1st
 Problem 2nd
                     Data 3rd                          Analysis 4th
         Problem
                       Data             Photo
                                                    Analysis
        Hypothesis


         Materials            Methods
                                                  Conclusion
Choosing fonts and figures
• Dont’s
 – MiXiNg Fφητs IS nφt α gσοδ Iδεa
 – Too many colors are bad

• Do’s
 – Fonts tips
 – Figures and Photos
 – Constructing a complex page
Font Tips I
• Use as few fonts as necessary
• San serif fonts like Arial work best on
  presentations
• Use serif fonts in research paper
• Use fonts like Cooper for titles
• Look for free fonts on Internet (www.1001freefonts.com)
• NEVER USE ALL CAPS
   – It is hard to read
   – Use Bold, Italic or Color instead
Font Tips II
• Use same font and color for similar uses such as
  explanations of the Problem or Conclusion
• Choosing font size
  –   Must be readable from at least 3 feet away
  –   Size should be related to surrounding text
  –   Size should indicate the text’s importance
  –   Titles should not giant while explanations are
      microscopic
Figures and Photos
• Should be viewable from at least 3 feet away
• Figures should be as simple as possible
  –   Use thick, not thin lines
  –   Use colors judiciously
  –   Use legends when necessary
• Scan and print photos
  – Allows captions and acknowledgements to be
    included on same piece of paper
  – Annotations like arrows can be added
Taking Photos
• Take lots of photos of the same thing
  – Choose the best
  – Different angles can eliminate glare and highlight
    aspects of the project
  – Try close ups, multiple items in photo
  – Where does the photo fit in the story
• Scan and edit photos
  – Crop: allows larger images, eliminates extraneous
    details
  – Print and try adjustments: a printed image looks different
    from it viewed on a display
• Digital cameras: Always use highest resolution
Constructing A Page
• KISS – use a single page of paper for
  each item if possible
• Generate pages using a word
  processor, presentation or drawing
  program
• Use color printer to add borders and
  background
• Don’t forget to try landscape page
  orientation
Simplify, simplify, simplify
• KISS – Less is better. Clutter is bad.
• Eliminate redundant or unimportant
  information
• Keep titles and sentences short and
  concise
• Only show figures or photos that help
  explain key points
• Leaves more space for other
  information
Construction Tips I
•   KISS
•   Double sided tape for mounting paper/photos
•   Always use a paper cutter
•   Borders
    – Print borders on paper
    – Use a matte or colored paper to back paper
• Colored board background
    – Highlights items placed on board
    – Buy colored background
    – Spray paint
Construction Tips II
• Maximize white background on paper
  – Minimizes print time and cost
  – Simplifies combining multiple pages
• Use photo matte or glossy paper
  –   Thicker paper, nothing shows through
  –   Works well with double sided tape
  –   Best for photos and figures
• Use same type of paper throughout
  presentation. Differences stand out.
Gotch ya’s
• Always use a spell checker
• Use a grammar checker
• Read the rules !!!
• Catch errors early: get multiple critiques
  from the initial layout design to the final
  product
• Remember the ISEF abstract
Video Presentations
• The board should not require the video
  presentation
• Do not duplicate board contents in presentation
• Video presentation should show something that
  is more easily explained using a movie or
  animation versus a figure or photo
• Do not include video presentation if it is
  unnecessary
• Keep video presentation simple and short
• Video presentation should run automatically
More Suggestions
• Peer review
  – Have students critique boards for extra credit
  – Rate boards on how well they explain a project
  – Use simplified judging forms
• Involve other teachers
  – Make them aware of the projects and goals for
    improving the student’s presentation skills
  – English: effective text descriptions
  – Math and science: methods of presenting data
  – Computer: use of tools to create complex pages
Summary
• Good research means good artifacts (results)
• Presentation is important because it is selling
  your project and its results
• Include all relevant information
• Board layout catches the eye and explains
  the details
• Text and figures must be readable from a
  distance
• Remember KISS but complexity is relative

Creating an effective board presentation

  • 1.
    Creating an Effective BoardPresentation Mercer Science and Engineering Club 3 Creek Rim Drive Titusville , NJ 08560
  • 2.
    Overview • The starting point: good research • Why is the presentation important • What needs to be included • Laying out the board • Choosing fonts and figures • Simplify, simplify, simplify • Construction Tips KISS (Keep it simple, stupid)
  • 3.
    Good Research: It’sa start • You can’t hide bad research with a fancy presentation • Good research does not sell itself • Not all details are equally important • You will know what should be presented. It is simply a matter of how. • A research paper and research documents complement a presentation
  • 4.
    Why The PresentationIs Important • It helps sell your project and results • Elementary and Junior Division – Entries are judged exclusively on the presentation • Senior Division – Judging includes both the presentation and an oral defense – The presentation is the backdrop for the oral defense
  • 5.
    Presentation Components I •Required – Board – Abstract (can be on its own stand) • Recommended – Research paper – Research documents – Detailed results – Abstract handouts
  • 6.
    Presentation Components II •Optional – Audio/video presentation if it augments the static, board presentation – Project artifacts if useful for oral presentation (senior division) – Artifacts built by student (photos recommended) • Not Recommended – Project artifacts not used for oral presentation – Tools used for experimentation
  • 7.
    What The PresentationDoes • Attracts attention to the project • Provides the initial introduction to viewers of the project (i.e. judges) • Provides organized overview of the project • Visual aid when describing a project • Helps students organize their thoughts when describing their project to judges • A picture is worth a thousand words
  • 8.
    Target Your Audience •Decide who is the target audience – Judges, teachers, parents, students • Design presentation to use terms familiar to the target audience • Explain unfamiliar terms or procedures • Use drawings and explanations that target the audience’s level of understanding
  • 9.
    Presentation Tells AStory • The board should speak for itself • Photos and drawings should enhance the story, not the way the presentation looks • The sequence of the story should be obvious
  • 10.
    What needs tobe included on the board • Title • Problem • Recommended items • Hypothesis • Benefits • Materials • Optional items • Methods • Future plans • Data • Photograph • Analysis acknowledgements Photograph taken by … • Conclusion • Abstract (may be free standing)
  • 11.
    What NOT toinclude on the board • Your name • Name or logo of school or affiliation • Sponsors • Photos of identifiable people – Remember, it is the experiment that is important – Caveat: photos relevant to the experiment can be included
  • 12.
    More on Photos •Photos of researcher can be included only if they are showing something relevant to the research that could not be shown otherwise • No photos showing identifiable people • Any photographs showing identifiable people, other than the student investigator(s), must have a signed release form • No photographs of body parts or tissue, except those allowed by ISEF rules
  • 13.
    Laying out theboard Model it first. It’s easier Project Title Problem Data Photos Analysis Hypothesis Materials Methods Conclusion
  • 14.
    Where The EyeGoes Decide what, when and where a viewer should look Project Title Title 1st Problem 2nd Data 3rd Analysis 4th Problem Data Photo Analysis Hypothesis Materials Methods Conclusion
  • 15.
    Choosing fonts andfigures • Dont’s – MiXiNg Fφητs IS nφt α gσοδ Iδεa – Too many colors are bad • Do’s – Fonts tips – Figures and Photos – Constructing a complex page
  • 16.
    Font Tips I •Use as few fonts as necessary • San serif fonts like Arial work best on presentations • Use serif fonts in research paper • Use fonts like Cooper for titles • Look for free fonts on Internet (www.1001freefonts.com) • NEVER USE ALL CAPS – It is hard to read – Use Bold, Italic or Color instead
  • 17.
    Font Tips II •Use same font and color for similar uses such as explanations of the Problem or Conclusion • Choosing font size – Must be readable from at least 3 feet away – Size should be related to surrounding text – Size should indicate the text’s importance – Titles should not giant while explanations are microscopic
  • 18.
    Figures and Photos •Should be viewable from at least 3 feet away • Figures should be as simple as possible – Use thick, not thin lines – Use colors judiciously – Use legends when necessary • Scan and print photos – Allows captions and acknowledgements to be included on same piece of paper – Annotations like arrows can be added
  • 19.
    Taking Photos • Takelots of photos of the same thing – Choose the best – Different angles can eliminate glare and highlight aspects of the project – Try close ups, multiple items in photo – Where does the photo fit in the story • Scan and edit photos – Crop: allows larger images, eliminates extraneous details – Print and try adjustments: a printed image looks different from it viewed on a display • Digital cameras: Always use highest resolution
  • 20.
    Constructing A Page •KISS – use a single page of paper for each item if possible • Generate pages using a word processor, presentation or drawing program • Use color printer to add borders and background • Don’t forget to try landscape page orientation
  • 21.
    Simplify, simplify, simplify •KISS – Less is better. Clutter is bad. • Eliminate redundant or unimportant information • Keep titles and sentences short and concise • Only show figures or photos that help explain key points • Leaves more space for other information
  • 22.
    Construction Tips I • KISS • Double sided tape for mounting paper/photos • Always use a paper cutter • Borders – Print borders on paper – Use a matte or colored paper to back paper • Colored board background – Highlights items placed on board – Buy colored background – Spray paint
  • 23.
    Construction Tips II •Maximize white background on paper – Minimizes print time and cost – Simplifies combining multiple pages • Use photo matte or glossy paper – Thicker paper, nothing shows through – Works well with double sided tape – Best for photos and figures • Use same type of paper throughout presentation. Differences stand out.
  • 24.
    Gotch ya’s • Alwaysuse a spell checker • Use a grammar checker • Read the rules !!! • Catch errors early: get multiple critiques from the initial layout design to the final product • Remember the ISEF abstract
  • 25.
    Video Presentations • Theboard should not require the video presentation • Do not duplicate board contents in presentation • Video presentation should show something that is more easily explained using a movie or animation versus a figure or photo • Do not include video presentation if it is unnecessary • Keep video presentation simple and short • Video presentation should run automatically
  • 26.
    More Suggestions • Peerreview – Have students critique boards for extra credit – Rate boards on how well they explain a project – Use simplified judging forms • Involve other teachers – Make them aware of the projects and goals for improving the student’s presentation skills – English: effective text descriptions – Math and science: methods of presenting data – Computer: use of tools to create complex pages
  • 27.
    Summary • Good researchmeans good artifacts (results) • Presentation is important because it is selling your project and its results • Include all relevant information • Board layout catches the eye and explains the details • Text and figures must be readable from a distance • Remember KISS but complexity is relative