Download as PDF, PPTX

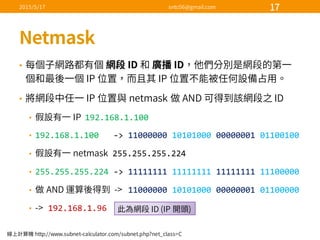
![• /var/log/cron
• cron
Apr 2 09:01:01 localhost run-‐parts(/etc/cron.hourly)[528]: starting 0yum-‐hourly.cron
Apr 2 09:01:01 localhost run-‐parts(/etc/cron.hourly)[544]: finished 0yum-‐hourly.cron](https://image.slidesharecdn.com/2-150517174203-lva1-app6891/85/Linux-8-320.jpg)
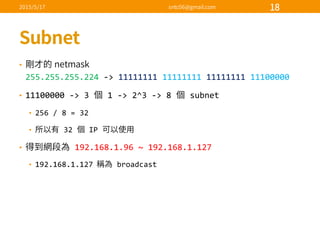
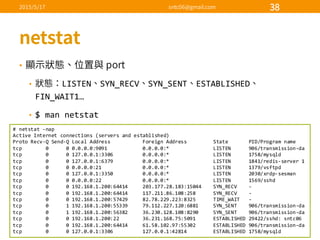
![• /var/log/secure
•
•
Apr 1 16:12:16 localhost login: pam_unix(login:session): session opened for
user root by LOGIN(uid=0)
Apr 1 16:12:16 localhost login: ROOT LOGIN ON tty1
Mar 29 07:43:34 yuki sshd[18247]: pam_unix(sshd:auth): authentication
failure; logname= uid=0 euid=0 tty=ssh ruser= rhost=183.136.216.6
user=root
Mar 29 07:43:36 yuki sshd[18247]: Failed password for root from
183.136.216.6 port 45215 ssh2](https://image.slidesharecdn.com/2-150517174203-lva1-app6891/85/Linux-9-320.jpg)
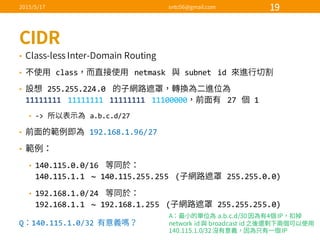
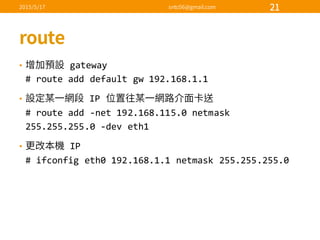
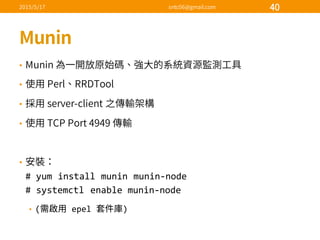
![•
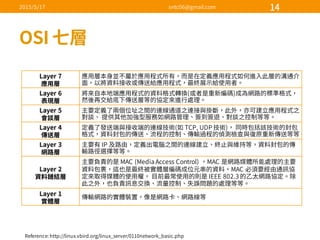
• enp0s8
# tcpdump -‐i enp0s8
• port ASCII
# tcpdump -‐A -‐i enp0s8 'port 21'
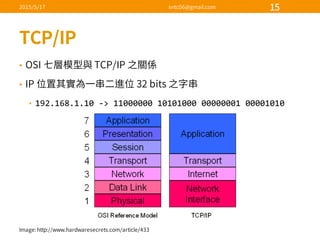
# tcpdump -‐A -‐i enp0s8 'tcp and port 21 and host
192.168.1.1'
22:03:44.870107 IP localhost.localdomain.54068 > adl-‐
12.csie.ncu.edu.tw.http: Flags [P.], seq 1:17, ack 1, win
14600, length 16
E..8..@.@...
....s5..4.P...x.t6.P.9.....GET / HTTP/1.1](https://image.slidesharecdn.com/2-150517174203-lva1-app6891/85/Linux-25-320.jpg)
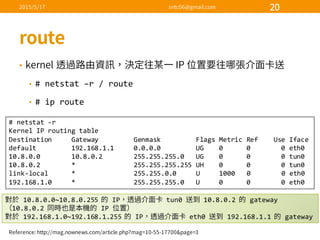
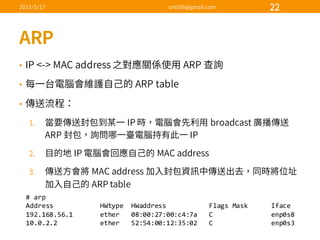
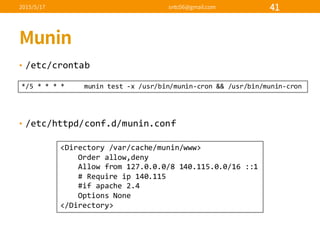
![•
• iostat [ ] [< >[< >]]
• %util
$ iostat -‐d -‐x 1
Device: rrqm/s wrqm/s r/s w/s rkB/s
wkB/s avgrq-‐sz avgqu-‐sz await r_await w_await svctm %util
sda 0.00 0.00 0.00 16.00 0.00
188.00 23.50 0.00 0.00 0.00 0.00 0.00 0.00](https://image.slidesharecdn.com/2-150517174203-lva1-app6891/85/Linux-39-320.jpg)
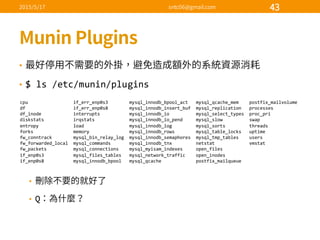
![•
# htpasswd -‐c /etc/munin/munin-‐htpasswd < >
• /etc/munin/munin.conf
[local.example.com]
address 127.0.0.1
use_node_name yes](https://image.slidesharecdn.com/2-150517174203-lva1-app6891/85/Linux-42-320.jpg)

- The document discusses various Linux system log files such as /var/log/messages, /var/log/secure, and /var/log/cron and provides examples of log entries. - It also covers log rotation tools like logrotate and logwatch that are used to manage log files. - Networking topics like IP addressing, subnet masking, routing, ARP, and tcpdump for packet sniffing are explained along with examples.