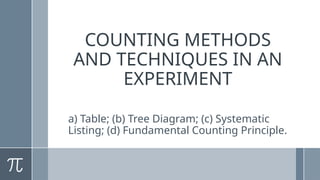
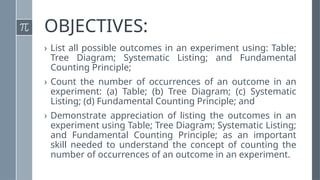
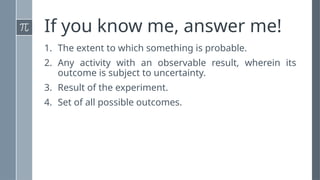
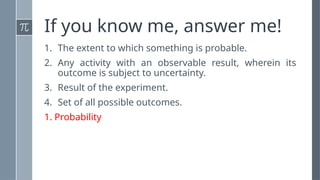
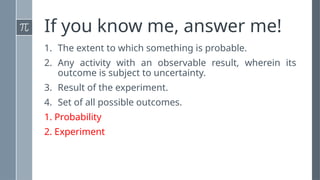
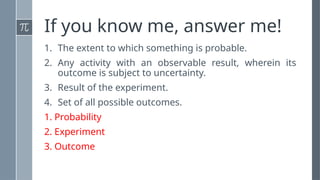
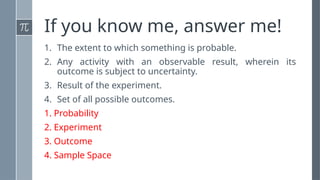
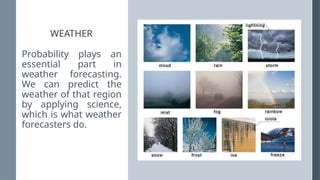
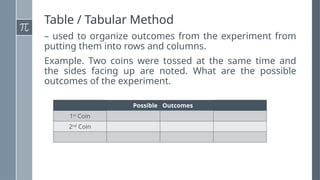
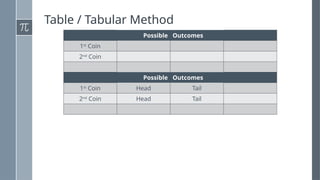
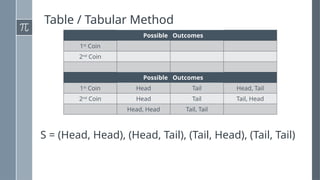
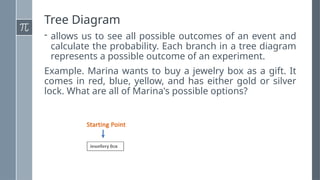
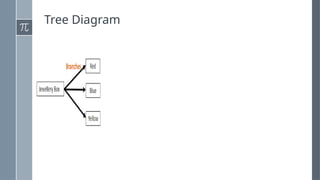
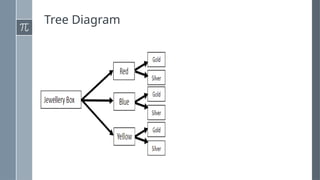
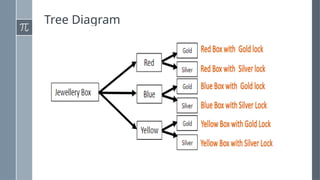
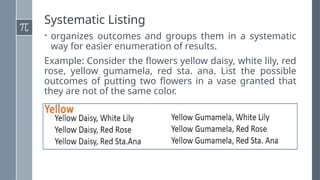
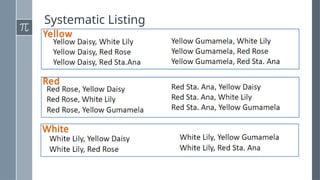
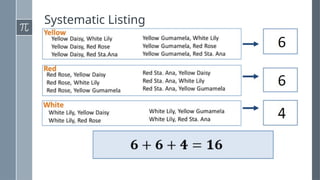
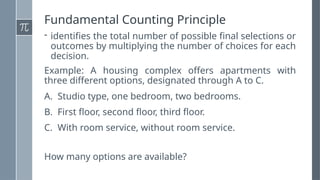
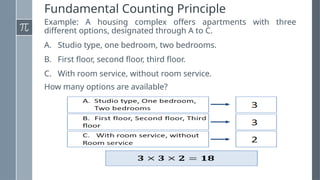
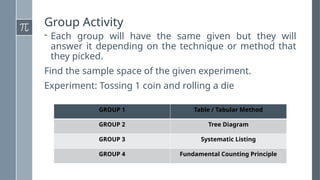
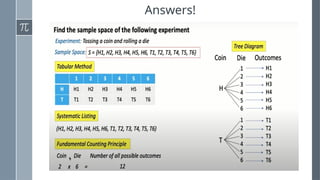
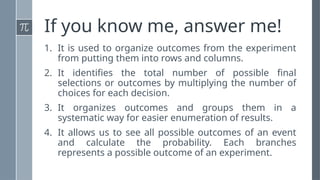
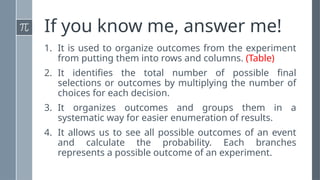
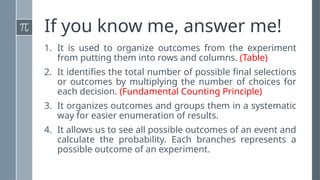
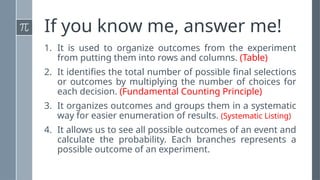
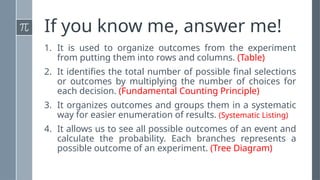
COUNTING METHODS
AND TECHNIQUES IN AN
EXPERIMENT
a) Table; (b) Tree Diagram; (c) Systematic
Listing; (d) Fundamental Counting Principle.
OBJECTIVES:
› List all possible outcomes in an experiment using: Table;
Tree Diagram; Systematic Listing; and Fundamental
Counting Principle;
› Count the number of occurrences of an outcome in an
experiment: (a) Table; (b) Tree Diagram; (c) Systematic
Listing; (d) Fundamental Counting Principle; and
› Demonstrate appreciation of listing the outcomes in an
experiment using Table; Tree Diagram; Systematic Listing;
and Fundamental Counting Principle; as an important
skill needed to understand the concept of counting the
number of occurrences of an outcome in an experiment.
If you know me, answer me!
1. The extent to which something is probable.
2. Any activity with an observable result, wherein its
outcome is subject to uncertainty.
3. Result of the experiment.
4. Set of all possible outcomes.
If you know me, answer me!
1. The extent to which something is probable.
2. Any activity with an observable result, wherein its
outcome is subject to uncertainty.
3. Result of the experiment.
4. Set of all possible outcomes.
1. Probability
If you know me, answer me!
1. The extent to which something is probable.
2. Any activity with an observable result, wherein its
outcome is subject to uncertainty.
3. Result of the experiment.
4. Set of all possible outcomes.
1. Probability
2. Experiment
If you know me, answer me!
1. The extent to which something is probable.
2. Any activity with an observable result, wherein its
outcome is subject to uncertainty.
3. Result of the experiment.
4. Set of all possible outcomes.
1. Probability
2. Experiment
3. Outcome
If you know me, answer me!
1. The extent to which something is probable.
2. Any activity with an observable result, wherein its
outcome is subject to uncertainty.
3. Result of the experiment.
4. Set of all possible outcomes.
1. Probability
2. Experiment
3. Outcome
4. Sample Space
WHAT CAN YOU SEE
IN THE PICTURE?
WHAT CAN YOU SEE
IN THE PICTURE?
WEATHER
WEATHER
Probability plays an
essential part in
weather forecasting.
We can predict the
weather of that region
by applying science,
which is what weather
forecasters do.
COUNTING METHODS AND
TECHNIQUES IN AN EXPERIMENT
A.Table
B.Tree Diagram
C.Systematic Listing
D.The Fundamental Counting Principle
Table / Tabular Method
– used to organize outcomes from the experiment from
putting them into rows and columns.
Example. Two coins were tossed at the same time and
the sides facing up are noted. What are the possible
outcomes of the experiment.
Possible Outcomes
1st
Coin
2nd
Coin
Table / Tabular Method
Possible Outcomes
1st
Coin
2nd
Coin
Table / Tabular Method
Possible Outcomes
1st
Coin
2nd
Coin
Possible Outcomes
1st
Coin Head Tail
2nd
Coin Head Tail
Table / Tabular Method
Possible Outcomes
1st
Coin
2nd
Coin
Possible Outcomes
1st
Coin Head Tail Head, Tail
2nd
Coin Head Tail Tail, Head
Head, Head Tail, Tail
S = (Head, Head), (Head, Tail), (Tail, Head), (Tail, Tail)
Tree Diagram
- allows us to see all possible outcomes of an event and
calculate the probability. Each branch in a tree diagram
represents a possible outcome of an experiment.
Example. Marina wants to buy a jewelry box as a gift. It
comes in red, blue, yellow, and has either gold or silver
lock. What are all of Marina's possible options?
Tree Diagram
Tree Diagram
Tree Diagram
Tree Diagram
Systematic Listing
- organizes outcomes and groups them in a systematic
way for easier enumeration of results.
Example: Consider the flowers yellow daisy, white lily, red
rose, yellow gumamela, red sta. ana. List the possible
outcomes of putting two flowers in a vase granted that
they are not of the same color.
Systematic Listing
Systematic Listing
Fundamental Counting Principle
- identifies the total number of possible final selections or
outcomes by multiplying the number of choices for each
decision.
Example: A housing complex offers apartments with
three different options, designated through A to C.
A. Studio type, one bedroom, two bedrooms.
B. First floor, second floor, third floor.
C. With room service, without room service.
How many options are available?
Fundamental Counting Principle
Example: A housing complex offers apartments with three
different options, designated through A to C.
A. Studio type, one bedroom, two bedrooms.
B. First floor, second floor, third floor.
C. With room service, without room service.
How many options are available?
Group Activity
- Each group will have the same given but they will
answer it depending on the technique or method that
they picked.
Find the sample space of the given experiment.
Experiment: Tossing 1 coin and rolling a die
GROUP 1 Table / Tabular Method
GROUP 2 Tree Diagram
GROUP 3 Systematic Listing
GROUP 4 Fundamental Counting Principle
Answers!
If you know me, answer me!
1. It is used to organize outcomes from the experiment
from putting them into rows and columns.
2. It identifies the total number of possible final
selections or outcomes by multiplying the number of
choices for each decision.
3. It organizes outcomes and groups them in a
systematic way for easier enumeration of results.
4. It allows us to see all possible outcomes of an event
and calculate the probability. Each branches
represents a possible outcome of an experiment.
If you know me, answer me!
1. It is used to organize outcomes from the experiment
from putting them into rows and columns. (Table)
2. It identifies the total number of possible final selections
or outcomes by multiplying the number of choices for
each decision. (Fundamental Counting Principle)
3. It organizes outcomes and groups them in a systematic
way for easier enumeration of results.
4. It allows us to see all possible outcomes of an event and
calculate the probability. Each branches represents a
possible outcome of an experiment.
If you know me, answer me!
1. It is used to organize outcomes from the experiment
from putting them into rows and columns. (Table)
2. It identifies the total number of possible final selections
or outcomes by multiplying the number of choices for
each decision. (Fundamental Counting Principle)
3. It organizes outcomes and groups them in a systematic
way for easier enumeration of results. (Systematic Listing)
4. It allows us to see all possible outcomes of an event and
calculate the probability. Each branches represents a
possible outcome of an experiment. (Tree Diagram)
Thank you for listening!

COUNTING METHODS AND TECHNIQUES IN AN EXPERIMENT.pptx

  • 1.
    COUNTING METHODS AND TECHNIQUESIN AN EXPERIMENT a) Table; (b) Tree Diagram; (c) Systematic Listing; (d) Fundamental Counting Principle.
  • 2.
    OBJECTIVES: › List allpossible outcomes in an experiment using: Table; Tree Diagram; Systematic Listing; and Fundamental Counting Principle; › Count the number of occurrences of an outcome in an experiment: (a) Table; (b) Tree Diagram; (c) Systematic Listing; (d) Fundamental Counting Principle; and › Demonstrate appreciation of listing the outcomes in an experiment using Table; Tree Diagram; Systematic Listing; and Fundamental Counting Principle; as an important skill needed to understand the concept of counting the number of occurrences of an outcome in an experiment.
  • 3.
    If you knowme, answer me!
  • 4.
    If you knowme, answer me! 1. The extent to which something is probable. 2. Any activity with an observable result, wherein its outcome is subject to uncertainty. 3. Result of the experiment. 4. Set of all possible outcomes.
  • 5.
    If you knowme, answer me! 1. The extent to which something is probable. 2. Any activity with an observable result, wherein its outcome is subject to uncertainty. 3. Result of the experiment. 4. Set of all possible outcomes. 1. Probability
  • 6.
    If you knowme, answer me! 1. The extent to which something is probable. 2. Any activity with an observable result, wherein its outcome is subject to uncertainty. 3. Result of the experiment. 4. Set of all possible outcomes. 1. Probability 2. Experiment
  • 7.
    If you knowme, answer me! 1. The extent to which something is probable. 2. Any activity with an observable result, wherein its outcome is subject to uncertainty. 3. Result of the experiment. 4. Set of all possible outcomes. 1. Probability 2. Experiment 3. Outcome
  • 8.
    If you knowme, answer me! 1. The extent to which something is probable. 2. Any activity with an observable result, wherein its outcome is subject to uncertainty. 3. Result of the experiment. 4. Set of all possible outcomes. 1. Probability 2. Experiment 3. Outcome 4. Sample Space
  • 9.
    WHAT CAN YOUSEE IN THE PICTURE?
  • 10.
    WHAT CAN YOUSEE IN THE PICTURE? WEATHER
  • 11.
    WEATHER Probability plays an essentialpart in weather forecasting. We can predict the weather of that region by applying science, which is what weather forecasters do.
  • 12.
    COUNTING METHODS AND TECHNIQUESIN AN EXPERIMENT A.Table B.Tree Diagram C.Systematic Listing D.The Fundamental Counting Principle
  • 13.
    Table / TabularMethod – used to organize outcomes from the experiment from putting them into rows and columns. Example. Two coins were tossed at the same time and the sides facing up are noted. What are the possible outcomes of the experiment. Possible Outcomes 1st Coin 2nd Coin
  • 14.
    Table / TabularMethod Possible Outcomes 1st Coin 2nd Coin
  • 15.
    Table / TabularMethod Possible Outcomes 1st Coin 2nd Coin Possible Outcomes 1st Coin Head Tail 2nd Coin Head Tail
  • 16.
    Table / TabularMethod Possible Outcomes 1st Coin 2nd Coin Possible Outcomes 1st Coin Head Tail Head, Tail 2nd Coin Head Tail Tail, Head Head, Head Tail, Tail S = (Head, Head), (Head, Tail), (Tail, Head), (Tail, Tail)
  • 17.
    Tree Diagram - allowsus to see all possible outcomes of an event and calculate the probability. Each branch in a tree diagram represents a possible outcome of an experiment. Example. Marina wants to buy a jewelry box as a gift. It comes in red, blue, yellow, and has either gold or silver lock. What are all of Marina's possible options?
  • 18.
  • 19.
  • 20.
  • 21.
  • 22.
    Systematic Listing - organizesoutcomes and groups them in a systematic way for easier enumeration of results. Example: Consider the flowers yellow daisy, white lily, red rose, yellow gumamela, red sta. ana. List the possible outcomes of putting two flowers in a vase granted that they are not of the same color.
  • 23.
  • 24.
  • 25.
    Fundamental Counting Principle -identifies the total number of possible final selections or outcomes by multiplying the number of choices for each decision. Example: A housing complex offers apartments with three different options, designated through A to C. A. Studio type, one bedroom, two bedrooms. B. First floor, second floor, third floor. C. With room service, without room service. How many options are available?
  • 26.
    Fundamental Counting Principle Example:A housing complex offers apartments with three different options, designated through A to C. A. Studio type, one bedroom, two bedrooms. B. First floor, second floor, third floor. C. With room service, without room service. How many options are available?
  • 27.
    Group Activity - Eachgroup will have the same given but they will answer it depending on the technique or method that they picked. Find the sample space of the given experiment. Experiment: Tossing 1 coin and rolling a die GROUP 1 Table / Tabular Method GROUP 2 Tree Diagram GROUP 3 Systematic Listing GROUP 4 Fundamental Counting Principle
  • 28.
  • 29.
    If you knowme, answer me! 1. It is used to organize outcomes from the experiment from putting them into rows and columns. 2. It identifies the total number of possible final selections or outcomes by multiplying the number of choices for each decision. 3. It organizes outcomes and groups them in a systematic way for easier enumeration of results. 4. It allows us to see all possible outcomes of an event and calculate the probability. Each branches represents a possible outcome of an experiment.
  • 30.
    If you knowme, answer me! 1. It is used to organize outcomes from the experiment from putting them into rows and columns. (Table) 2. It identifies the total number of possible final selections or outcomes by multiplying the number of choices for each decision. 3. It organizes outcomes and groups them in a systematic way for easier enumeration of results. 4. It allows us to see all possible outcomes of an event and calculate the probability. Each branches represents a possible outcome of an experiment.
  • 31.
    If you knowme, answer me! 1. It is used to organize outcomes from the experiment from putting them into rows and columns. (Table) 2. It identifies the total number of possible final selections or outcomes by multiplying the number of choices for each decision. (Fundamental Counting Principle) 3. It organizes outcomes and groups them in a systematic way for easier enumeration of results. 4. It allows us to see all possible outcomes of an event and calculate the probability. Each branches represents a possible outcome of an experiment.
  • 32.
    If you knowme, answer me! 1. It is used to organize outcomes from the experiment from putting them into rows and columns. (Table) 2. It identifies the total number of possible final selections or outcomes by multiplying the number of choices for each decision. (Fundamental Counting Principle) 3. It organizes outcomes and groups them in a systematic way for easier enumeration of results. (Systematic Listing) 4. It allows us to see all possible outcomes of an event and calculate the probability. Each branches represents a possible outcome of an experiment.
  • 33.
    If you knowme, answer me! 1. It is used to organize outcomes from the experiment from putting them into rows and columns. (Table) 2. It identifies the total number of possible final selections or outcomes by multiplying the number of choices for each decision. (Fundamental Counting Principle) 3. It organizes outcomes and groups them in a systematic way for easier enumeration of results. (Systematic Listing) 4. It allows us to see all possible outcomes of an event and calculate the probability. Each branches represents a possible outcome of an experiment. (Tree Diagram)
  • 36.
    Thank you forlistening!