CoreLogic head of research Tim Lawless said, “Although housing values were generally slightly positive over the month, the trend has clearly weakened since mid-to-late March, when social distancing policies were implemented and consumer sentiment started to plummet.”
The capital city markets generally showed a weaker performance relative to the regional markets, with the combined capital cities index up 0.2% in April compared with a 0.5% rise across the combined regional markets.
Australian housing values finished the year 3.0% higher according to data released by @corelogicau today. The growth rate for regional housing values (+6.9%) was more than three times higher than the pace of growth across the capital cities (+2.0%)
The national monthly increase of 1.3% is the slowest rate of growth since January 2021 when values rose 0.9%. The annual increase of 22.2% has added approximately $126,700 to the median value of an Australian home in the last 12 months.
Beyond the headline figure, capital city and regional home values are diversifying as stock levels rise and affordability decreases. Houses continue to outperform units, regional markets and rental growth remain strong and a rise in listings is contributing to a subtle softening in vendor metrics such as days on market and auction clearance rates.
Will it be a hot, warm or cool summer for the market?
July 2013's Monthly Indicators report - Boston Real Estate Market TrendsUnit Realty Group
Here's July 2013's Monthly Indicators report from the Greater Boston Association of Realtors.
What's going on in the Boston real estate market?
• July volume of closed sales (all property types) UP +17.2% over July, 2012
• July single-family market median sales price UP 4.5% over July, 2012
• July condo market median sales price UP 4% over July, 2012
U.S. Housing Market Overview, September 2021Nima Wedlake
Key economic indicators in America’s residential real estate market, including mortgage origination volume, housing supply, credit availability and real estate pricing trends.
The Federal Government has spent almost $32 billion on cybersecurity-related expenditures in the past 10 years. More importantly, the cyber spending boom shows no sign of slowing, as spending increased 281 percent from 2006 to 2014 (an average of 22 percent annually). This historic growth in cyber spending runs counter to the greater trend in Federal Government spending that has led to a relatively modest increase of 4.2 percent annually over the same time period.
As the world becomes increasingly digitized, so has the Federal Government, but individual agencies are not spending on cybersecurity in similar ways. Each agency's funding over the past 10 years tells a unique story.
CoreLogic August 2016 Home Value Index
Released: Thursday 1 September, 2016
The CoreLogic Home Value Index recorded a 1.1% rise in dwelling values in August, with six of the eight capital cities recording a lift in dwelling values over the month.
• Dwelling values in Sydney and Melbourne continued to increase at more than 1% month-on-month
Perth and Darwin remain as the only capital cities to record a fall in dwelling values over the most recent twelve month period, declining by 4.2% in both cities.
Mercer Capital's Value Focus: Construction and Building Materials | Q1 2018 |...Mercer Capital
Mercer Capital's Construction Industry newsletter provides a broad range of specialized valuation and transaction advisory services to the construction industry, including residential, commercial, civil, paving, concrete, and more. Each issue includes a segment focus, market overview, mergers and acquisitions review, and more.
The purpose of this presentation is to provide an overview of the U.S. residential housing market for the second quarter of 2018. An overview of the State of the Nation's Housing by the Joint Center for Housing Studies of Harvard University is covered in this presentation.
2017 Q1 - U.S. Residential Housing Marketing ReviewTroy Adkins
The purpose of this presentation is to provide an overview of the events and trends that transpired in the U.S. residential housing market for during the first quarter of 2017, and to provide an overview of the top five over-priced cities and under-priced cities that make up the Adkins 60-City Home Price Index.
Overview:
Regional economy on the rebound:
- New York City, Long Island on a solid growth trajectory
- New Jersey, Upstate New York, Fairfield County growing moderately
- Puerto Rico appears to be back in a downturn
Update on sectors that have lagged:
- State & local government job cuts continue in some but not all of the region
New York City’s brisk recovery continues to get little help from Wall St.
Construction & housing had weighed down recovery but are now reviving
San Jose's Job & Population Trends through 2040guest76bced
This presentation details the population and job growth projections prepared by CCSCE (Center for the Continuing Study of the California Economy). The information was presented to the Envision San Jose 2040 General Plan Update Task Force at their May 27, 2008 meeting.
Arbor Small Multifamily Report Q1 2020Ivan Kaufman
The nation’s rental market has a total of 41.9 million renter-occupied housing units as of 2018, according to the U.S. Census Bureau’s latest American Community Survey. Small multifamily, which includes apartment properties of 5 to 49 units, represented 33% (13.7 million units) of the total rental market.
Saratoga County Manufacturing Economic Index 4.17.19JenniferKelley47
Takeaways from the Saratoga County Manufacturing Index include:
• Manufacturing is the fourth-largest private-sector employer in Saratoga County, representing 11 percent of total employment.
• The semiconductor industry (2,599 jobs) is the leading manufacturing employer, followed by chemicals (1,278), printing (890), paper (518) and fabricated metals (501)
• Nearly half of manufacturing jobs in Saratoga County – 3,678 – are directly supported by exports
• Statewide, the biggest exported NY products by percentage are miscellaneous manufactured commodities (39), followed by semiconductor (12), primary metals (9) and chemicals (9)
• Statewide, the leading foreign countries that receive exported NY products by percentage are Canada (14), Hong Kong (12), Israel (8), the United Kingdom (7) and Switzerland (7)
This report examines the issue of housing affordability in Malaysia, viewing it within the context of housing as an economic sector rather than simply as a social welfare concern.
Housing interventions have focused primarily on demand, and in doing so subsidises a non-responsive supply sector. We examine housing affordability with the view of ensuring that supply is able to meet effective demand, thus improving the affordability of housing in general.
These are the slides presented at The Greater London Authority , London for the Economic Forum on Thursday 24 October 2019 to provide delegates an understanding of regional statistics.
The Quarterly Australian Residential Property Market and Economy Report, released May 2016
CoreLogic has just released the Australian Residential Property Market and Economy Report for Q1 2016.
January marked a new record for how much and how fast dwelling
values have fallen in Australia. Based on the monthly index, the
national HVI is down -8.9% since peaking in April last year, making this
the largest and fastest decline in values since at least 1980 when
CoreLogic’s records began.
So far, Brisbane (-10.8%*
) and Hobart (-10.8%) have registered the
largest declines on record for those cities. Sydney home values are down
-13.8% and not far from surpassing the 2017-19 drop of -14.9% to set a
new decline record.
Via Corelogic RPData
2022 was a tumultuous year for Australia’s housing market.
Following outstanding capital growth over 2021 and into early 2022, successive interest rate rises, surging inflation, low consumer sentiment and deteriorating affordability drove a shift in the performance of residential real estate.
Today, we released our annual Best of the Best report; a seminal publication which sums up the country’s annual property performance and provides an outlook for the year ahead.
The Australian Residential Property
Market and Economy
► Brisbane’s annual value growth has slowed from
+2.8% a year ago to +1.1% over the past year.
House values have risen by +1.2% over the past
year and unit values are +0.7% higher.
Capital city dwelling values increase by 1.0% in September
The latest CoreLogic Hedonic Home Value Index reveals further gains across most capital city housing markets last month, taking the current growth phase into its 52nd month.
CoreLogic Research Director, Tim Lawless, noted the most
substantial reduction in growth has occurred in Sydney.
“After leading the upswing, the monthly pace of growth in Sydney
housing values has halved from a recent high of 1.8% in May to 0.9%
in July. Sydney has also seen a significant rise in the number of
fresh listings added to the market, 9.9% higher than the same time
last year and 18.0% above the previous five-year average. An
increased flow of new listings provides more choice and may be
working to reduce some of the urgency felt among prospective
buyers,” he said.
Brisbane and Adelaide saw the monthly pace of growth
accelerate in July, leading the pace of gains across the capitals
with housing values up 1.4% across both cities. Although the trend
in new listings has risen in these cities, Mr Lawless said the number
remains well below levels from a year ago and the previous five
year average.
Canberra was the only capital city to record a decline in values in
July, down -0.1%, while Hobart values were unchanged.
The slowdown in value growth has mostly been driven by an
easing in gains across the upper quartile of the market.
CoreLogic December 2016 Hedonic Home Value Index
Released: Tuesday 3 January, 2017
Capital gains accelerated over the past year, taking the calendar year growth rate to the fastest pace since 2009, according to the December CoreLogic Home Value Index.
• December 2016 saw capital city dwelling values rise by 1.4%, taking the annual capital gain for 2016 to 10.9%
• Capital city house values rose by 11.6% over the past 12 months
Capital city unit values increased by 5.9% over the past 12 months
The strongest capital city sub-regions were confined to Hobart,
Canberra, Brisbane and Adelaide where housing prices are generally
more affordable relative to household incomes (although housing
affordability has rapidly deteriorated across Hobart). Outside of Hobart,
where dwelling values were 8.7% higher over the year, even the best
performing regions returned a relatively mild annual growth rate. Seven
of the top ten sub-regions returned an annual gain of less than 3%. Mr
Lawless said, “Such a soft result amongst the best performing areas
highlights that housing market weakness is broad-based and not just
confined to Sydney and Melbourne.”
Australia's home prices likely rose at a slightly faster pace in August (+1%) compared with July (+0.8%), based on CoreLogic's daily 5 capital city index. Brisbane (inc Gold Coast) prices are up 1.4% with Sydney and Adelaide prices both 1.1% higher.
Adelaide and Perth are the only capital cities at new highs, Brisbane is still below it's high in March 2022 based on this data (which includes the Gold Coast), though on the ground in Brisbane we are seeing data points of new all time highs in our target areas.
• The May home value results should be viewed in the context of demonstrated seasonality; values have fallen during May in four of the past five years
• Reading through the seasonality indicates that value growth in the market has lost momentum, particularly in Sydney and Melbourne where affordability constraints are more evident and investors have comprised a larger proportion of housing demand
Dwelling values rose by 1.1% over the month of December and by 4.0% over the quarter to finish out 2019 on a positive note according to the CoreLogic national home value index. This result represents the fastest rate of national dwelling value growth over any three month period since November 2009. Darwin was the only region amongst the capital cities and ‘rest-of-state’ areas to record a fall in values over the month, with a -0.5% decline
Brisbane (1.4%)
CoreLogic’s national Home Value Index (HVI) has recorded a third consecutive monthly rise, with the pace of growth accelerating sharply to 1.2% in May.
After finding a floor in February, home values increased 0.6% and 0.5% through March and April respectively.
Sydney continues to lead the recovery trend, posting a 1.8% lift in values over the month, recording the city’s highest monthly gain since September 2021. Since moving through a trough in January, home values have risen by 4.8%, or the equivalent of a $48,390 lift in the median dwelling value.
Brisbane (1.4%) and Perth (1.3%) are the only other capitals to record a monthly gain of more than 1.0%, however, the rise in values was broad-based with the rate of growth accelerating across every capital city last month.
CoreLogic’s Research Director, Tim Lawless, noted the positive trend is a symptom of persistently low levels of available housing supply running up against rising housing demand.
“Advertised listings trended lower through May with roughly 1,800 fewer capital city homes advertised for sale relative to the end of April. Inventory levels are -15.3% lower than they were at the same time last year and -24.4% below the previous five-year average for this time of year,” he said.
“With such a short supply of available housing stock, buyers are becoming more competitive and there’s an element of FOMO creeping into the market. Amid increased competition, auction clearance rates have trended higher, holding at 70% or above over the past three weeks. For private treaty sales, homes are selling faster and with less vendor discounting.”
The trend in regional housing values has also picked up, with the combined regionals index rising half a percent in April, following a 0.2% and 0.1% rise in March and April.
“Although regional home values are trending higher, the rate of gain hasn’t kept pace with the capitals. Over the past three months, growth in the combined capitals index was more than triple the pace of growth seen across the combined regionals at 2.8% and 0.8% respectively,” Mr Lawless said.
“Although advertised housing supply remains tight across regional Australia, demand from net overseas migration is less substantial. ABS data points to around 15% of Australia’s net overseas migration being centered in the regions each year. Additionally, a slowdown in internal migration rates across the regions has helped to ease the demand side pressures on housing.”
Premium housing markets in Sydney continue to lead the recovery trend. After recording a larger drop in values, Sydney’s upper quartile (the most expensive quarter) stands out with the highest rate of growth, gaining 5.6% over the past three months compared with a 2.6% rise in more affordable lower quartile values.
“Buyers targeting the premium sector of the market are still buying at well below peak prices,” Mr Lawless said.
“Although values across more expensive homes are rising more rapidly, ......
Autumn Buyers Guide
Do your property buying research without having to spend your whole weekend searching the web. This reference guide for home buyers and investors from ING Direct will quickly bring you up to speed on house and unit prices and suburb affordability across Australia.
The Australian Residential Property Market & Economy: Quarterly Review, May 2015
Take a look at a comprehensive Australian housing market overview put together by CoreLogic RP Data.
The CoreLogic Home Value Index results for October out today confirm a 1.2% rise in national dwelling values over the month, delivering the fourth straight month of rising values.
The October result was the largest month-on-month gain in the national index since May 2015. The recent gains come after a broad-based decline in housing values, with the national index declining 8.4% between October 2017 and June 2019. The positive October result takes national dwelling values 2.9% off their June 2019 floor, however values remain 5.7% below their peak, highlighting that despite the recent gains, home values are at a similar level to where they were three years ago.
According to CoreLogic research director Tim Lawless, the stronger rebound in Melbourne and Sydney can be attributed to a blend of factors; tighter labour market conditions and stronger population growth relative to the other capitals, coupled with the stimulatory effect of the lowest mortgage rates since the 1950’s, and improved access to credit.
• The divergence between dwelling values and income growth occurred against a backdrop of lower mortgage rates, and
• Australian’s generally demonstrate a high elasticity of demand for housing, with lower mortgage rates driving high levels of demand contributing to higher housing values.
The third edition of the CoreLogic
Women and Property report provides
an update to the state of home
ownership for men and women across
Australia and New Zealand as of
January 2023.
Best Regards,
Linda 姬琳达珍 and Carlos Debello (LREA)
LJ Gilland Real Estate Pty Ltd
Debello LREA推荐书LJ Gilland房地产
http://ljgrealestate.com.au/testimonials/
Foreign nationals bought up more than $55.8 billion worth of Australian property during the last financial year, down 33% as the pandemic shut the country’s borders.
The Foreign Investment Board’s annual report shows property approvals were down again, having almost halved in the space of just four years.
The report shows Chinese investment was up 16% over the same period, while Queensland is quickly becoming a “top destination” for foreign investment.
According to a variety of reported opinions, it’s Brisbane’s time to shine. The city has seen a stop- start-stagnate property market for close to a decade, with myriad factors (floods, unit oversupply, high unemployment, global pandemic) keeping our values
Our Sunshine State capital is looking even brighter as at the time of writing. While we’ve had our challenges during COVID-19 (particularly in recent weeks when a few dubious border crossings have left our population holding its collective breath……………
“The blowout in rental vacancy rates for the major CBDs suggests a mass exodus of tenants occurred over the course of March and April. This might be attributed to the significant loss in employment in our CBDs plus the drop off in international students,” he said.
Brisbane and Adelaide both saw their CBD vacancy rate double as well, albeit from smaller bases, jumping to 11.3% and 6.6% apiece.
Looking at the capital city markets as a whole, Darwin proved the only exception to rising rates across the board.
View the COVID-19 V Australian Property Report here. At a Glance:
Even with the impact of COVID-19, the experts most commonly believe in 12 months prices will be higher than they are now (27 percent of respondents).
Overwhelmingly, (72 percent) of respondents, felt that NSW would be the hardest hit.
Short Term residential rental properties, like AIRBNB and holiday homes, are in the firing line, whilst high cashflow and diversified rooming houses on fixed-term leases are highlighted as the most resilient.
Respondents said the peak COVID-19 impact would be felt between the 3 to 12-month mark from mid-March 2020
Valuing experts explore what buyers are looking for in each housing market. This is especially useful knowledge as the market establishes its direction for 2020.
FHB -6.8%
NON FHB -14%
INVESTOR'S -25.5%
Residential property market analysis
Inside these pages, you’ll find expert commentary about the market and its drivers.
The centrepiece of the report is the three-year forecasts of our capital city house and
unit prices. We also delve into the shape of our market in regional Australia.
This year our Spotlight feature “High-density missing the mark?” examines whether
medium and high-density dwellings are a positive outcome for the residential property
market and housing affordability.
Forecasts of potential 20% growth in Brisbane’s house prices, HTW have released their annual where to invest $500,000 in property, many of the middle ring of Brisbane suburbs.
HTW June report with Federal elections, finance challenges, infrastructure, industry and employment – all playing their part in this month’s submissions.
Australia’s central bank will be compelled to drop the already record-low official cash rate to 0.5 per cent within the next two years, an economist has claimed.
Speaking on a panel at NAB’s Federal Budget Analysis event on Wednesday (3 April), Jonathan Pain, economist and author of The Pain Report, said he expects the Reserve Bank of Australia (RBA) to cut the official cash rate four times in the next two years to a new record low of 0.5 per cent.
“I think the Reserve Bank is going to cut rates as soon as this election is out of the way. If we didn’t have this election in May, I think the Reserve Bank would have already been cutting rates,” Mr Pain said.
The reason the economist and author believes the RBA will decrease the cash rate by 1 percentage point (from 1.5 per cent to 0.5 per cent) is because it is unlikely that the banks would pass on the central bank’s entire rate cut to their customers.
“I’m saying 1 per cent because the banks will arguably only pass on about 60 to 65 per cent of that,” Mr Pain said.
“Don’t forget, last time they didn’t pass it on for a range of reasons. Banks always want to protect their margins.”
NAB’s chief economist of markets, Ivan Colhoun, who was on the same panel, said he believes customers would be the beneficiaries of a reduced cash rate, noting that the “minor interest rate increases” seen last year was because “funding pressures moved against the banks”, forcing them to raise their rates.
“Those pressures have been coming off recently,” Mr Colhoun said, noting that this could change.
Meanwhile, NAB is anticipating two RBA cash rate cuts by the end of 2019 to 1 per cent – a view that was expressed by a number of industry pundits.
Mr Colhoun even said a rate drop could be seen as early as next month in the lead up to the federal election.
“If they don’t cut, I think the unemployment would begin to move up,” the chief economist said.
However, he implied it might be too early to tell whether there would be any further rate cuts next year.
“If the economy turned out weaker, then the RBA would keep cutting,” Mr Colhoun said, noting that NAB’s outlook is based on the assumption that the economy would continue growing at a “reasonable” pace.
Both Mr Pain and Mr Colhoun agreed on the importance of the cash rate, which some leaders had previously lamented lost significance as it had not deterred lenders from lifting their interest rates out of cycle from late last year.
“Does it matter? Absolutely, because the majority of our mortgages in Australia are of the variable rate nature, floating rate nature. Whereas in the United States, for example, most of them are on fixed rates.
“What the cash rate setting the Reserve Bank has is very important for us from a business perspective and from a mortgage perspective.”
North Lakes appeared as one of the most searched suburbs by overseas home buyers of QLD properties such as coming from New Zealand, US, & the UK, according to realestate.com.au report.
Twelve-month data from July 2017 reveal that overseas property searches in Queensland have New Zealand as the top property hunters. Brisbane City emerged as the most searched suburb with 13,951 searches followed by Broadbeach with 9,898.
REA Group said that overseas home buyers would often check Brisbane properties first then widen their search to nearby suburbs. Such is the case of one overseas buyer who found their dream home in Aspley which he said is a place with great weather and affordable properties.
The top ten most searched suburbs are Brisbane City, Surfers Paradise, Noosa Heads, Broadbeach, Mooloolaba, Burleigh Heads, Southport, North Lakes, Caloundra, and Hope Island. Whilst UK and USA follow New Zealand, where most overseas property searchers originate. The REA Group said that European, American, and Canadian buyers are mostly drawn to Queensland’s beach and lifestyle destinations. Brisbane properties are what they would often check first, primarily because they are seeing better value for their money in Brisbane.
Rounding up the ten countries accounting for the most number of searches of the Queensland properties are Hong Kong, Philippines, Canada, Singapore, China, Japan, and South Africa.
According to the Australian Property Market Report for October from realestate.com.au, Brisbane continues to hold up well, despite tough financial conditions. Buyer demand, and rental demand and pricing are all in the green. Offshore buyer demand has seen a big increase which they attribute to the education sector and relative housing affordability.
The report says that Brisbane is gaining the confidence of the market with its better economic outlook and because of that, premium suburbs are benefiting with the subsequent rise in demand. Inner-north’s Grange and the outer south-east suburb of Chandler appeared as the top two in demand suburbs, according to the report.
Among Brisbane metro regions, East enjoys the most increase in demand year-on-year with 9.1%, followed by Brisbane Inner-city (8.2%) and North (5.0%). South and West saw declines in demand, however, year-on-year with -6.1% and -1.6% respectively.
The price growth is seen to continue over the next 12 months as Queensland economic growth will continue to propel the market.
The Australian Residential Property
Market and Economy
► Brisbane’s annual value growth has slowed from
+2.8% a year ago to +1.1% over the past year.
House values have risen by +1.2% over the past
year and unit values are +0.7% higher.
Australian Homes Achieve Over $15.6B In Re-Sale Gains Last Quarter
The latest CoreLogic Pain & Gain Report found that 89.8% of Australian homes sold during the second quarter of 2018 enjoyed a re-sale gross profit, with total re-sale gains of $15.683 billion, but the share of re-sales at a profit was the lowest since October 2013.
Spring 2018 might be finally Brisbane’s season. However, what does all this mean for Brisbane over the next six to 12 months? This year, we expect spring to have a positive effect, but in the overall scheme of things..............................
Osisko Development - Investor Presentation - June 24
Core logic home value index may 2020 final
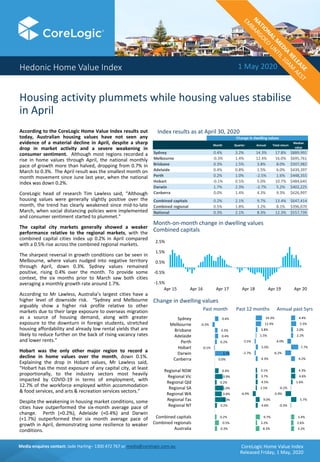
1. Media enquires contact: Jade Harling– 1300 472 767 or media@corelogic.com.au
Hedonic Home Value Index 1 May 2020
Housing activity plummets while housing values stabilise
in April
According to the CoreLogic Home Value Index results out
today, Australian housing values have not seen any
evidence of a material decline in April, despite a sharp
drop in market activity and a severe weakening in
consumer sentiment. Although most regions recorded a
rise in home values through April, the national monthly
pace of growth more than halved, dropping from 0.7% in
March to 0.3%. The April result was the smallest month on
month movement since June last year, when the national
index was down 0.2%.
CoreLogic head of research Tim Lawless said, “Although
housing values were generally slightly positive over the
month, the trend has clearly weakened since mid-to-late
March, when social distancing policies were implemented
and consumer sentiment started to plummet.”
The capital city markets generally showed a weaker
performance relative to the regional markets, with the
combined capital cities index up 0.2% in April compared
with a 0.5% rise across the combined regional markets.
The sharpest reversal in growth conditions can be seen in
Melbourne, where values nudged into negative territory
through April, down 0.3%. Sydney values remained
positive, rising 0.4% over the month. To provide some
context, the six months prior to March saw both cities
averaging a monthly growth rate around 1.7%.
According to Mr Lawless, Australia’s largest cities have a
higher level of downside risk. “Sydney and Melbourne
arguably show a higher risk profile relative to other
markets due to their large exposure to overseas migration
as a source of housing demand, along with greater
exposure to the downturn in foreign students, stretched
housing affordability and already low rental yields that are
likely to reduce further on the back of rising vacancy rates
and lower rents.”
Hobart was the only other major region to record a
decline in home values over the month, down 0.1%.
Explaining the drop in Hobart values, Mr Lawless said,
“Hobart has the most exposure of any capital city, at least
proportionally, to the industry sectors most heavily
impacted by COVID-19 in terms of employment, with
12.7% of the workforce employed within accommodation
& food services, and arts & recreation services sectors.”
Despite the weakening in housing market conditions, some
cities have outperformed the six-month average pace of
change. Perth (+0.2%), Adelaide (+0.4%) and Darwin
(+1.7%) outperformed their six month average pace of
growth in April, demonstrating some resilience to weaker
conditions.
CoreLogic Home Value Index
Released Friday, 1 May, 2020
Index results as at April 30, 2020
Change in dwelling values
Month Quarter Annual Total return
Median
value
Sydney 0.4% 3.2% 14.3% 17.8% $889,992
Melbourne -0.3% 1.4% 12.4% 16.0% $695,761
Brisbane 0.3% 1.5% 3.8% 8.0% $507,982
Adelaide 0.4% 0.8% 1.5% 6.0% $439,397
Perth 0.2% 1.0% -2.5% 1.6% $448,355
Hobart -0.1% 0.5% 5.0% 10.7% $484,645
Darwin 1.7% 2.3% -2.7% 5.2% $402,225
Canberra 0.0% 1.4% 4.3% 9.3% $626,997
Combined capitals 0.2% 2.1% 9.7% 13.4% $647,414
Combined regional 0.5% 1.8% 3.2% 8.1% $396,070
National 0.3% 2.1% 8.3% 12.3% $557,739
Change in dwelling values
-1.5%
-0.5%
0.5%
1.5%
2.5%
Apr 15 Apr 16 Apr 17 Apr 18 Apr 19 Apr 20
Month-on-month change in dwelling values
Combined capitals
0.4%
-0.3%
0.3%
0.4%
0.2%
-0.1%
1.7%
0.0%
0.4%
0.9%
0.2%
1.0%
0.8%
1.3%
0.2%
0.2%
0.5%
0.3%
Sydney
Melbourne
Brisbane
Adelaide
Perth
Hobart
Darwin
Canberra
Regional NSW
Regional Vic
Regional Qld
Regional SA
Regional WA
Regional Tas
Regional NT
Combined capitals
Combined regionals
Australia
14.3%
12.4%
3.8%
1.5%
-2.5%
5.0%
-2.7%
4.3%
3.1%
3.7%
4.5%
2.5%
-6.9%
9.0%
4.6%
9.7%
3.2%
8.3%
4.4%
5.5%
2.0%
2.2%
-4.0%
7.7%
-6.2%
4.2%
4.3%
4.6%
1.6%
-0.2%
-5.9%
5.7%
-0.3%
3.4%
2.6%
3.2%
Annual past 5yrsPast 12 monthsPast month
2. Media enquires contact: Jade Harling– 1300 472 767 or media@corelogic.com.auMedia enquires contact: Jade Harling - 1300 472 767 or media@corelogic.com.au
Hedonic Home Value Index
Other indicators of housing market conditions have not been
so resilient. CoreLogic estimates of settled sales plunged by
around 40% in April as buyers retreated to the sidelines and
listing numbers dried up.
“The most recent months are harder to provide an accurate
estimate of sales activity due to the lag in receiving the full
complement of sales records from each state government, as
well as the impact from Easter, however the substantial drop in
sales activity is supported by a similar fall in the number of
mortgage related valuation events across CoreLogic valuation
platforms, which account for around 85% of lender valuation
instructions,” said Mr Lawless.
Activity across CoreLogic’s ‘RP Data’ platform, where the
large majority of Australian real estate agents undertake
their research to prepare a property for sale, was down by
around 60% prior to Easter, providing a firm signal that
industry activity has been hit hard by the drop in active buyers
and sellers as well as policies preventing open homes and on-
site auctions.
The decline in real estate agent activity is also showing up in
the number of new listings being added to the market which
was tracking 35% lower at the end of April relative to the
same time a year ago and 43% below the five year average.
According to Lawless, lower advertised supply levels may have
a silver lining for housing values. “The reduction in advertised
stock levels at a time of low demand is another factor that
should help to insulate housing values from a more material
downturn.”
Mr Lawless states the drop in housing turnover has
implications for a wide variety of industries that are either
directly or indirectly reliant on property sales.
“Real estate agents will be among the most impacted by the
decline in transactions. A significant reduction in housing
activity will also have an impact on the banking and finance
sector, due to reduced mortgage-related activity, less valuation
work and conveyancing. There will also be fewer building and
pest inspections and a drop in removalist services,” he said.
“While construction of dwellings is still progressing amid COVID-19, the building sector is facing challenges to productivity as sites
are adapted to ensure the health and safety of workers. A slowdown in approvals will have a lagged impact on available projects
for construction companies down the line.”
Additionally, state governments will experience a budgetary hole from less stamp duty as transactions decline, and some retail
items such as home furnishings, appliances and white goods may see a decline, with sales likely to suffer until housing market
activity starts to recover. However retail trade data suggests losses in this space may be partially offset by increases in hardware,
building and gardening supplies, as people that can afford to, use the current slowdown for home improvement.
The most expensive housing markets are slowing the fastest. The CoreLogic stratified hedonic index shows the top quartile of
the housing market has weakened the most substantially. Quarterly gains across the top quartile reduced from 6.6% late last year
to 2.4% over the three months ending April.
On a monthly basis, the top quartile of capital city housing markets recorded a 0.1% lift in home values compared with a 0.3% rise
across the broad ‘middle’ of the market and a 0.2% increase across the lower quartile.
Melbourne’s upper quartile market was the biggest drag on the aggregate measures, with dwelling values down 0.8% in April
while the lower quartile and middle of the market continued to record a subtle rise in values over the month.
The difference between value based strata across Sydney was not as extreme. However the top quartile, which was previously
leading the pace of growth, had the lowest monthly rise at 0.3%. The broad middle of Sydney’s housing market, recorded a
stronger 0.6% lift in value.
The trends were more even across the value based strata of the smaller capitals, reflecting a more sustainable history of capital
gains. Premium housing markets have previously been more reactive to changes in the economic environment, and this trend is
once again becoming apparent.
CoreLogic Home Value Index
Released Friday, 1 May, 2020
Estimate of monthly settled sales, national
Number of new listings, rolling 28 day count, national
0
10,000
20,000
30,000
40,000
50,000
60,000
70,000
Apr 10 Apr 12 Apr 14 Apr 16 Apr 18 Apr 20
Decade average
0
10,000
20,000
30,000
40,000
50,000
60,000
Jan
Feb
Mar
Apr
May
Jun
Jul
Aug
Sep
Oct
Nov
Dec
2016 2017 2018 2019 2020
3. Media enquires contact: Jade Harling– 1300 472 767 or media@corelogic.com.au
Hedonic Home Value Index
In the context of rapidly weakening economic conditions and
the broader COVID-19 related disruption, the April housing
market result looks remarkably resilient.
Tim Lawless said, “The Australian version of this global health
and economic crisis is only a month-and-a-half old, and it looks
inevitable that there will be some downwards pressure on
housing values over the coming months. The magnitude of
housing value falls depends on a broad range of factors with
most hinging on the timing and extent of social distancing
policies being lifted.”
“The good news is that Australia has managed to flatten the
spread of the virus more effectively and efficiently than
expected and we are already seeing a subtle easing of social
distancing policies in some states. An early return of economic
activity should support a lift in consumer spirits which in turn
should see housing market activity sparking back to life.”
Plenty of downside risk remains for housing values, however,
there are a variety of factors that will help to insulate home
values from a material downturn.
A key factor is the leniency provided to distressed borrowers
affected by COVID-19 by Australian banks. Eligible borrowers
can take advantage of payment holidays over a six month
window, by which time the economy will hopefully be in better
shape. This policy is central to limiting the flow of distressed
properties onto the market, which could have otherwise been a
source of more significant downwards pressure on home
values.
Lawless noted, that the high rate of unemployment is likely to
be most impactful on areas of the workforce that have lower
rates of home ownership. The potential for stronger labour
market conditions amongst workers that have a higher rate of
home ownership is another factor that should help to keep the
number of distressed properties to a minimum.
There is also the unprecedented level of stimulus to consider,
which will help to keep businesses afloat and workers in a
paying job. A sharp reduction in advertised supply levels is
another factor helping to safeguard home values amidst a fall in
buyer demand.
Tim Lawless concludes on today’s results, “No doubt the coming
month will provide more clarity about the direction of housing
markets. One of the most important indicators to follow will be
measures of consumer sentiment. If consumer spirits start to
bounce back to more normal levels, this is when we should start
to see housing activity lift from their current low levels.”
CoreLogic Home Value Index
Released Friday, 1 May, 2020
Rental markets have shown a broad based weakening through April as the combined pressures of higher supply and lower
demand flow through to lower rents. Rents were down over the month across seven of the eight capital cities, with the largest
falls in Hobart (-1.1%), Sydney (-0.7%), Canberra (-0.7%) and Melbourne (-0.5%).
Perth, where rental conditions have been tightening for several years, was the only capital city to see a lift in rents over the
month (+0.1%). Mr Lawless said, “Rental markets were already soft leading into COVID-19, with annual growth of just 1.0% across
the combined capital cities over the twelve months ending March. The latest data for April has dragged the annual change in
capital city rents to just 0.4%.”
He said, “Rental markets are likely to show much weaker conditions over the coming months due to higher supply levels. The
conversion of short term rentals to permanent arrangements, and the large number of off-the-plan units that have recently
completed or still under construction are adding to rental supply.”
“On the demand side, occupancy rates are being negatively impacted by a stalling in overseas student numbers, as well as many
domestic students studying remotely, and a stalling in international migration. Demand has been further impacted by the weak
labour market conditions associated with sectors that are also synonymous with renters: casual employees, accommodation &
food service workers and arts & recreation workers.”
Unsurprisingly, unit markets have shown a weaker rental performance, with capital city unit rents down 0.9% in April
compared with a 0.3% drop in house rents.
With rents falling while housing values hold relatively firm, rental yields have slipped over the month, reaching a new record low
of 2.92% in Sydney.
Annual change in rents
Sydney, -0.7%
Melbourne, 0.7%
Adelaide, 2.3%
Brisbane, 0.9%
Perth, 1.6%
-8%
-3%
2%
7%
12%
Apr10
Apr12
Apr14
Apr16
Apr18
Apr20
Sydney Melbourne Adelaide
Brisbane Perth
Canberra, -0.1%
Hobart, 1.0%
Darwin, -1.2%
-12%
-7%
-2%
3%
8%
13%
18%
Apr10
Apr12
Apr14
Apr16
Apr18
Apr20
Canberra Hobart Darwin
2.9%
3.2%
4.4%
4.4%
4.3%
5.0%
5.8%
4.7%
4.6%
4.5%
5.2%
5.7%
6.1%
5.2%
6.7%
3.4%
4.9%
3.7%
Sydney
Melbourne
Brisbane
Adelaide
Perth
Hobart
Darwin
Canberra
Regional NSW
Regional Vic
Regional Qld
Regional SA
Regional WA
Regional Tas
Regional NT
Combined capitals
Combined regionals
National
Gross rental yields
4. Media enquires contact: Jade Harling– 1300 472 767 or media@corelogic.com.au
Hedonic Home Value Index
Sydney Melbourne Brisbane Adelaide Perth Hobart Darwin Canberra
Regional
NSW
Regional
Vic
Regional
Qld
Regional
SA
Regional
WA
Regional
Tas
Regional
NT
Combined
capitals
Combined
regional
National
Month 0.4% -0.3% 0.3% 0.4% 0.2% -0.1% 1.7% 0.0% 0.4% 0.9% 0.2% 1.0% 0.8% 1.3% na 0.2% 0.5% 0.3%
Quarter 3.2% 1.4% 1.5% 0.8% 1.0% 0.5% 2.3% 1.4% 1.7% 2.4% 1.6% 2.4% 0.9% 3.5% na 2.1% 1.8% 2.1%
YTD 4.4% 2.6% 1.9% 1.0% 1.1% 1.4% 2.4% 1.7% 2.2% 3.3% 2.4% 2.4% 1.9% 4.9% na 3.0% 2.5% 2.9%
Annual 14.3% 12.4% 3.8% 1.5% -2.5% 5.0% -2.7% 4.3% 3.1% 3.7% 4.5% 2.5% -6.9% 9.0% na 9.7% 3.2% 8.3%
Total return 17.8% 16.0% 8.0% 6.0% 1.6% 10.7% 5.2% 9.3% 7.7% 8.7% 9.5% 8.6% -1.2% 15.5% n a 13.4% 8.1% 12.3%
Gross yield 2.9% 3.2% 4.4% 4.4% 4.3% 5.0% 5.8% 4.7% 4.6% 4.5% 5.2% 5.7% 6.1% 5.2% na 3.4% 4.9% 3.7%
Median value $889,992 $695,761 $507,982 $439,397 $448,355 $484,645 $402,225 $626,997 $469,250 $392,268 $381,255 $243,518 $314,014 $325,938 na $647,414 $396,070 $557,739
Houses
Month 0.3% -0.4% 0.3% 0.4% 0.3% -0.2% 1.1% 0.1% 0.4% 0.8% 0.1% 0.6% 0.8% 1.1% -0.8% 0.1% 0.4% 0.2%
Quarter 3.2% 1.3% 1.6% 0.6% 1.1% 1.2% 3.4% 1.7% 1.8% 2.7% 1.7% 2.0% 0.8% 3.0% -4.3% 2.1% 1.8% 2.0%
YTD 4.8% 2.7% 2.3% 0.8% 1.2% 2.2% 4.1% 2.1% 2.2% 3.4% 2.5% 1.7% 1.6% 4.4% -3.5% 3.2% 2.5% 3.0%
Annual 15.8% 12.8% 4.2% 1.3% -2.5% 6.1% -3.8% 5.3% 3.5% 3.1% 5.2% 2.0% -7.6% 7.7% -0.7% 9.8% 3.3% 8.3%
Total return 19.2% 16.1% 8.0% 5.6% 1.6% 11.9% 3.6% 10.0% 8.1% 8.0% 10.0% 8.7% -1.9% 13.9% 7.6% 13.3% 8.1% 12.1%
Gross yield 2.7% 2.8% 4.2% 4.3% 4.2% 4.9% 5.4% 4.4% 4.6% 4.4% 5.1% 5.7% 6.0% 5.1% 6.9% 3.2% 4.9% 3.6%
Median value $1,026,418 $818,806 $558,372 $476,249 $465,521 $512,688 $473,984 $702,861 $482,387 $414,759 $388,368 $247,944 $326,111 $337,809 $392,600 $680,536 $407,749 $570,394
Units
Month 0.6% 0.1% 0.5% 0.7% -0.2% 0.5% 3.1% -0.4% 0.6% 1.4% 0.7% 8.4% 1.4% 2.8% na 0.4% 0.8% 0.4%
Quarter 3.2% 1.5% 1.0% 1.5% 0.6% -2.5% 0.3% 0.2% 1.4% 1.0% 1.3% 9.4% 4.1% 7.5% na 2.2% 1.5% 2.1%
YTD 3.5% 2.2% 0.4% 2.1% 0.9% -1.8% -0.7% 0.3% 1.8% 2.3% 2.0% 16.0% 5.8% 9.2% na 2.6% 2.3% 2.6%
Annual 11.0% 11.5% 2.3% 2.5% -3.0% 1.0% -0.3% 0.9% 0.7% 7.0% 2.2% 14.9% 5.1% 20.9% na 9.2% 2.8% 8.3%
Total return 15.2% 15.8% 7.7% 8.1% 1.4% 6.1% 7.9% 6.9% 5.7% 13.2% 8.0% 10.9% 11.0% 26.6% n a 13.7% 8.2% 12.9%
Gross yield 3.4% 4.0% 5.2% 5.4% 5.2% 5.1% 6.6% 5.8% 4.6% 4.9% 5.5% 5.7% 7.3% 5.4% na 3.9% 5.2% 4.1%
Median value $777,940 $588,204 $388,729 $334,240 $359,306 $404,021 $286,248 $445,169 $406,396 $293,947 $363,875 $203,561 $212,640 $267,688 na $585,719 $352,933 $525,771
HousesUnits
All Dwellings
Capitals Rest of state regions Aggregate indices
Dwellings
Methodology
The CoreLogic Hedonic Home Value Index
is calculated using a hedonic regression methodology that
addresses the issue of compositional bias associated with
median price and other measures. In simple terms, the index
is calculated using recent sales data combined with information
about the attributes of individual properties such as the number
of bedrooms and bathrooms, land area and geographical
context of the dwelling. By separating each property into its
various formational and locational attributes, observed sales
values for each property can be distinguished between those
attributed to the property’s attributes and those resulting
from changes in the underlying residential property market.
Additionally, by understanding the value associated with each
attribute of a given property, this methodology can be used to
estimate the value of dwellings with known characteristics
for which there is no recent sales price by observing the
characteristics and sales prices of other dwellings which have
recently transacted. It then follows that changes in the market
value of the entire residential property stock can be accurately
tracked through time. The detailed methodological information
can be found at:
https://www.corelogic.com.au/research/rp-data-corelogic-
home-value-index-methodology/
CoreLogic is able to produce a consistently accurate and robust
Hedonic Index due to its extensive property related database,
which includes transaction data for every home sale within
every state and territory. CoreLogic augments this data with
recent sales advice from real estate industry professionals,
listings information and attribute data collected from a
variety of sources.
CoreLogic Home Value Index
Released Friday, 1 May, 2020
CoreLogic is the largest independent provider of property information, analytics and property-
related risk management services in Australia and New Zealand.
* The median value is the middle estimated value of all residential properties derived through the hedonic regression methodology that underlies
the CoreLogic Hedonic Home Value Index.
CoreLogic Home Value Index tables