Download as PDF, PPTX
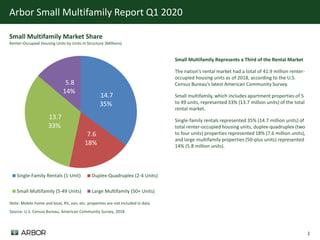
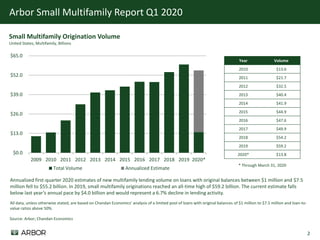
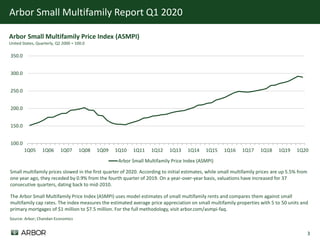
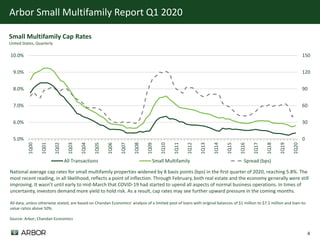
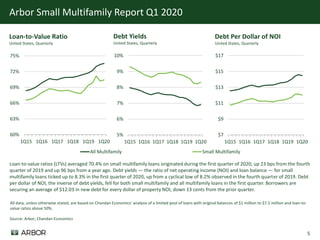

As of 2018, small multifamily properties (5-49 units) represented 33% of the U.S. rental market, with a total of 13.7 million units. In Q1 2020, new multifamily lending volume saw a decline of 6.7% from 2019's record, and average cap rates for small multifamily properties widened to 5.8%. While small multifamily prices increased by 5.5% year-over-year, they fell 0.9% from Q4 2019, reflecting potential impacts from COVID-19 on market dynamics.