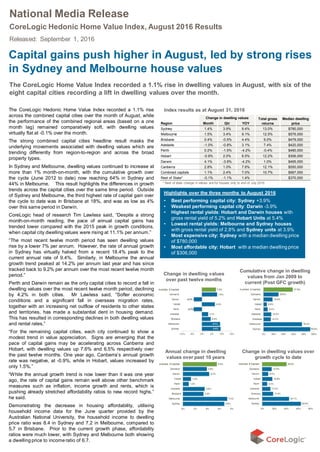
The CoreLogic Home Value Index recorded a 1.1% rise in dwelling values across the combined capital cities in August. Sydney and Melbourne continued to see strong increases above 1% month-on-month, while growth has slowed or turned negative in Perth and Darwin. Transaction numbers have fallen 15% nationally over the past year due to low listing numbers, tighter lending conditions, and declining affordability. Rental rates continued to decline slightly, with yields reaching new lows of around 3% in Sydney and Melbourne.
1. Region Month Qtr YOY
Sydney 1.4% 3.9% 9.4% 13.0% $780,000
Melbourne 1.5% 3.4% 9.1% 12.5% $576,000
Brisbane 0.4% -0.5% 4.4% 9.0% $479,000
Adelaide -1.0% -0.8% 3.1% 7.4% $420,000
Perth 0.2% -1.5% -4.2% -0.4% $480,000
Hobart -0.9% 2.0% 6.5% 12.2% $306,000
Darwin 4.1% -3.9% -4.2% 1.0% $495,000
Canberra 2.8% 1.0% 7.6% 12.1% $550,000
Combined capitals 1.1% 2.4% 7.0% 10.7% $567,000
Rest of State* -0.1% -1.1% 1.4% $370,000
Median dwelling
price
Change in dwelling values Total gross
returns
National Media Release
CoreLogic Hedonic Home Value Index, August 2016 Results
Released: September 1, 2016
* Rest of state change in values are for houses only to end of July 2016
Capital gains push higher in August, led by strong rises
in Sydney and Melbourne house values
The CoreLogic Home Value Index recorded a 1.1% rise in dwelling values in August, with six of the
eight capital cities recording a lift in dwelling values over the month.
The CoreLogic Hedonic Home Value Index recorded a 1.1% rise
across the combined capital cities over the month of August, while
the performance of the combined regional areas (based on a one
month lag) remained comparatively soft, with dwelling values
virtually flat at -0.1% over the month.
The strong combined capital cities headline result masks the
underlying movements associated with dwelling values which are
trending differently from region-to-region and across the broad
property types.
In Sydney and Melbourne, dwelling values continued to increase at
more than 1% month-on-month, with the cumulative growth over
the cycle (June 2012 to date) now reaching 64% in Sydney and
44% in Melbourne. This result highlights the differences in growth
trends across the capital cities over the same time period. Outside
of Sydney and Melbourne, the third highest rate of capital gain over
the cycle to date was in Brisbane at 18%, and was as low as 4%
over this same period in Darwin.
CoreLogic head of research Tim Lawless said, “Despite a strong
month-on-month reading, the pace of annual capital gains has
trended lower compared with the 2015 peak in growth conditions,
when capital city dwelling values were rising at 11.1% per annum.”
“The most recent twelve month period has seen dwelling values
rise by a lower 7% per annum. However, the rate of annual growth
in Sydney has virtually halved from a recent 18.4% peak to the
current annual rate of 9.4%. Similarly, in Melbourne the annual
growth trend peaked at 14.2% per annum last year and has since
tracked back to 9.2% per annum over the most recent twelve month
period.”
Perth and Darwin remain as the only capital cities to record a fall in
dwelling values over the most recent twelve month period, declining
by 4.2% in both cities. Mr Lawless said, “Softer economic
conditions and a significant fall in overseas migration rates,
together with an increasing net outflow of residents to other states
and territories, has made a substantial dent in housing demand.
This has resulted in corresponding declines in both dwelling values
and rental rates.”
“For the remaining capital cities, each city continued to show a
modest trend in value appreciation. Signs are emerging that the
pace of capital gains may be accelerating across Canberra and
Hobart, with dwelling values up 7.6% and 6.5% respectively over
the past twelve months. One year ago, Canberra’s annual growth
rate was negative, at -0.9%, while in Hobart, values increased by
only 1.5%.”
“While the annual growth trend is now lower than it was one year
ago, the rate of capital gains remain well above other benchmark
measures such as inflation, income growth and rents, which is
pushing already stretched affordability ratios to new record highs,”
he said.
Demonstrating the decrease in housing affordability, utilising
household income data for the June quarter provided by the
Australian National University, the household income to dwelling
price ratio was 8.4 in Sydney and 7.2 in Melbourne, compared to
5.7 in Brisbane. Prior to the current growth phase, affordability
ratios were much lower, with Sydney and Melbourne both showing
a dwelling price to income ratio of 6.7.
Cumulative change in dwelling
values from Jan 2009 to
current (Post GFC growth)
Change in dwelling values
over past twelve months
Highlights over the three months to August 2016
• Best performing capital city: Sydney +3.9%
• Weakest performing capital city: Darwin -3.9%
• Highest rental yields: Hobart and Darwin houses with
gross rental yield of 5.2% and Hobart Units at 5.4%
• Lowest rental yields: Melbourne and Sydney houses
with gross rental yield of 2.8% and Sydney units at 3.9%
• Most expensive city: Sydney with a median dwelling price
of $780,000
• Most affordable city: Hobart with a median dwelling price
of $306,000
Index results as at August 31, 2016
Annual change in dwelling
values over past 10 years
Change in dwelling values over
growth cycle to date
2. -10%
-5%
0%
5%
10%
15%
20%
25%
Aug 96 Aug 98 Aug 00 Aug 02 Aug 04 Aug 06 Aug 08 Aug 10 Aug 12 Aug 14 Aug 16
Houses Units
Additionally listing numbers remain low in both cities. Mr Lawless said, “Property owners seem less willing to list a property for sale
despite the strong market conditions in Sydney and Melbourne. The short supply of housing stock is likely causing some urgency
amongst buyers which is contributing to the upwards pressure on dwelling values."
“Recently, new listing numbers have started to trend higher, which is normal for this time of year as vendors look to take advantage of the
warmer weather during Spring. Higher listing numbers will provide a timely test of the housing markets strength and whether more stock
will be matched with a higher rate of absorption,” he said.
Transaction numbers have also trended lower over the past year. Over the three months to the end of August, CoreLogic estimates there
have been 15% fewer settled sales nationally compared with the same period one year prior. The combined capitals have seen a sharper
downturn in the number of home sales, down 17.1%. In the weakest markets of Perth and Darwin, transaction numbers have been
trending lower since 2013, as housing demand has progressively softened, with the number of dwelling sales also trending lower in cities
where values are rising.
Mr Lawless said, “The trend of fewer sales coinciding with values pushing higher is likely explained, at least partially, by low stock levels,
particularly in Sydney and Melbourne, where listing numbers remain close to record lows. Other factors that are likely to be contributing to
the slowdown in transaction numbers include tighter lending conditions, decreasing levels of affordability which prevent some segments of
the market from participating and high transactional costs including stamp duty on purchase.”
“Furthermore, the heightened level of new unit construction and off-the-plan sales is likely to be accounting for some understating of sales
activity. Given off-the-plan unit sales are not counted until they settle, there will be some upwards revision in transaction numbers as the
record number of units under construction, and selling off the plan, move through to settlement.”
Rental markets continued to run soft, with capital city rents falling a further -1.1% over the past three months to be -0.5% lower over the
year. The weakest rental conditions are being experienced in Darwin and Perth, where dwelling rents fell by -9.4% and -14.1%
respectively over the past twelve months.
Most of the capitals recorded rental falls over the year, however rents have shown some subtle growth in Melbourne, Canberra and
Hobart. The gross rental yield profile in Sydney and Melbourne has once again pushed to a new record low in August. Sydney and
Melbourne have each recorded the lowest gross rental yields across the capitals for houses at 2.8%, both of which are record lows for the
cities. Gross rental yields on units tend to be higher compared with houses, however the gross yield for attached housing product is also
at a record low, averaging 4.1% across the capital cities and ranging from 3.9% in Sydney to 5.4% in Hobart.
Mr Lawless said, “The disparity in the performance of housing markets across the capital cities and from region-to-region highlights the
diverse economic and demographic factors around the country.
“Such diversity, not only regionally, but also across housing types, makes reading the housing market more challenging than ever.
Complicatingthis is the fact that a record amount of new housing construction is under way, with more in the pipeline.
“With so much new supply being delivered to the market in the form of units, we are already seeing significantly slower growth rates for
units compared to houses in a number of cities. As these unit projects come to completion and ultimately settlement, the
underperformance of new unit stock could create headwinds for the market in certain geographies.”
“In summary, Australia’s housing market continues to demonstrate a strong level of resiliency in this record low interest rate environment,
despite the many moving parts and somewhat divergent underlying trends,” Mr Lawless said.
Annual change houses vs units, combined capital cities
Mr Lawless said, “The August Home Value Index shows a
substantial difference between the performance of house and unit
values. At a combined capital’s level, house values rose by 7.2%
over the past twelve months, compared with a 5.5% rise in unit
values.”
“The trend for house value growth outperforming unit values is
apparent across most of the capital cities, particularly in Melbourne
and Brisbane, where concerns around inner city unit oversupply are
mounting. House values by more than double the rate of units over
the past year in each of Melbourne, Brisbane, Adelaide and
Canberra.”
“Looking at housing market performance across the broader value
segments over the past 12 months, the most affordable suburbs
have recorded the greatest value rises, while the most expensive
suburbs have seen a more moderate rate of growth,” he said.
Based on the CoreLogic Stratified Hedonic Index, the most
affordable quartile of capital city suburbs has recorded a value rise
of 10% over the past year, compared to 7.4% growth across the
broad middle of the market and a 6.2% gain across the most
expensive quartile.
According to Mr Lawless, the strong growth conditions in Sydney
and Melbourne have been supported by auction clearance rates
that are now trending close to the recent highs recorded during mid-
2015.
Gross rental yields, houses and units
Houses Units
National Media Release cont’d
CoreLogic Hedonic Home Value Index Results
Media enquiries contact: Mitch Koper, CoreLogic national communications manager –1300 472 767 or
media@corelogic.com.au
3. Capital Growth to 31 August 2016 Sydney Melbourne
Brisbane -
Gold Coast Adelaide Perth
Australia 5
Capitals
(ASX) Hobart Darwin Canberra Brisbane
Australia
8 Capitals
Table 1A: All Dwellings
Month 1.4% 1.5% 0.5% -1.0% 0.2% 1.1% -0.9% 4.1% 2.8% 0.4% 1.1%
Quarter 3.9% 3.4% -0.2% -0.8% -1.5% 2.5% 2.0% -3.9% 1.0% -0.5% 2.4%
Year-to-Date 11.9% 8.6% 2.3% 3.7% -4.6% 7.5% 8.8% -2.5% 6.6% 1.7% 7.5%
Year-on-Year 9.4% 9.1% 4.6% 3.1% -4.2% 7.0% 6.5% -4.2% 7.6% 4.4% 7.0%
Total Return Year-on-Year 13.0% 12.5% 9.3% 7.4% -0.4% 10.7% 12.2% 1.0% 12.1% 9.0% 10.7%
Median price* based on settled sales over quarter $780,000 $576,000 $480,000 $420,000 $480,000 $567,500 $306,000 $495,000 $550,000 $479,000 $567,000
Table 1B: Houses
Month 1.7% 1.6% 0.5% -0.8% 0.2% 1.2% -0.8% 2.1% 3.0% 0.5% 1.3%
Quarter 4.2% 3.6% 0.0% -0.8% -1.7% 2.6% 2.2% -6.4% 0.7% -0.3% 2.5%
Year-to-Date 12.8% 9.4% 2.5% 3.9% -4.5% 7.9% 8.8% -2.8% 6.9% 1.9% 8.0%
Year-on-Year 9.6% 9.7% 5.2% 3.3% -4.2% 7.2% 5.5% -4.4% 8.3% 4.9% 7.2%
Total Return Year-on-Year 13.1% 12.9% 9.8% 7.6% -0.4% 10.8% 11.2% 0.7% 12.8% 9.4% 10.8%
Median price* based on settled sales over quarter $880,000 $635,000 $535,000 $445,000 $500,000 $602,500 $320,000 $549,000 $609,000 $515,000 $600,000
Table 1C: Units
Month 0.2% 0.7% 0.0% -2.3% 0.5% 0.2% -1.6% 13.0% -0.2% 0.2% 0.3%
Quarter 2.4% 1.5% -1.3% -1.0% 2.0% 1.7% 1.0% 8.1% 4.8% -2.7% 1.7%
Year-to-Date 7.5% 1.6% 0.3% 1.4% -4.9% 4.4% 9.0% -1.5% 1.7% -0.5% 4.5%
Year-on-Year 8.3% 4.1% 0.0% 0.8% -5.0% 5.4% 16.3% -3.1% -1.6% -0.4% 5.5%
Total Return Year-on-Year 12.8% 8.4% 5.5% 5.7% -0.8% 10.0% 22.6% 2.0% 3.6% 5.0% 10.0%
Median price* based on settled sales over quarter $665,500 $480,000 $385,000 $375,000 $390,000 $490,000 $273,000 $401,500 $420,000 $390,000 $495,000
Table 1D: Rental Yield Results
Houses 2.8% 2.8% 4.2% 4.0% 3.7% 3.1% 5.2% 5.2% 3.9% 4.1% 3.2%
Units 3.9% 4.0% 5.3% 4.7% 4.4% 4.1% 5.4% 4.1% 5.1% 5.2% 4.1%
The indices in grey shading have been designed for trading environments in partnership with the Australian Securities Exchange (www.asx.com.au). Indices
under blue shading (Hobart, Darwin, Canberra, Brisbane and the 8 capital city aggregate) are calculated under the same methodology however are not
currently planned to be part of the trading environment.
*The median price is the middle price of all settled sales over the three months to the end of the final month. Median prices are provided as an indicator of
what price a typical home sold for over the most recent quarter. The median price has no direct relationship with the CoreLogic Hedonic Index value. The
change in the Index value over time reflects the underlying capital growth rates generated by residential property in the relevant region.
The CoreLogic Hedonic Index growth rates are not ordinarily influenced by capital expenditure on homes, compositional changes in the types of properties
being transacted, or variations in the type and quality of new homes manufactured over time. The CoreLogic ‘index values’ are not, therefore, the same as the
‘median price’ sold during a given period. See the methodology below for further details.
Methodology: The CoreLogic Hedonic Home Value Index is calculated using a hedonic regression methodology that addresses the issue of compositional
bias associated with median price and other measures. In simple terms, the index is calculated using recent sales data combined with information about the
attributes of individual properties such as the number of bedrooms and bathrooms, land area and geographical context of the dwelling. By separating each
property comprising the index into its various formational and locational attributes, differing observed sales values for each property can be separated into
those associated with varying attributes and those resulting from changes in the underlying residential property market. Also, by understanding the value
associated with each attribute of a given property, this methodology can be used to estimate the value of dwellings with known characteristics for which there
is no recent sales price by observing the characteristics and sales prices of other dwellings which have recently transacted. It then follows that changes in the
market value of the stock of residential property comprising an index can be accurately tracked through time. CoreLogic owns and maintains Australia's largest
property related database in Australia which includes transaction data for every home sale within every state and territory. CoreLogic augments this data with
recent sales advice from real estate industry professionals, listings information and attribute data collected from a variety of sources. For detailed
methodological information please visit www.corelogic.com.au
Recent updates to the CoreLogic Hedonic Home Value Index – April/May 2016
CoreLogic's periodic audits of analytic methods and algorithms identified an improvement to the Hedonic Index sampling methodology in early 2016 which
was applied throughout April. CoreLogic implemented a dynamic mechanism for excluding extreme (outlier) transactions. After rigorous back testing and
validation, it was determined that dynamic price filters would deliver a more robust and precise output. As a result of these changes, the CoreLogic Hedonic
Index recorded higher than normal intra-month volatility in the capital city index readings throughout April and May. This improvement will ensure that the
Hedonic Home Value Index will continue to represent the timeliest and most precise measurement of housing market conditions available.
For more information on the CoreLogic Indices, please go to http://www.corelogic.com.au
About CoreLogic CoreLogic Australia is a wholly owned subsidiary of CoreLogic (NYSE: CLGX), which is the largest property data and analytics company in
the world. CoreLogic provides property information, analytics and services across Australia, New Zealand and Asia, and recently expanded its service offering
through the purchase of project activity and building cost information provider Cordell. With Australia’s most comprehensive property databases, the
company’s combined data offering is derived from public, contributory and proprietary sources and includes over 500 million decision points spanning over
three decades of collection, providing detailed coverage of property and other encumbrances such as tenancy, location, hazard risk and related performance
information.
With over 20,000 customers and 150,000 end users, CoreLogic is the leading provider of property data, analytics and related services to consumers,
investors, real estate, mortgage, finance, banking, building services, insurance, developers, wealth management and government. CoreLogic delivers value
to clients through unique data, analytics, workflow technology, advisory and geo spatial services. Clients rely on CoreLogic to help identify and manage growth
opportunities, improve performance and mitigate risk. CoreLogic employs over 650 people across Australia and in New Zealand. For more information call
1300 734 318 or visit www.corelogic.com.au
CoreLogic Home Value Index tables
National Media Release cont’d
Media enquiries contact: Mitch Koper, CoreLogic national communications manager – 1300 472 767 or
media@corelogic.com.au