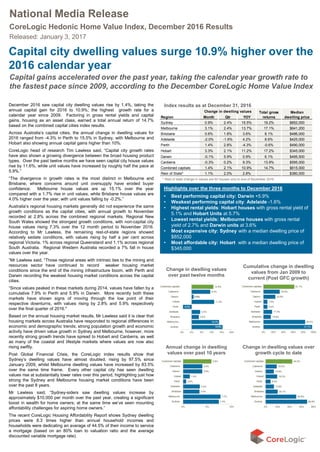
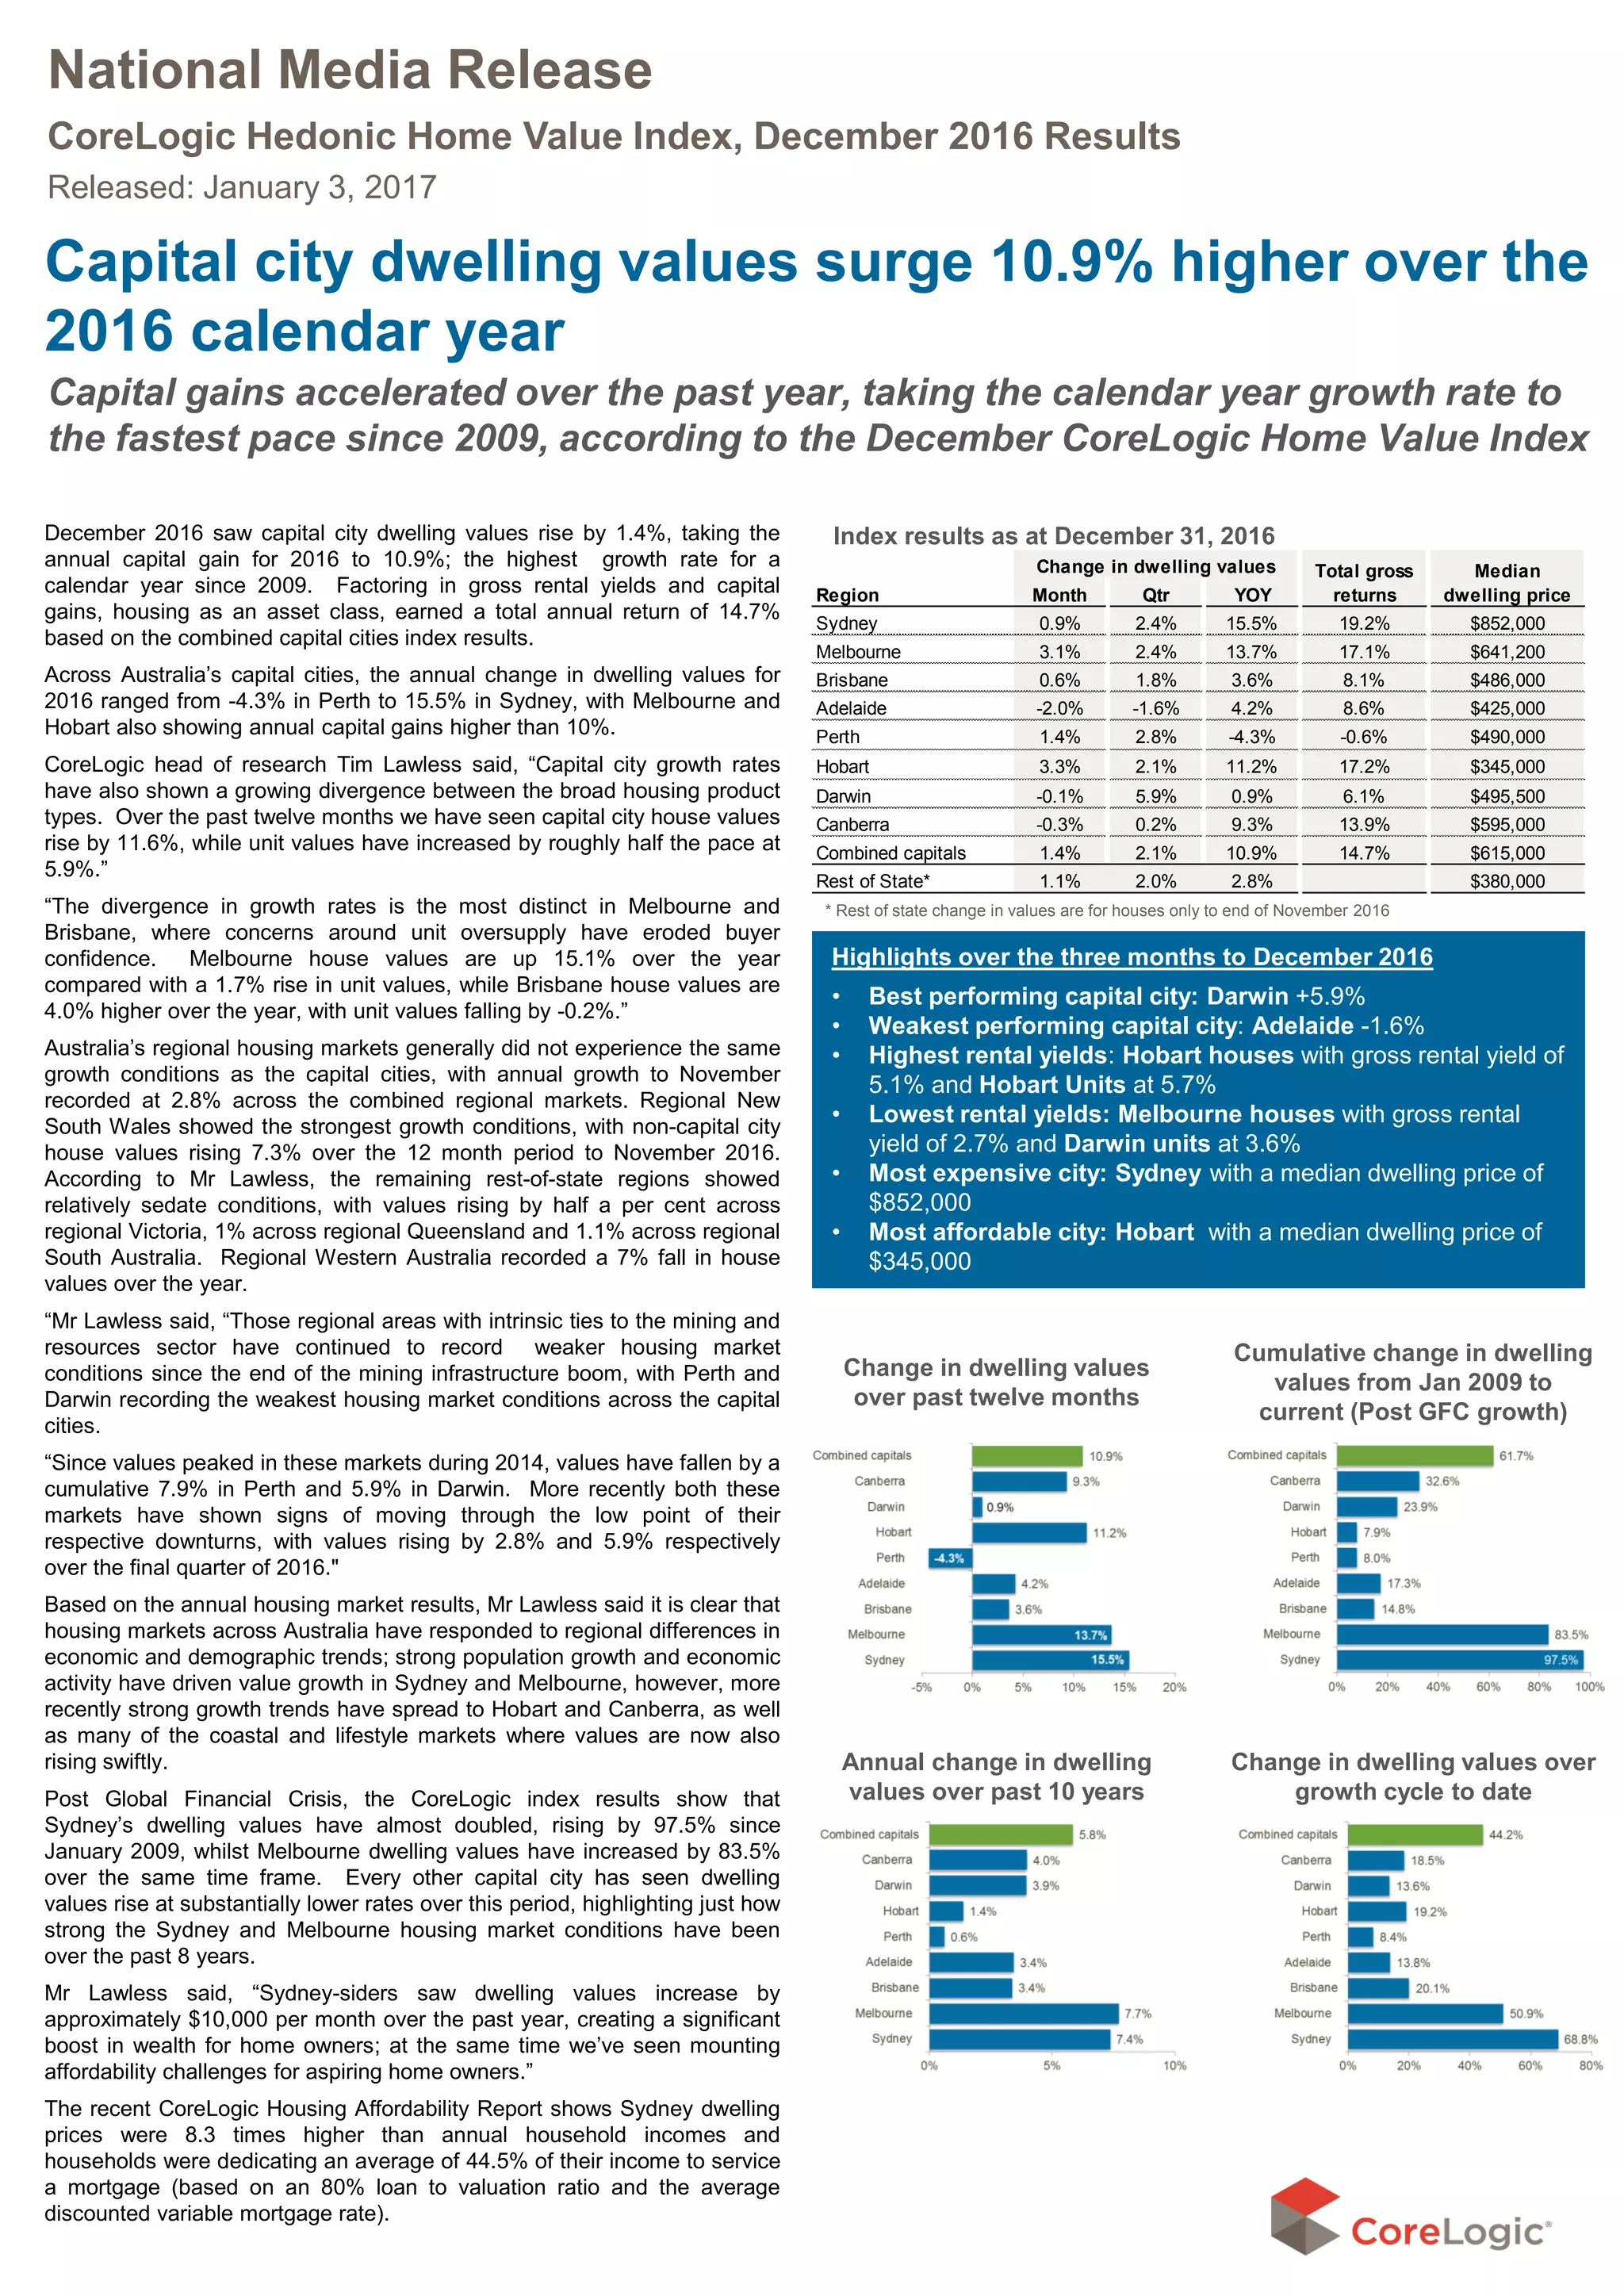
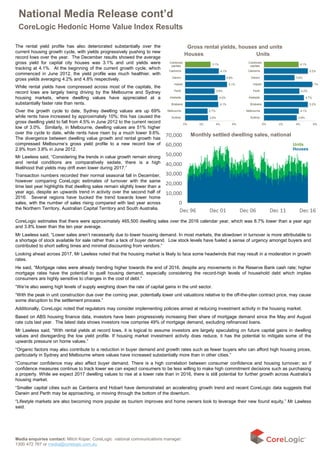
Region Month Qtr YOY
Sydney 0.9% 2.4% 15.5% 19.2% $852,000
Melbourne 3.1% 2.4% 13.7% 17.1% $641,200
Brisbane 0.6% 1.8% 3.6% 8.1% $486,000
Adelaide -2.0% -1.6% 4.2% 8.6% $425,000
Perth 1.4% 2.8% -4.3% -0.6% $490,000
Hobart 3.3% 2.1% 11.2% 17.2% $345,000
Darwin -0.1% 5.9% 0.9% 6.1% $495,500
Canberra -0.3% 0.2% 9.3% 13.9% $595,000
Combined capitals 1.4% 2.1% 10.9% 14.7% $615,000
Rest of State* 1.1% 2.0% 2.8% $380,000
Median
dwelling price
Change in dwelling values Total gross
returns
* Rest of state change in values are for houses only to end of November 2016
National Media Release
CoreLogic Hedonic Home Value Index, December 2016 Results
Released: January 3, 2017
Capital city dwelling values surge 10.9% higher over the
2016 calendar year
Capital gains accelerated over the past year, taking the calendar year growth rate to
the fastest pace since 2009, according to the December CoreLogic Home Value Index
Cumulative change in dwelling
values from Jan 2009 to
current (Post GFC growth)
Change in dwelling values
over past twelve months
Highlights over the three months to December 2016
• Best performing capital city: Darwin +5.9%
• Weakest performing capital city: Adelaide -1.6%
• Highest rental yields: Hobart houses with gross rental yield of
5.1% and Hobart Units at 5.7%
• Lowest rental yields: Melbourne houses with gross rental
yield of 2.7% and Darwin units at 3.6%
• Most expensive city: Sydney with a median dwelling price of
$852,000
• Most affordable city: Hobart with a median dwelling price of
$345,000
Index results as at December 31, 2016
Annual change in dwelling
values over past 10 years
Change in dwelling values over
growth cycle to date
December 2016 saw capital city dwelling values rise by 1.4%, taking the
annual capital gain for 2016 to 10.9%; the highest growth rate for a
calendar year since 2009. Factoring in gross rental yields and capital
gains, housing as an asset class, earned a total annual return of 14.7%
based on the combined capital cities index results.
Across Australia’s capital cities, the annual change in dwelling values for
2016 ranged from -4.3% in Perth to 15.5% in Sydney, with Melbourne and
Hobart also showing annual capital gains higher than 10%.
CoreLogic head of research Tim Lawless said, “Capital city growth rates
have also shown a growing divergence between the broad housing product
types. Over the past twelve months we have seen capital city house values
rise by 11.6%, while unit values have increased by roughly half the pace at
5.9%.”
“The divergence in growth rates is the most distinct in Melbourne and
Brisbane, where concerns around unit oversupply have eroded buyer
confidence. Melbourne house values are up 15.1% over the year
compared with a 1.7% rise in unit values, while Brisbane house values are
4.0% higher over the year, with unit values falling by -0.2%.”
Australia’s regional housing markets generally did not experience the same
growth conditions as the capital cities, with annual growth to November
recorded at 2.8% across the combined regional markets. Regional New
South Wales showed the strongest growth conditions, with non-capital city
house values rising 7.3% over the 12 month period to November 2016.
According to Mr Lawless, the remaining rest-of-state regions showed
relatively sedate conditions, with values rising by half a per cent across
regional Victoria, 1% across regional Queensland and 1.1% across regional
South Australia. Regional Western Australia recorded a 7% fall in house
values over the year.
“Mr Lawless said, “Those regional areas with intrinsic ties to the mining and
resources sector have continued to record weaker housing market
conditions since the end of the mining infrastructure boom, with Perth and
Darwin recording the weakest housing market conditions across the capital
cities.
“Since values peaked in these markets during 2014, values have fallen by a
cumulative 7.9% in Perth and 5.9% in Darwin. More recently both these
markets have shown signs of moving through the low point of their
respective downturns, with values rising by 2.8% and 5.9% respectively
over the final quarter of 2016."
Based on the annual housing market results, Mr Lawless said it is clear that
housing markets across Australia have responded to regional differences in
economic and demographic trends; strong population growth and economic
activity have driven value growth in Sydney and Melbourne, however, more
recently strong growth trends have spread to Hobart and Canberra, as well
as many of the coastal and lifestyle markets where values are now also
rising swiftly.
Post Global Financial Crisis, the CoreLogic index results show that
Sydney’s dwelling values have almost doubled, rising by 97.5% since
January 2009, whilst Melbourne dwelling values have increased by 83.5%
over the same time frame. Every other capital city has seen dwelling
values rise at substantially lower rates over this period, highlighting just how
strong the Sydney and Melbourne housing market conditions have been
over the past 8 years.
Mr Lawless said, “Sydney-siders saw dwelling values increase by
approximately $10,000 per month over the past year, creating a significant
boost in wealth for home owners; at the same time we’ve seen mounting
affordability challenges for aspiring home owners.”
The recent CoreLogic Housing Affordability Report shows Sydney dwelling
prices were 8.3 times higher than annual household incomes and
households were dedicating an average of 44.5% of their income to service
a mortgage (based on an 80% loan to valuation ratio and the average
discounted variable mortgage rate).
Monthly settled dwelling sales, national
The rental yield profile has also deteriorated substantially over the
current housing growth cycle, with yields progressively pushing to new
record lows over the year. The December results showed the average
gross yield for capital city houses was 3.1% and unit yields were
tracking at 4.1%. At the beginning of the current growth cycle, which
commenced in June 2012, the yield profile was much healthier, with
gross yields averaging 4.2% and 4.8% respectively.
While rental yields have compressed across most of the capitals, the
record lows are largely being driving by the Melbourne and Sydney
housing markets, where dwelling values have appreciated at a
substantially faster rate than rents.
Over the growth cycle to date, Sydney dwelling values are up 69%
while rents have increased by approximately 10%; this has caused the
gross dwelling yield to fall from 4.5% in June 2012 to the current record
low of 3.0%. Similarly, in Melbourne, dwelling values are 51% higher
over the cycle to date, while rents have risen by a much lower 9.6%.
The divergence between dwelling value growth and rental growth has
compressed Melbourne’s gross yield profile to a new record low of
2.9% from 3.8% in June 2012.
Mr Lawless said, “Considering the trends in value growth remain strong
and rental conditions are comparatively sedate, there is a high
likelihood that yields may drift even lower during 2017.”
Transaction numbers recorded their normal seasonal fall in December,
however comparing CoreLogic estimates of turnover with the same
time last year highlights that dwelling sales remain slightly lower than a
year ago, despite an upwards trend in activity over the second half of
2016. Several regions have bucked the trend towards lower home
sales, with the number of sales rising compared with last year across
the Northern Territory, Australian Capital Territory and South Australia.
Gross rental yields, houses and units
Houses Units
National Media Release cont’d
CoreLogic Hedonic Home Value Index Results
Media enquiries contact: Mitch Koper, CoreLogic national communications manager:
1300 472 767 or media@corelogic.com.au
Houses
Units
CoreLogic estimates that there were approximately 465,500 dwelling sales over the 2016 calendar year, which was 8.7% lower than a year ago
and 3.8% lower than the ten year average.
Mr Lawless said, “Lower sales aren’t necessarily due to lower housing demand. In most markets, the slowdown in turnover is more attributable to
a shortage of stock available for sale rather than a lack of buyer demand. Low stock levels have fueled a sense of urgency amongst buyers and
contributed to short selling times and minimal discounting from vendors.”
Looking ahead across 2017, Mr Lawless noted that the housing market is likely to face some headwinds that may result in a moderation in growth
rates.
He said, “Mortgage rates were already trending higher towards the end of 2016, despite any movements in the Reserve Bank cash rate; higher
mortgage rates have the potential to quell housing demand, especially considering the record-high levels of household debt which implies
consumers are highly sensitive to changes in the cost of debt.”
“We’re also seeing high levels of supply weighing down the rate of capital gains in the unit sector.
“With the peak in unit construction due over the coming year, potentially lower unit valuations relative to the off-the-plan contract price, may cause
some disruption to the settlement process.”
Additionally, CoreLogic noted that regulators may consider implementing policies aimed at reducing investment activity in the housing market.
Based on ABS housing finance data, investors have been progressively increasing their share of mortgage demand since the May and August
rate cuts last year. The latest data shows investors now comprise 49% of mortgage demand, excluding refinanced loans.
Mr Lawless said, “With rental yields at record lows, it is logical to assume investors are largely speculating on future capital gains in dwelling
values and disregarding the low yield profile. If housing market investment activity does reduce, it has the potential to mitigate some of the
upwards pressure on home values.”
“Organic factors may also contribute to a reduction in buyer demand and growth rates such as fewer buyers who can afford high housing prices,
particularly in Sydney and Melbourne where values have increased substantially more than in other cities.”
“Consumer confidence may also affect buyer demand. There is a high correlation between consumer confidence and housing turnover; so if
confidence measures continue to track lower we can expect consumers to be less willing to make high commitment decisions such as purchasing
a property. While we expect 2017 dwelling values to rise at a lower rate than in 2016, there is still potential for further growth across Australia’s
housing market.
“Smaller capital cities such as Canberra and Hobart have demonstrated an accelerating growth trend and recent CoreLogic data suggests that
Darwin and Perth may be approaching, or moving through the bottom of the downturn.
“Lifestyle markets are also becoming more popular as tourism improves and home owners look to leverage their new found equity,” Mr Lawless
said.
The indices in grey shading have been designed for trading environments in partnership with the Australian Securities Exchange (www.asx.com.au). Indices
under blue shading (Hobart, Darwin, Canberra, Brisbane and the 8 capital city aggregate) are calculated under the same methodology however are not
currently planned to be part of the trading environment.
*The median price is the middle price of all settled sales over the three months to the end of the final month. Median prices are provided as an indicator of
what price a typical home sold for over the most recent quarter. The median price has no direct relationship with the CoreLogic Hedonic Index value. The
change in the Index value over time reflects the underlying capital growth rates generated by residential property in the relevant region.
The CoreLogic Hedonic Index growth rates are not ordinarily influenced by capital expenditure on homes, compositional changes in the types of properties
being transacted, or variations in the type and quality of new homes manufactured over time. The CoreLogic ‘index values’ are not, therefore, the same as the
‘median price’ sold during a given period. See the methodology below for further details.
Methodology: The CoreLogic Hedonic Home Value Index is calculated using a hedonic regression methodology that addresses the issue of compositional
bias associated with median price and other measures. In simple terms, the index is calculated using recent sales data combined with information about the
attributes of individual properties such as the number of bedrooms and bathrooms, land area and geographical context of the dwelling. By separating each
property comprising the index into its various formational and locational attributes, differing observed sales values for each property can be separated into
those associated with varying attributes and those resulting from changes in the underlying residential property market. Also, by understanding the value
associated with each attribute of a given property, this methodology can be used to estimate the value of dwellings with known characteristics for which there
is no recent sales price by observing the characteristics and sales prices of other dwellings which have recently transacted. It then follows that changes in the
market value of the stock of residential property comprising an index can be accurately tracked through time. CoreLogic owns and maintains Australia's largest
property related database in Australia which includes transaction data for every home sale within every state and territory. CoreLogic augments this data with
recent sales advice from real estate industry professionals, listings information and attribute data collected from a variety of sources. For detailed
methodological information please visit www.corelogic.com.au
Recent updates to the CoreLogic Hedonic Home Value Index – April/May 2016
CoreLogic's periodic audits of analytic methods and algorithms identified an improvement to the Hedonic Index sampling methodology in early 2016 which
was applied throughout April. CoreLogic implemented a dynamic mechanism for excluding extreme (outlier) transactions. After rigorous back testing and
validation, it was determined that dynamic price filters would deliver a more robust and precise output. As a result of these changes, the CoreLogic Hedonic
Index recorded higher than normal intra-month volatility in the capital city index readings throughout April and May. This improvement will ensure that the
Hedonic Home Value Index will continue to represent the timeliest and most precise measurement of housing market conditions available.
For more information on the CoreLogic Indices, please go to http://www.corelogic.com.au
About CoreLogic CoreLogic Australia is a wholly owned subsidiary of CoreLogic (NYSE: CLGX), which is the largest property data and analytics company in
the world. CoreLogic provides property information, analytics and services across Australia, New Zealand and Asia, and recently expanded its service offering
through the purchase of project activity and building cost information provider Cordell. With Australia’s most comprehensive property databases, the
company’s combined data offering is derived from public, contributory and proprietary sources and includes over 500 million decision points spanning over
three decades of collection, providing detailed coverage of property and other encumbrances such as tenancy, location, hazard risk and related performance
information.
With over 20,000 customers and 150,000 end users, CoreLogic is the leading provider of property data, analytics and related services to consumers,
investors, real estate, mortgage, finance, banking, building services, insurance, developers, wealth management and government. CoreLogic delivers value
to clients through unique data, analytics, workflow technology, advisory and geo spatial services. Clients rely on CoreLogic to help identify and manage growth
opportunities, improve performance and mitigate risk. CoreLogic employs over 650 people across Australia and in New Zealand. For more information call
1300 734 318 or visit www.corelogic.com.au
CoreLogic Home Value Index tables
National Media Release cont’d
Media enquiries contact: Mitch Koper, CoreLogic national communications manager:
1300 472 767 or media@corelogic.com.au
Capital Growth to 31 December 2016 Sydney Melbourne
Brisbane -
Gold Coast Adelaide Perth
Australia
5 Capitals
(ASX) Hobart Darwin Canberra Brisbane
Australia
8 Capitals
Table 1A: All Dwellings
Month 0.9% 3.1% 0.6% -2.0% 1.4% 1.4% 3.3% -0.1% -0.3% 0.6% 1.4%
Quarter 2.4% 2.4% 1.9% -1.6% 2.8% 2.1% 2.1% 5.9% 0.2% 1.8% 2.1%
Year-to-Date 15.5% 13.7% 4.4% 4.2% -4.3% 10.8% 11.2% 0.9% 9.3% 3.6% 10.9%
Year-on-Year 15.5% 13.7% 4.4% 4.2% -4.3% 10.8% 11.2% 0.9% 9.3% 3.6% 10.9%
Total Return Year-on-Year 19.2% 17.1% 9.0% 8.6% -0.6% 14.6% 17.2% 6.1% 13.9% 8.1% 14.7%
Median price* based on settled sales over quarter $852,000 $641,200 $495,000 $425,000 $490,000 $615,000 $345,000 $495,500 $595,000 $486,000 $615,000
Table 1B: Houses
Month 1.3% 3.3% 0.5% -2.0% 1.6% 1.7% 3.5% -0.3% -0.3% 0.7% 1.7%
Quarter 2.7% 2.8% 2.0% -1.6% 2.9% 2.4% 2.4% 3.7% 0.2% 2.1% 2.4%
Year-to-Date 16.7% 15.1% 4.6% 4.5% -4.4% 11.6% 11.7% -0.2% 9.6% 4.0% 11.6%
Year-on-Year 16.7% 15.1% 4.6% 4.5% -4.4% 11.6% 11.7% -0.2% 9.6% 4.0% 11.6%
Total Return Year-on-Year 20.3% 18.4% 9.1% 8.8% -0.7% 15.2% 17.7% 5.0% 14.1% 8.4% 15.3%
Median price* based on settled sales over quarter $991,000 $720,000 $537,000 $448,000 $512,000 $654,000 $375,000 $515,000 $660,000 $520,000 $650,000
Table 1C: Units
Month -0.9% 1.2% 1.4% -2.1% -1.0% -0.2% 1.1% 0.6% -0.1% 0.2% -0.3%
Quarter 1.0% -1.8% 1.2% -0.4% 1.4% 0.3% -0.9% 15.4% 0.0% -0.6% 0.2%
Year-to-Date 9.6% 1.7% 2.3% 1.1% -3.2% 6.0% 6.7% 5.7% 5.1% -0.2% 5.9%
Year-on-Year 9.6% 1.7% 2.3% 1.1% -3.2% 6.0% 6.7% 5.7% 5.1% -0.2% 5.9%
Total Return Year-on-Year 14.1% 6.0% 7.9% 5.9% 1.1% 10.5% 12.6% 10.5% 10.6% 5.2% 10.4%
Median price* based on settled sales over quarter $722,600 $507,200 $400,000 $356,500 $405,000 $530,500 $280,000 $460,000 $425,000 $390,000 $536,000
Table 1D: Rental Yield Results
Houses 2.8% 2.7% 4.1% 4.0% 3.6% 3.1% 5.1% 4.9% 4.1% 4.1% 3.1%
Units 3.9% 4.1% 5.2% 4.7% 4.2% 4.1% 5.7% 3.6% 5.2% 5.2% 4.1%

2017 01-core logic-home-value_index

  • 1.
    Region Month QtrYOY Sydney 0.9% 2.4% 15.5% 19.2% $852,000 Melbourne 3.1% 2.4% 13.7% 17.1% $641,200 Brisbane 0.6% 1.8% 3.6% 8.1% $486,000 Adelaide -2.0% -1.6% 4.2% 8.6% $425,000 Perth 1.4% 2.8% -4.3% -0.6% $490,000 Hobart 3.3% 2.1% 11.2% 17.2% $345,000 Darwin -0.1% 5.9% 0.9% 6.1% $495,500 Canberra -0.3% 0.2% 9.3% 13.9% $595,000 Combined capitals 1.4% 2.1% 10.9% 14.7% $615,000 Rest of State* 1.1% 2.0% 2.8% $380,000 Median dwelling price Change in dwelling values Total gross returns * Rest of state change in values are for houses only to end of November 2016 National Media Release CoreLogic Hedonic Home Value Index, December 2016 Results Released: January 3, 2017 Capital city dwelling values surge 10.9% higher over the 2016 calendar year Capital gains accelerated over the past year, taking the calendar year growth rate to the fastest pace since 2009, according to the December CoreLogic Home Value Index Cumulative change in dwelling values from Jan 2009 to current (Post GFC growth) Change in dwelling values over past twelve months Highlights over the three months to December 2016 • Best performing capital city: Darwin +5.9% • Weakest performing capital city: Adelaide -1.6% • Highest rental yields: Hobart houses with gross rental yield of 5.1% and Hobart Units at 5.7% • Lowest rental yields: Melbourne houses with gross rental yield of 2.7% and Darwin units at 3.6% • Most expensive city: Sydney with a median dwelling price of $852,000 • Most affordable city: Hobart with a median dwelling price of $345,000 Index results as at December 31, 2016 Annual change in dwelling values over past 10 years Change in dwelling values over growth cycle to date December 2016 saw capital city dwelling values rise by 1.4%, taking the annual capital gain for 2016 to 10.9%; the highest growth rate for a calendar year since 2009. Factoring in gross rental yields and capital gains, housing as an asset class, earned a total annual return of 14.7% based on the combined capital cities index results. Across Australia’s capital cities, the annual change in dwelling values for 2016 ranged from -4.3% in Perth to 15.5% in Sydney, with Melbourne and Hobart also showing annual capital gains higher than 10%. CoreLogic head of research Tim Lawless said, “Capital city growth rates have also shown a growing divergence between the broad housing product types. Over the past twelve months we have seen capital city house values rise by 11.6%, while unit values have increased by roughly half the pace at 5.9%.” “The divergence in growth rates is the most distinct in Melbourne and Brisbane, where concerns around unit oversupply have eroded buyer confidence. Melbourne house values are up 15.1% over the year compared with a 1.7% rise in unit values, while Brisbane house values are 4.0% higher over the year, with unit values falling by -0.2%.” Australia’s regional housing markets generally did not experience the same growth conditions as the capital cities, with annual growth to November recorded at 2.8% across the combined regional markets. Regional New South Wales showed the strongest growth conditions, with non-capital city house values rising 7.3% over the 12 month period to November 2016. According to Mr Lawless, the remaining rest-of-state regions showed relatively sedate conditions, with values rising by half a per cent across regional Victoria, 1% across regional Queensland and 1.1% across regional South Australia. Regional Western Australia recorded a 7% fall in house values over the year. “Mr Lawless said, “Those regional areas with intrinsic ties to the mining and resources sector have continued to record weaker housing market conditions since the end of the mining infrastructure boom, with Perth and Darwin recording the weakest housing market conditions across the capital cities. “Since values peaked in these markets during 2014, values have fallen by a cumulative 7.9% in Perth and 5.9% in Darwin. More recently both these markets have shown signs of moving through the low point of their respective downturns, with values rising by 2.8% and 5.9% respectively over the final quarter of 2016." Based on the annual housing market results, Mr Lawless said it is clear that housing markets across Australia have responded to regional differences in economic and demographic trends; strong population growth and economic activity have driven value growth in Sydney and Melbourne, however, more recently strong growth trends have spread to Hobart and Canberra, as well as many of the coastal and lifestyle markets where values are now also rising swiftly. Post Global Financial Crisis, the CoreLogic index results show that Sydney’s dwelling values have almost doubled, rising by 97.5% since January 2009, whilst Melbourne dwelling values have increased by 83.5% over the same time frame. Every other capital city has seen dwelling values rise at substantially lower rates over this period, highlighting just how strong the Sydney and Melbourne housing market conditions have been over the past 8 years. Mr Lawless said, “Sydney-siders saw dwelling values increase by approximately $10,000 per month over the past year, creating a significant boost in wealth for home owners; at the same time we’ve seen mounting affordability challenges for aspiring home owners.” The recent CoreLogic Housing Affordability Report shows Sydney dwelling prices were 8.3 times higher than annual household incomes and households were dedicating an average of 44.5% of their income to service a mortgage (based on an 80% loan to valuation ratio and the average discounted variable mortgage rate).
  • 2.
    Monthly settled dwellingsales, national The rental yield profile has also deteriorated substantially over the current housing growth cycle, with yields progressively pushing to new record lows over the year. The December results showed the average gross yield for capital city houses was 3.1% and unit yields were tracking at 4.1%. At the beginning of the current growth cycle, which commenced in June 2012, the yield profile was much healthier, with gross yields averaging 4.2% and 4.8% respectively. While rental yields have compressed across most of the capitals, the record lows are largely being driving by the Melbourne and Sydney housing markets, where dwelling values have appreciated at a substantially faster rate than rents. Over the growth cycle to date, Sydney dwelling values are up 69% while rents have increased by approximately 10%; this has caused the gross dwelling yield to fall from 4.5% in June 2012 to the current record low of 3.0%. Similarly, in Melbourne, dwelling values are 51% higher over the cycle to date, while rents have risen by a much lower 9.6%. The divergence between dwelling value growth and rental growth has compressed Melbourne’s gross yield profile to a new record low of 2.9% from 3.8% in June 2012. Mr Lawless said, “Considering the trends in value growth remain strong and rental conditions are comparatively sedate, there is a high likelihood that yields may drift even lower during 2017.” Transaction numbers recorded their normal seasonal fall in December, however comparing CoreLogic estimates of turnover with the same time last year highlights that dwelling sales remain slightly lower than a year ago, despite an upwards trend in activity over the second half of 2016. Several regions have bucked the trend towards lower home sales, with the number of sales rising compared with last year across the Northern Territory, Australian Capital Territory and South Australia. Gross rental yields, houses and units Houses Units National Media Release cont’d CoreLogic Hedonic Home Value Index Results Media enquiries contact: Mitch Koper, CoreLogic national communications manager: 1300 472 767 or media@corelogic.com.au Houses Units CoreLogic estimates that there were approximately 465,500 dwelling sales over the 2016 calendar year, which was 8.7% lower than a year ago and 3.8% lower than the ten year average. Mr Lawless said, “Lower sales aren’t necessarily due to lower housing demand. In most markets, the slowdown in turnover is more attributable to a shortage of stock available for sale rather than a lack of buyer demand. Low stock levels have fueled a sense of urgency amongst buyers and contributed to short selling times and minimal discounting from vendors.” Looking ahead across 2017, Mr Lawless noted that the housing market is likely to face some headwinds that may result in a moderation in growth rates. He said, “Mortgage rates were already trending higher towards the end of 2016, despite any movements in the Reserve Bank cash rate; higher mortgage rates have the potential to quell housing demand, especially considering the record-high levels of household debt which implies consumers are highly sensitive to changes in the cost of debt.” “We’re also seeing high levels of supply weighing down the rate of capital gains in the unit sector. “With the peak in unit construction due over the coming year, potentially lower unit valuations relative to the off-the-plan contract price, may cause some disruption to the settlement process.” Additionally, CoreLogic noted that regulators may consider implementing policies aimed at reducing investment activity in the housing market. Based on ABS housing finance data, investors have been progressively increasing their share of mortgage demand since the May and August rate cuts last year. The latest data shows investors now comprise 49% of mortgage demand, excluding refinanced loans. Mr Lawless said, “With rental yields at record lows, it is logical to assume investors are largely speculating on future capital gains in dwelling values and disregarding the low yield profile. If housing market investment activity does reduce, it has the potential to mitigate some of the upwards pressure on home values.” “Organic factors may also contribute to a reduction in buyer demand and growth rates such as fewer buyers who can afford high housing prices, particularly in Sydney and Melbourne where values have increased substantially more than in other cities.” “Consumer confidence may also affect buyer demand. There is a high correlation between consumer confidence and housing turnover; so if confidence measures continue to track lower we can expect consumers to be less willing to make high commitment decisions such as purchasing a property. While we expect 2017 dwelling values to rise at a lower rate than in 2016, there is still potential for further growth across Australia’s housing market. “Smaller capital cities such as Canberra and Hobart have demonstrated an accelerating growth trend and recent CoreLogic data suggests that Darwin and Perth may be approaching, or moving through the bottom of the downturn. “Lifestyle markets are also becoming more popular as tourism improves and home owners look to leverage their new found equity,” Mr Lawless said.
  • 3.
    The indices ingrey shading have been designed for trading environments in partnership with the Australian Securities Exchange (www.asx.com.au). Indices under blue shading (Hobart, Darwin, Canberra, Brisbane and the 8 capital city aggregate) are calculated under the same methodology however are not currently planned to be part of the trading environment. *The median price is the middle price of all settled sales over the three months to the end of the final month. Median prices are provided as an indicator of what price a typical home sold for over the most recent quarter. The median price has no direct relationship with the CoreLogic Hedonic Index value. The change in the Index value over time reflects the underlying capital growth rates generated by residential property in the relevant region. The CoreLogic Hedonic Index growth rates are not ordinarily influenced by capital expenditure on homes, compositional changes in the types of properties being transacted, or variations in the type and quality of new homes manufactured over time. The CoreLogic ‘index values’ are not, therefore, the same as the ‘median price’ sold during a given period. See the methodology below for further details. Methodology: The CoreLogic Hedonic Home Value Index is calculated using a hedonic regression methodology that addresses the issue of compositional bias associated with median price and other measures. In simple terms, the index is calculated using recent sales data combined with information about the attributes of individual properties such as the number of bedrooms and bathrooms, land area and geographical context of the dwelling. By separating each property comprising the index into its various formational and locational attributes, differing observed sales values for each property can be separated into those associated with varying attributes and those resulting from changes in the underlying residential property market. Also, by understanding the value associated with each attribute of a given property, this methodology can be used to estimate the value of dwellings with known characteristics for which there is no recent sales price by observing the characteristics and sales prices of other dwellings which have recently transacted. It then follows that changes in the market value of the stock of residential property comprising an index can be accurately tracked through time. CoreLogic owns and maintains Australia's largest property related database in Australia which includes transaction data for every home sale within every state and territory. CoreLogic augments this data with recent sales advice from real estate industry professionals, listings information and attribute data collected from a variety of sources. For detailed methodological information please visit www.corelogic.com.au Recent updates to the CoreLogic Hedonic Home Value Index – April/May 2016 CoreLogic's periodic audits of analytic methods and algorithms identified an improvement to the Hedonic Index sampling methodology in early 2016 which was applied throughout April. CoreLogic implemented a dynamic mechanism for excluding extreme (outlier) transactions. After rigorous back testing and validation, it was determined that dynamic price filters would deliver a more robust and precise output. As a result of these changes, the CoreLogic Hedonic Index recorded higher than normal intra-month volatility in the capital city index readings throughout April and May. This improvement will ensure that the Hedonic Home Value Index will continue to represent the timeliest and most precise measurement of housing market conditions available. For more information on the CoreLogic Indices, please go to http://www.corelogic.com.au About CoreLogic CoreLogic Australia is a wholly owned subsidiary of CoreLogic (NYSE: CLGX), which is the largest property data and analytics company in the world. CoreLogic provides property information, analytics and services across Australia, New Zealand and Asia, and recently expanded its service offering through the purchase of project activity and building cost information provider Cordell. With Australia’s most comprehensive property databases, the company’s combined data offering is derived from public, contributory and proprietary sources and includes over 500 million decision points spanning over three decades of collection, providing detailed coverage of property and other encumbrances such as tenancy, location, hazard risk and related performance information. With over 20,000 customers and 150,000 end users, CoreLogic is the leading provider of property data, analytics and related services to consumers, investors, real estate, mortgage, finance, banking, building services, insurance, developers, wealth management and government. CoreLogic delivers value to clients through unique data, analytics, workflow technology, advisory and geo spatial services. Clients rely on CoreLogic to help identify and manage growth opportunities, improve performance and mitigate risk. CoreLogic employs over 650 people across Australia and in New Zealand. For more information call 1300 734 318 or visit www.corelogic.com.au CoreLogic Home Value Index tables National Media Release cont’d Media enquiries contact: Mitch Koper, CoreLogic national communications manager: 1300 472 767 or media@corelogic.com.au Capital Growth to 31 December 2016 Sydney Melbourne Brisbane - Gold Coast Adelaide Perth Australia 5 Capitals (ASX) Hobart Darwin Canberra Brisbane Australia 8 Capitals Table 1A: All Dwellings Month 0.9% 3.1% 0.6% -2.0% 1.4% 1.4% 3.3% -0.1% -0.3% 0.6% 1.4% Quarter 2.4% 2.4% 1.9% -1.6% 2.8% 2.1% 2.1% 5.9% 0.2% 1.8% 2.1% Year-to-Date 15.5% 13.7% 4.4% 4.2% -4.3% 10.8% 11.2% 0.9% 9.3% 3.6% 10.9% Year-on-Year 15.5% 13.7% 4.4% 4.2% -4.3% 10.8% 11.2% 0.9% 9.3% 3.6% 10.9% Total Return Year-on-Year 19.2% 17.1% 9.0% 8.6% -0.6% 14.6% 17.2% 6.1% 13.9% 8.1% 14.7% Median price* based on settled sales over quarter $852,000 $641,200 $495,000 $425,000 $490,000 $615,000 $345,000 $495,500 $595,000 $486,000 $615,000 Table 1B: Houses Month 1.3% 3.3% 0.5% -2.0% 1.6% 1.7% 3.5% -0.3% -0.3% 0.7% 1.7% Quarter 2.7% 2.8% 2.0% -1.6% 2.9% 2.4% 2.4% 3.7% 0.2% 2.1% 2.4% Year-to-Date 16.7% 15.1% 4.6% 4.5% -4.4% 11.6% 11.7% -0.2% 9.6% 4.0% 11.6% Year-on-Year 16.7% 15.1% 4.6% 4.5% -4.4% 11.6% 11.7% -0.2% 9.6% 4.0% 11.6% Total Return Year-on-Year 20.3% 18.4% 9.1% 8.8% -0.7% 15.2% 17.7% 5.0% 14.1% 8.4% 15.3% Median price* based on settled sales over quarter $991,000 $720,000 $537,000 $448,000 $512,000 $654,000 $375,000 $515,000 $660,000 $520,000 $650,000 Table 1C: Units Month -0.9% 1.2% 1.4% -2.1% -1.0% -0.2% 1.1% 0.6% -0.1% 0.2% -0.3% Quarter 1.0% -1.8% 1.2% -0.4% 1.4% 0.3% -0.9% 15.4% 0.0% -0.6% 0.2% Year-to-Date 9.6% 1.7% 2.3% 1.1% -3.2% 6.0% 6.7% 5.7% 5.1% -0.2% 5.9% Year-on-Year 9.6% 1.7% 2.3% 1.1% -3.2% 6.0% 6.7% 5.7% 5.1% -0.2% 5.9% Total Return Year-on-Year 14.1% 6.0% 7.9% 5.9% 1.1% 10.5% 12.6% 10.5% 10.6% 5.2% 10.4% Median price* based on settled sales over quarter $722,600 $507,200 $400,000 $356,500 $405,000 $530,500 $280,000 $460,000 $425,000 $390,000 $536,000 Table 1D: Rental Yield Results Houses 2.8% 2.7% 4.1% 4.0% 3.6% 3.1% 5.1% 4.9% 4.1% 4.1% 3.1% Units 3.9% 4.1% 5.2% 4.7% 4.2% 4.1% 5.7% 3.6% 5.2% 5.2% 4.1%