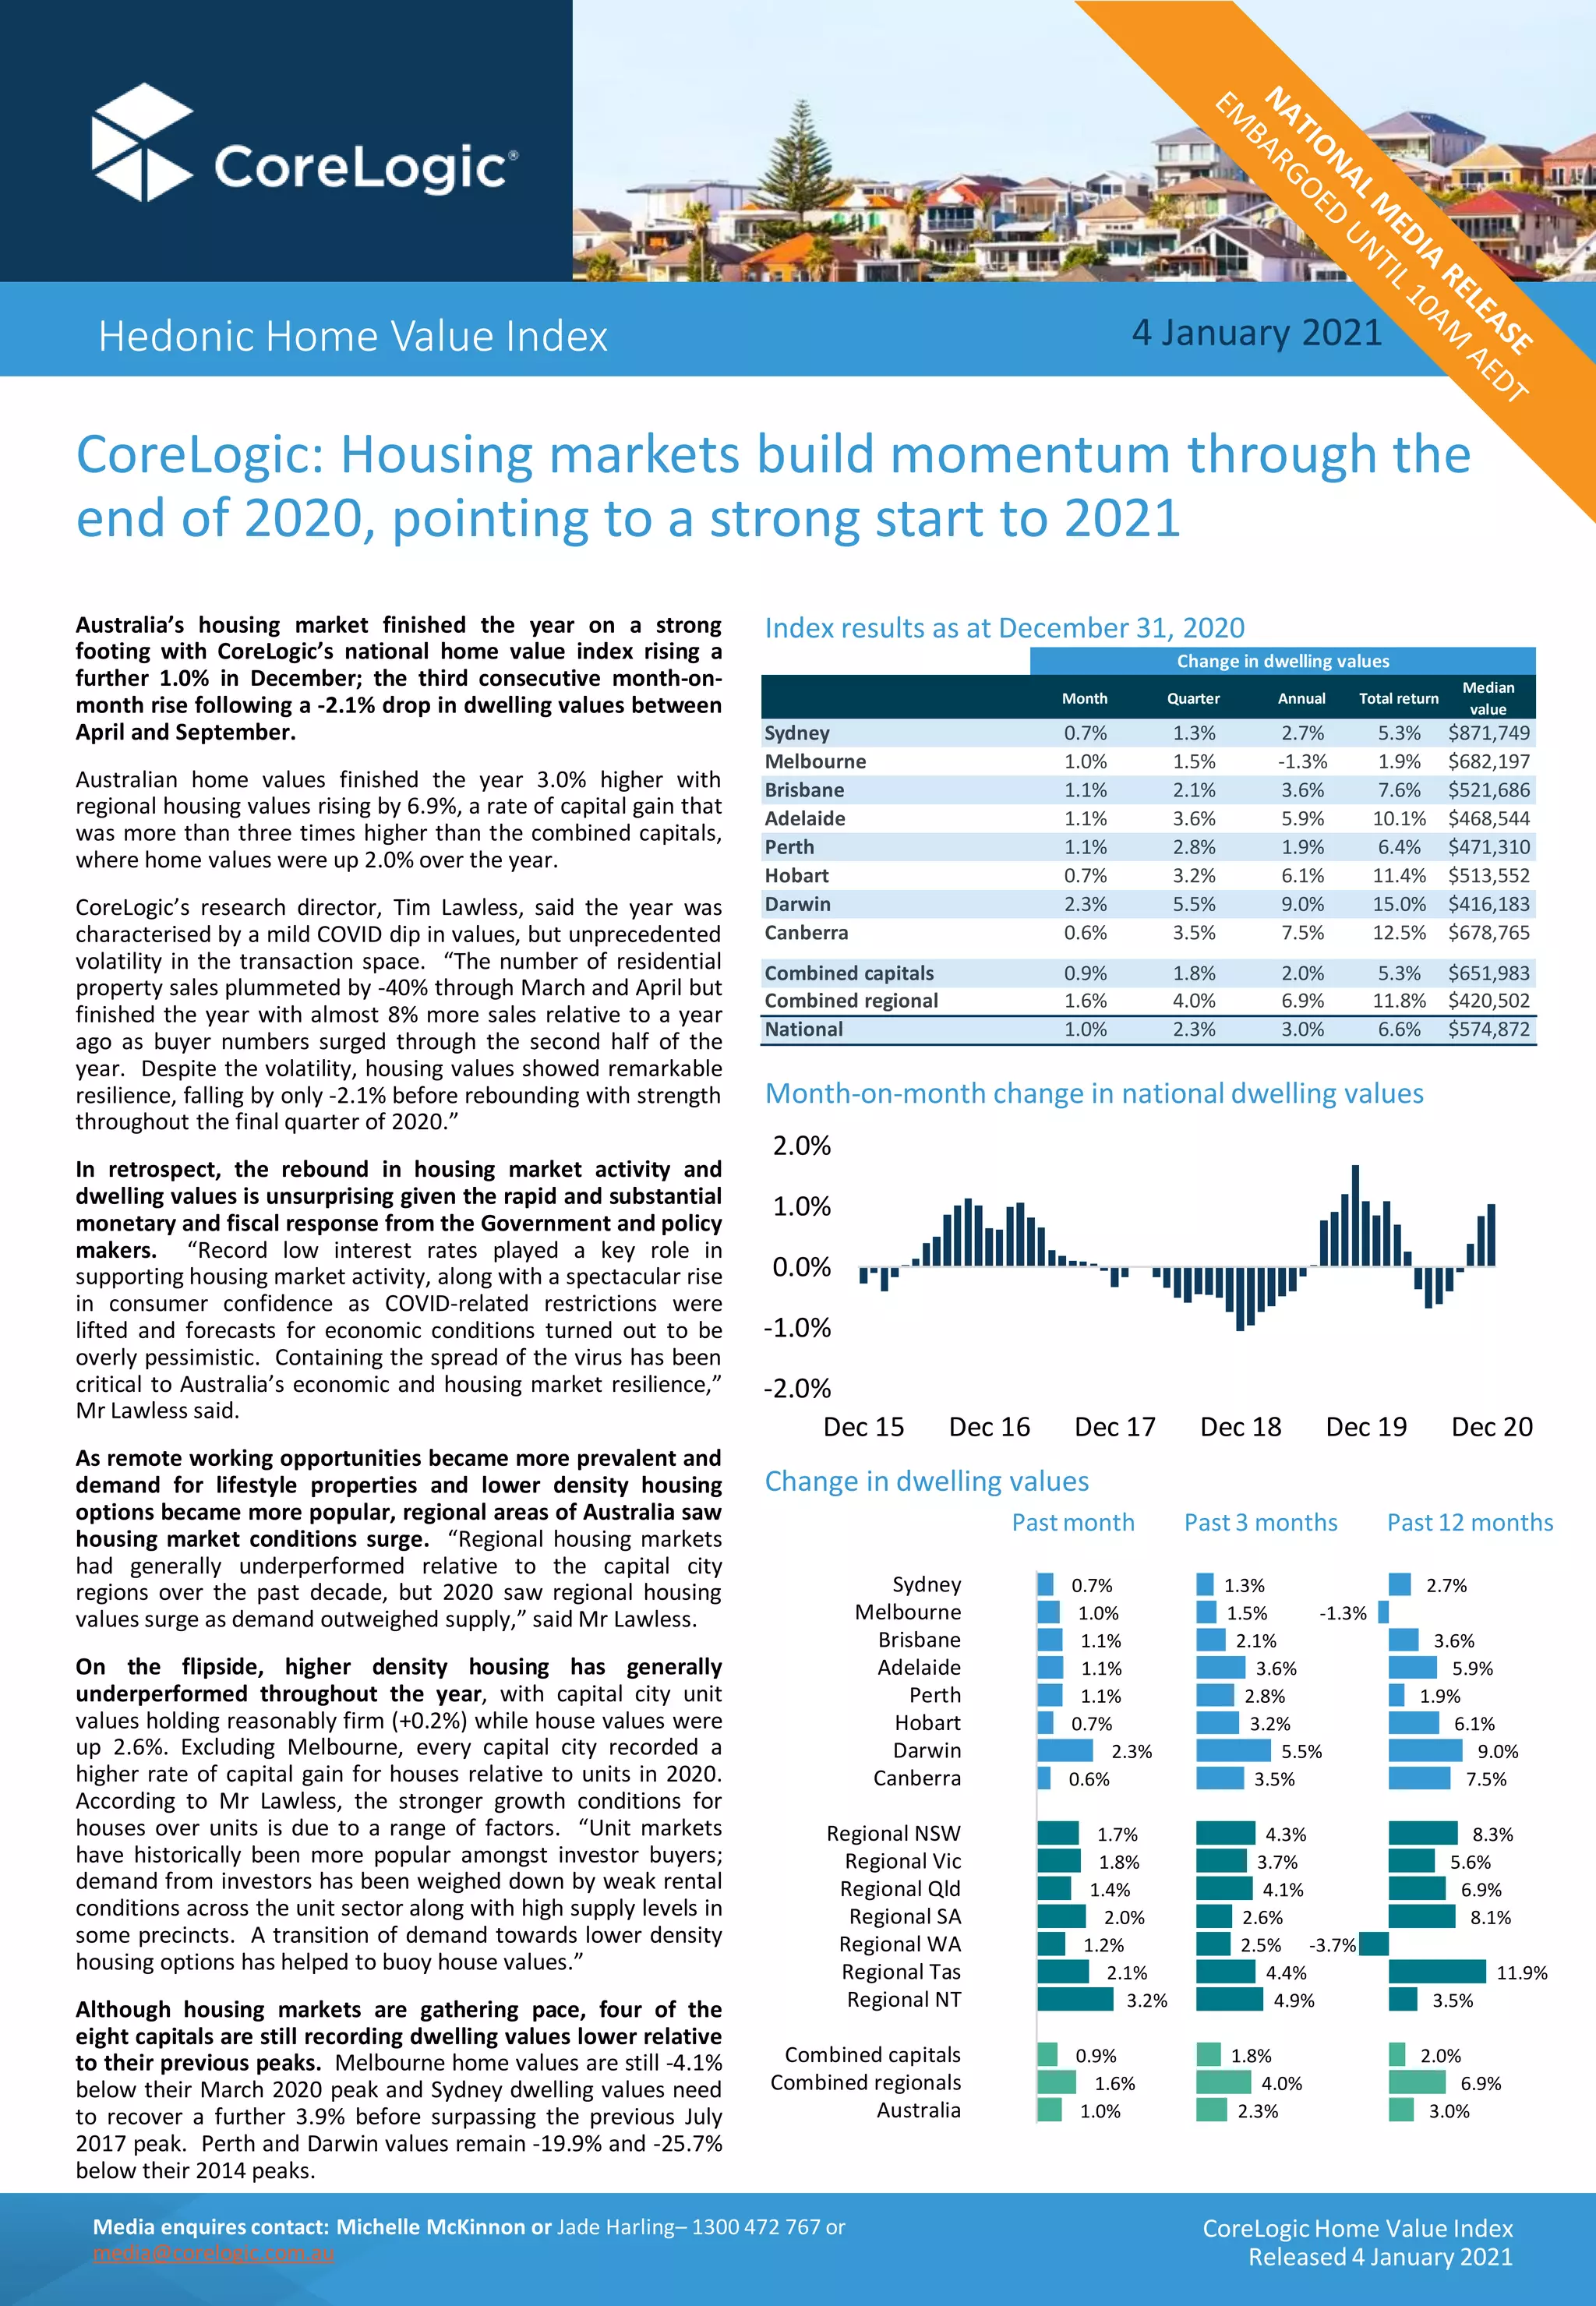
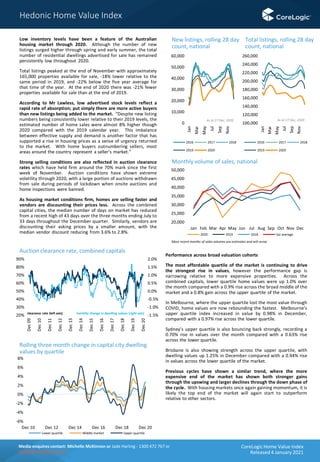
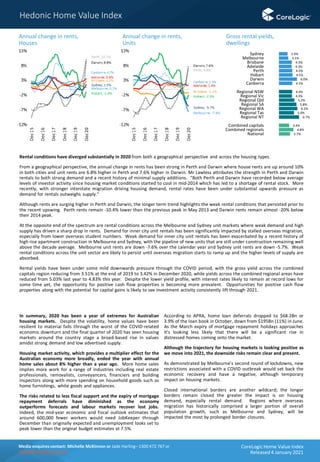
Australian housing values finished the year 3.0% higher according to data released by @corelogicau today. The growth rate for regional housing values (+6.9%) was more than three times higher than the pace of growth across the capital cities (+2.0%)
The national monthly increase of 1.3% is the slowest rate of growth since January 2021 when values rose 0.9%. The annual increase of 22.2% has added approximately $126,700 to the median value of an Australian home in the last 12 months.
Beyond the headline figure, capital city and regional home values are diversifying as stock levels rise and affordability decreases. Houses continue to outperform units, regional markets and rental growth remain strong and a rise in listings is contributing to a subtle softening in vendor metrics such as days on market and auction clearance rates.
Will it be a hot, warm or cool summer for the market?
CoreLogic head of research Tim Lawless said, “Although housing values were generally slightly positive over the month, the trend has clearly weakened since mid-to-late March, when social distancing policies were implemented and consumer sentiment started to plummet.”
The capital city markets generally showed a weaker performance relative to the regional markets, with the combined capital cities index up 0.2% in April compared with a 0.5% rise across the combined regional markets.
CoreLogic December 2016 Hedonic Home Value Index
Released: Tuesday 3 January, 2017
Capital gains accelerated over the past year, taking the calendar year growth rate to the fastest pace since 2009, according to the December CoreLogic Home Value Index.
• December 2016 saw capital city dwelling values rise by 1.4%, taking the annual capital gain for 2016 to 10.9%
• Capital city house values rose by 11.6% over the past 12 months
Capital city unit values increased by 5.9% over the past 12 months
• The May home value results should be viewed in the context of demonstrated seasonality; values have fallen during May in four of the past five years
• Reading through the seasonality indicates that value growth in the market has lost momentum, particularly in Sydney and Melbourne where affordability constraints are more evident and investors have comprised a larger proportion of housing demand
Single-Family Rentals | Q2 2020 | Arbor Realty Trust, Inc. Ivan Kaufman
The growing acceptability and adoption of work-from-home setups are framing housing decisions across the board, boosting demand for exurban housing options. However, as many of the accommodative features in the CARES act expire, the likelihood of increased tenant performance issues in the coming months remain high. All else equal, while the single-family rental sector will continue to work some COVID-related performance issues, it is as well insulated as any residential product type over the medium term.
Physicians Agent™ Network is the country’s leader in offering real estate solutions to all doctors. Thousands of physicians visit us every month to review loan programs, relocation services and find 5-Star local real estate agents. If you are looking to attract new physician buyers you have come to the right place. We will teach you about leveraging your marketing with the Physicians Agent™ designation that physicians look for when seeking “doctor friendly” REALTORS®.
The latest Monthly Housing & Economic Chart Pack from CoreLogic provides a detailed national market update with a focus on capital city housing market conditions and performance over time. • Combined capital city home values increased by 1.4% in December 2016 with values higher across all capital cities except for Adelaide, Darwin and Canberra.
Throughout the 2016 calendar year, dwelling values increased by 10.9% which was their greatest calendar year increase since 2009.
This Month in Real Estate, September 2001, is brought to you by Paul W. Drury, Real Estate Broker with Keller Williams Realty Greater Cleveland West. It is a collection of national news, information, and statistics as well as information specific to the North Central Ohio Region between Lakewood and Sandusky and south to the Lodi / Ashland Area.
Small Multifamily Loans | Arbor Q4 2019Ivan Kaufman
Small multifamily represents a third of the rental market. The nation’s rental market had a total of 41.9 million renter-occupied housing units, as of 2018. Small multifamily, which includes apartment properties of 5 to 49 units, represented 33% (13.7 million) of the total rental market.
January marked a new record for how much and how fast dwelling
values have fallen in Australia. Based on the monthly index, the
national HVI is down -8.9% since peaking in April last year, making this
the largest and fastest decline in values since at least 1980 when
CoreLogic’s records began.
So far, Brisbane (-10.8%*
) and Hobart (-10.8%) have registered the
largest declines on record for those cities. Sydney home values are down
-13.8% and not far from surpassing the 2017-19 drop of -14.9% to set a
new decline record.
Brisbane (1.4%)
CoreLogic’s national Home Value Index (HVI) has recorded a third consecutive monthly rise, with the pace of growth accelerating sharply to 1.2% in May.
After finding a floor in February, home values increased 0.6% and 0.5% through March and April respectively.
Sydney continues to lead the recovery trend, posting a 1.8% lift in values over the month, recording the city’s highest monthly gain since September 2021. Since moving through a trough in January, home values have risen by 4.8%, or the equivalent of a $48,390 lift in the median dwelling value.
Brisbane (1.4%) and Perth (1.3%) are the only other capitals to record a monthly gain of more than 1.0%, however, the rise in values was broad-based with the rate of growth accelerating across every capital city last month.
CoreLogic’s Research Director, Tim Lawless, noted the positive trend is a symptom of persistently low levels of available housing supply running up against rising housing demand.
“Advertised listings trended lower through May with roughly 1,800 fewer capital city homes advertised for sale relative to the end of April. Inventory levels are -15.3% lower than they were at the same time last year and -24.4% below the previous five-year average for this time of year,” he said.
“With such a short supply of available housing stock, buyers are becoming more competitive and there’s an element of FOMO creeping into the market. Amid increased competition, auction clearance rates have trended higher, holding at 70% or above over the past three weeks. For private treaty sales, homes are selling faster and with less vendor discounting.”
The trend in regional housing values has also picked up, with the combined regionals index rising half a percent in April, following a 0.2% and 0.1% rise in March and April.
“Although regional home values are trending higher, the rate of gain hasn’t kept pace with the capitals. Over the past three months, growth in the combined capitals index was more than triple the pace of growth seen across the combined regionals at 2.8% and 0.8% respectively,” Mr Lawless said.
“Although advertised housing supply remains tight across regional Australia, demand from net overseas migration is less substantial. ABS data points to around 15% of Australia’s net overseas migration being centered in the regions each year. Additionally, a slowdown in internal migration rates across the regions has helped to ease the demand side pressures on housing.”
Premium housing markets in Sydney continue to lead the recovery trend. After recording a larger drop in values, Sydney’s upper quartile (the most expensive quarter) stands out with the highest rate of growth, gaining 5.6% over the past three months compared with a 2.6% rise in more affordable lower quartile values.
“Buyers targeting the premium sector of the market are still buying at well below peak prices,” Mr Lawless said.
“Although values across more expensive homes are rising more rapidly, ......
Capital city dwelling values increase by 1.0% in September
The latest CoreLogic Hedonic Home Value Index reveals further gains across most capital city housing markets last month, taking the current growth phase into its 52nd month.
CoreLogic Research Director, Tim Lawless, noted the most
substantial reduction in growth has occurred in Sydney.
“After leading the upswing, the monthly pace of growth in Sydney
housing values has halved from a recent high of 1.8% in May to 0.9%
in July. Sydney has also seen a significant rise in the number of
fresh listings added to the market, 9.9% higher than the same time
last year and 18.0% above the previous five-year average. An
increased flow of new listings provides more choice and may be
working to reduce some of the urgency felt among prospective
buyers,” he said.
Brisbane and Adelaide saw the monthly pace of growth
accelerate in July, leading the pace of gains across the capitals
with housing values up 1.4% across both cities. Although the trend
in new listings has risen in these cities, Mr Lawless said the number
remains well below levels from a year ago and the previous five
year average.
Canberra was the only capital city to record a decline in values in
July, down -0.1%, while Hobart values were unchanged.
The slowdown in value growth has mostly been driven by an
easing in gains across the upper quartile of the market.
Via Corelogic RPData
2022 was a tumultuous year for Australia’s housing market.
Following outstanding capital growth over 2021 and into early 2022, successive interest rate rises, surging inflation, low consumer sentiment and deteriorating affordability drove a shift in the performance of residential real estate.
Today, we released our annual Best of the Best report; a seminal publication which sums up the country’s annual property performance and provides an outlook for the year ahead.
The strongest capital city sub-regions were confined to Hobart,
Canberra, Brisbane and Adelaide where housing prices are generally
more affordable relative to household incomes (although housing
affordability has rapidly deteriorated across Hobart). Outside of Hobart,
where dwelling values were 8.7% higher over the year, even the best
performing regions returned a relatively mild annual growth rate. Seven
of the top ten sub-regions returned an annual gain of less than 3%. Mr
Lawless said, “Such a soft result amongst the best performing areas
highlights that housing market weakness is broad-based and not just
confined to Sydney and Melbourne.”
Australia's home prices likely rose at a slightly faster pace in August (+1%) compared with July (+0.8%), based on CoreLogic's daily 5 capital city index. Brisbane (inc Gold Coast) prices are up 1.4% with Sydney and Adelaide prices both 1.1% higher.
Adelaide and Perth are the only capital cities at new highs, Brisbane is still below it's high in March 2022 based on this data (which includes the Gold Coast), though on the ground in Brisbane we are seeing data points of new all time highs in our target areas.
CoreLogic August 2016 Home Value Index
Released: Thursday 1 September, 2016
The CoreLogic Home Value Index recorded a 1.1% rise in dwelling values in August, with six of the eight capital cities recording a lift in dwelling values over the month.
• Dwelling values in Sydney and Melbourne continued to increase at more than 1% month-on-month
Perth and Darwin remain as the only capital cities to record a fall in dwelling values over the most recent twelve month period, declining by 4.2% in both cities.
The CoreLogic Home Value Index results for October out today confirm a 1.2% rise in national dwelling values over the month, delivering the fourth straight month of rising values.
The October result was the largest month-on-month gain in the national index since May 2015. The recent gains come after a broad-based decline in housing values, with the national index declining 8.4% between October 2017 and June 2019. The positive October result takes national dwelling values 2.9% off their June 2019 floor, however values remain 5.7% below their peak, highlighting that despite the recent gains, home values are at a similar level to where they were three years ago.
According to CoreLogic research director Tim Lawless, the stronger rebound in Melbourne and Sydney can be attributed to a blend of factors; tighter labour market conditions and stronger population growth relative to the other capitals, coupled with the stimulatory effect of the lowest mortgage rates since the 1950’s, and improved access to credit.
Dwelling values rose by 1.1% over the month of December and by 4.0% over the quarter to finish out 2019 on a positive note according to the CoreLogic national home value index. This result represents the fastest rate of national dwelling value growth over any three month period since November 2009. Darwin was the only region amongst the capital cities and ‘rest-of-state’ areas to record a fall in values over the month, with a -0.5% decline
NEWS RELEASE:
Metro Vancouver home sales decline below historical averages in 2018
VANCOUVER, BC – January 3, 2019 –Metro Vancouver* home sales in 2018 were the lowest annual total in the region since 2000.
The Australian Residential Property
Market and Economy
► Brisbane’s annual value growth has slowed from
+2.8% a year ago to +1.1% over the past year.
House values have risen by +1.2% over the past
year and unit values are +0.7% higher.
Autumn Buyers Guide
Do your property buying research without having to spend your whole weekend searching the web. This reference guide for home buyers and investors from ING Direct will quickly bring you up to speed on house and unit prices and suburb affordability across Australia.
The Australian Residential Property Market & Economy: Quarterly Review, May 2015
Take a look at a comprehensive Australian housing market overview put together by CoreLogic RP Data.
Similar to Core logic home value index jan 2021 final (20)
The third edition of the CoreLogic
Women and Property report provides
an update to the state of home
ownership for men and women across
Australia and New Zealand as of
January 2023.
Best Regards,
Linda 姬琳达珍 and Carlos Debello (LREA)
LJ Gilland Real Estate Pty Ltd
Debello LREA推荐书LJ Gilland房地产
http://ljgrealestate.com.au/testimonials/
Foreign nationals bought up more than $55.8 billion worth of Australian property during the last financial year, down 33% as the pandemic shut the country’s borders.
The Foreign Investment Board’s annual report shows property approvals were down again, having almost halved in the space of just four years.
The report shows Chinese investment was up 16% over the same period, while Queensland is quickly becoming a “top destination” for foreign investment.
According to a variety of reported opinions, it’s Brisbane’s time to shine. The city has seen a stop- start-stagnate property market for close to a decade, with myriad factors (floods, unit oversupply, high unemployment, global pandemic) keeping our values
Our Sunshine State capital is looking even brighter as at the time of writing. While we’ve had our challenges during COVID-19 (particularly in recent weeks when a few dubious border crossings have left our population holding its collective breath……………
“The blowout in rental vacancy rates for the major CBDs suggests a mass exodus of tenants occurred over the course of March and April. This might be attributed to the significant loss in employment in our CBDs plus the drop off in international students,” he said.
Brisbane and Adelaide both saw their CBD vacancy rate double as well, albeit from smaller bases, jumping to 11.3% and 6.6% apiece.
Looking at the capital city markets as a whole, Darwin proved the only exception to rising rates across the board.
View the COVID-19 V Australian Property Report here. At a Glance:
Even with the impact of COVID-19, the experts most commonly believe in 12 months prices will be higher than they are now (27 percent of respondents).
Overwhelmingly, (72 percent) of respondents, felt that NSW would be the hardest hit.
Short Term residential rental properties, like AIRBNB and holiday homes, are in the firing line, whilst high cashflow and diversified rooming houses on fixed-term leases are highlighted as the most resilient.
Respondents said the peak COVID-19 impact would be felt between the 3 to 12-month mark from mid-March 2020
Valuing experts explore what buyers are looking for in each housing market. This is especially useful knowledge as the market establishes its direction for 2020.
FHB -6.8%
NON FHB -14%
INVESTOR'S -25.5%
Residential property market analysis
Inside these pages, you’ll find expert commentary about the market and its drivers.
The centrepiece of the report is the three-year forecasts of our capital city house and
unit prices. We also delve into the shape of our market in regional Australia.
This year our Spotlight feature “High-density missing the mark?” examines whether
medium and high-density dwellings are a positive outcome for the residential property
market and housing affordability.
Forecasts of potential 20% growth in Brisbane’s house prices, HTW have released their annual where to invest $500,000 in property, many of the middle ring of Brisbane suburbs.
HTW June report with Federal elections, finance challenges, infrastructure, industry and employment – all playing their part in this month’s submissions.
Australia’s central bank will be compelled to drop the already record-low official cash rate to 0.5 per cent within the next two years, an economist has claimed.
Speaking on a panel at NAB’s Federal Budget Analysis event on Wednesday (3 April), Jonathan Pain, economist and author of The Pain Report, said he expects the Reserve Bank of Australia (RBA) to cut the official cash rate four times in the next two years to a new record low of 0.5 per cent.
“I think the Reserve Bank is going to cut rates as soon as this election is out of the way. If we didn’t have this election in May, I think the Reserve Bank would have already been cutting rates,” Mr Pain said.
The reason the economist and author believes the RBA will decrease the cash rate by 1 percentage point (from 1.5 per cent to 0.5 per cent) is because it is unlikely that the banks would pass on the central bank’s entire rate cut to their customers.
“I’m saying 1 per cent because the banks will arguably only pass on about 60 to 65 per cent of that,” Mr Pain said.
“Don’t forget, last time they didn’t pass it on for a range of reasons. Banks always want to protect their margins.”
NAB’s chief economist of markets, Ivan Colhoun, who was on the same panel, said he believes customers would be the beneficiaries of a reduced cash rate, noting that the “minor interest rate increases” seen last year was because “funding pressures moved against the banks”, forcing them to raise their rates.
“Those pressures have been coming off recently,” Mr Colhoun said, noting that this could change.
Meanwhile, NAB is anticipating two RBA cash rate cuts by the end of 2019 to 1 per cent – a view that was expressed by a number of industry pundits.
Mr Colhoun even said a rate drop could be seen as early as next month in the lead up to the federal election.
“If they don’t cut, I think the unemployment would begin to move up,” the chief economist said.
However, he implied it might be too early to tell whether there would be any further rate cuts next year.
“If the economy turned out weaker, then the RBA would keep cutting,” Mr Colhoun said, noting that NAB’s outlook is based on the assumption that the economy would continue growing at a “reasonable” pace.
Both Mr Pain and Mr Colhoun agreed on the importance of the cash rate, which some leaders had previously lamented lost significance as it had not deterred lenders from lifting their interest rates out of cycle from late last year.
“Does it matter? Absolutely, because the majority of our mortgages in Australia are of the variable rate nature, floating rate nature. Whereas in the United States, for example, most of them are on fixed rates.
“What the cash rate setting the Reserve Bank has is very important for us from a business perspective and from a mortgage perspective.”
North Lakes appeared as one of the most searched suburbs by overseas home buyers of QLD properties such as coming from New Zealand, US, & the UK, according to realestate.com.au report.
Twelve-month data from July 2017 reveal that overseas property searches in Queensland have New Zealand as the top property hunters. Brisbane City emerged as the most searched suburb with 13,951 searches followed by Broadbeach with 9,898.
REA Group said that overseas home buyers would often check Brisbane properties first then widen their search to nearby suburbs. Such is the case of one overseas buyer who found their dream home in Aspley which he said is a place with great weather and affordable properties.
The top ten most searched suburbs are Brisbane City, Surfers Paradise, Noosa Heads, Broadbeach, Mooloolaba, Burleigh Heads, Southport, North Lakes, Caloundra, and Hope Island. Whilst UK and USA follow New Zealand, where most overseas property searchers originate. The REA Group said that European, American, and Canadian buyers are mostly drawn to Queensland’s beach and lifestyle destinations. Brisbane properties are what they would often check first, primarily because they are seeing better value for their money in Brisbane.
Rounding up the ten countries accounting for the most number of searches of the Queensland properties are Hong Kong, Philippines, Canada, Singapore, China, Japan, and South Africa.
According to the Australian Property Market Report for October from realestate.com.au, Brisbane continues to hold up well, despite tough financial conditions. Buyer demand, and rental demand and pricing are all in the green. Offshore buyer demand has seen a big increase which they attribute to the education sector and relative housing affordability.
The report says that Brisbane is gaining the confidence of the market with its better economic outlook and because of that, premium suburbs are benefiting with the subsequent rise in demand. Inner-north’s Grange and the outer south-east suburb of Chandler appeared as the top two in demand suburbs, according to the report.
Among Brisbane metro regions, East enjoys the most increase in demand year-on-year with 9.1%, followed by Brisbane Inner-city (8.2%) and North (5.0%). South and West saw declines in demand, however, year-on-year with -6.1% and -1.6% respectively.
The price growth is seen to continue over the next 12 months as Queensland economic growth will continue to propel the market.
The Australian Residential Property
Market and Economy
► Brisbane’s annual value growth has slowed from
+2.8% a year ago to +1.1% over the past year.
House values have risen by +1.2% over the past
year and unit values are +0.7% higher.
Australian Homes Achieve Over $15.6B In Re-Sale Gains Last Quarter
The latest CoreLogic Pain & Gain Report found that 89.8% of Australian homes sold during the second quarter of 2018 enjoyed a re-sale gross profit, with total re-sale gains of $15.683 billion, but the share of re-sales at a profit was the lowest since October 2013.
Spring 2018 might be finally Brisbane’s season. However, what does all this mean for Brisbane over the next six to 12 months? This year, we expect spring to have a positive effect, but in the overall scheme of things..............................
The KA Housing - Catalogue - Listing TurkeyListing Turkey
Welcome to KA Housing, a distinguished real estate development nestled in the heart of Eyüpsultan, one of Istanbul’s most promising districts.
Just 10 minutes from the bustling city center, Eyüpsultan offers a serene escape with the convenience of urban living. The direct metro line ensures seamless connectivity to all parts of Istanbul, making it an ideal location for residents who seek both tranquility and vibrancy.
KA Housing boasts unparalleled accessibility, with proximity to Istanbul Airport only 30 minutes away, facilitating easy international travel. Effortless city access is guaranteed by direct metro and transportation links to Istanbul’s cultural and commercial hubs. Quick access to key metro lines connects you to every corner of the city within minutes, making commuting and exploring the city hassle-free.
The development offers luxurious living spaces with a range of unit layouts from 1+1 to 4+1, designed with meticulous attention to detail. Each unit features balconies or terraces, providing stunning vistas of Istanbul and enhancing the living experience. High-quality materials and superior craftsmanship ensure durability and elegance, while sound-proof insulation and high ceilings (2.95 m) offer comfort and sophistication.
Residents of KA Housing enjoy exclusive on-site amenities, including a state-of-the-art gym, outdoor swimming pool, yoga area, and walking paths. Entertainment options abound with a private cinema, children’s playground, and a variety of dining options including a café and restaurant. Security and convenience are paramount with 24/7 security, a dedicated carpark garage, and an IP intercom system.
KA Housing represents a prime investment opportunity with limited availability in a high-demand area, ensuring enduring value and potential for lucrative returns. Homes in this development provide exceptional value without compromising on quality, offering affordable luxury for discerning buyers. The construction is of the highest quality, built to the latest seismic and disaster resistance standards, ensuring safety and resilience.
The community and surroundings of KA Housing are enriched by close proximity to prestigious universities such as Haliç University, Bilgi University, and Istanbul Ticaret University, making it an ideal location for students and academics. The development is adjacent to the Alibeyköy stream leading into the Halic waters, offering serene natural escapes amidst lush greenery. Residents can enjoy the cultural richness of the area, surrounded by historical and cultural landmarks that blend leisure, nature, and culture seamlessly.
https://listingturkey.com/property/the-ka-housing/
Lixin Azarmehr, a Los Angeles-based real estate development trailblazer, co-founded JL Real Estate Development (JL RED) in 2015 and serves as its CEO. Her expertise has propelled the firm to specialize in luxury residential and mixed-use commercial projects, with a portfolio that features upscale retail spaces and sophisticated care facilities.
Simpolo Tiles & Bathware
Tile ho,
toh Simpolo.
Since the first steps were taken in 1977, Simpolo Ceramics has carved its niche as a consistently growing organisation with unparalleled innovation and passion rooted in simplicity.
We endure gratification for every experience we offer, created to share something meaningful. It may not resonate with the majority, but that makes us a class apart. If only a handful were to understand the purpose of our existence, we would be proud to have found our believers. Rather, people with whom we can share our beliefs.
VISUALIZER
Design your space in your style with our very own Visualizer. Now, you can choose the tiles of your liking from our wide selection and see how they would look in a space. Select the tile from the multiple options and the visualiser will replace the surfaces in the image with the selected tiles. This way, instead of just your imagination, you can choose the tiles for your place by getting an actual picture of how they would look in a space. So, design your space the way you desire digitally and implement it in real life to get the best results!
You can also share this visualiser with others to help them design their space.
Committed to delighting customers with world-class ceramic products and services. Make Simpolo synonymous with the best quality and set new benchmarks of excellence for all stakeholders. Pursue best business practices with utmost integrity to make Simpolo an exciting organisation to work with, for vendors, channel partners, investors and employees alike.
Gain worldwide recognition in the field of ceramic building products through Research and Innovation and bring an enhanced lifestyle within reach for every household.
Rixos Tersane Istanbul Residences Brochure_May2024_ENG.pdfListing Turkey
Tersane Suites Residences is a luxurious real estate project located in the heart of Istanbul, next to the beautiful Golden Horn. This unique development offers hotel concept residences with Rixos management, making it the perfect choice for both homeowners and investors.
The Tersane Suites Residences offers a wide range of options, from studio apartments to spacious four-bedroom units, all designed to the highest standard. The suites are finished with high-quality materials and feature modern, open-plan living spaces, fully-equipped kitchens, and large balconies with stunning views of the city and sea.
One of the standout features of Tersane Suites Residences is the Rixos management, which provides a truly exclusive and upscale living experience. Residents will have access to a range of luxury amenities, including a fitness center, spa, and indoor and outdoor swimming pools. Plus, the on-site restaurants and cafes provide a taste of the local and international cuisine.
The Tersane Suites Residences also offers a great opportunity for investors, as it provides a rental guarantee program. This means that investors can enjoy a steady income stream, with the peace of mind that their property is being managed by a reputable and experienced team.
The location of Tersane Suites Residences is also unbeatable, with easy access to the city’s main transportation links and within close proximity to the historic center, making it the perfect base for exploring all that Istanbul has to offer.
Referans Bahcesehir which is being constructed, in the center of the most regional destination as Bahçeşehir, shines out with its central location and unique landscape including social facilities such as a fitness center, sauna, sports facilities, children’s playground and recreational areas.
Not only drawing attention for immediate surroundings including commercial centers and private schools but also providing the easily accessible location with closeness to Tem Highway and connection roads, ongoing construction of 3rd Bridge Connection roads and Metro Projects
Bahcesehir is a rising value in the great city of Istanbul… Located at a new transportation junction in the northwest of the City… Located at such a spot that the access roads for the 3rd bridge and for the 3rd Airport will reach the region in 2016. The Marmaray and the Subway will extend all the way to Referans Bahcesehir respectively in 2018 and 2019.
465 flats and 34 stores are designed with an outstanding approach and arranged with a unique perspective offering the following options: 1 plus 1, 2 plus 1, 3 plus 1, 3.5 plus 1, 4 plus 1, and 4.5 plus 1. It is planned so as to safeguard you and your loved ones based upon a modern, technological safety approach. As you experience the joy and luxury here, you will be content and feet at ease.
It is worth seeing both inside and outside with heart-warming cafes, tasty restaurants and elegant stores… And it is ready to offer a vivacious social life with a warm and cozy space design.
A folding swimming pool and indoor swimming pools, playgrounds, Turkish bath, sauna… It has them all. Everything you need for your well-being and for having a pleasant time will be at your service. You simply need to align the rhythm of life with the rhythm of Referans Bahcesehir.
https://listingturkey.com/property/referans-bahcesehir/
Need MCA leads? No sweat! MCAs are great for small biz funding. Learn how to snag top-notch leads: businesses needing cash, with repayment ability, decision-makers, and accurate contacts. Use content, social ads, lead platforms, partnerships, and capture processes for quality leads.
https://www.leadgeneration.media/blog/b/streamline-your-mca-sales-process-with-pre-qualified-leads
Brigade Insignia offers meticulously designed apartments with modern architecture and premium finishes. The project features spacious 3,3.5,4 and 5 BHK units, each thoughtfully planned to provide maximum comfort, natural light, and ventilation.
https://www.newprojectbangalore.com/brigade-insignia-yelahanka-bangalore.html
Dynamics 365 Bid Management for Construction ProjectsDynamic Netsoft
This PDF provides a straightforward guide to using Dynamics 365 for efficient bid management in construction projects. Learn how to streamline processes, improve accuracy, and enhance productivity with practical tips and step-by-step instructions.
https://dnetsoft.com/dynamics-365-bid-management-software
Presentation to Windust Meadows HOA Board of Directors June 4, 2024: Focus o...Joseph Lewis Aguirre
Presentation to Windust Meadows HOA Board of Directors June 4, 2024: Focus on Public Safety as Job #1, Engagement, Wealth of HOA, Branding, Communication, Culture, Civic Responsibility
500 acres of brilliance await you here at Riverview City which offers modern living, effortless convenience, and a beautiful natural setting. It is a mega township by Magarpatta City in Loni Kalbhor, Pune. Enjoy easy access to work, schools, and fun while experiencing a perfect work-life balance.
Visit - magarpattacity.developerprojects.in
Total Environment Tangled Up In The Green - Residential Plots Where Nature an...JagadishKR1
Embark on a journey where lush landscapes and contemporary living converge at Total Environment's Tangled Up In The Green Residential Plots in Devanahalli, Bangalore. Surrounded by verdant expanses, these plots offer an idyllic setting for your dream home. Immerse yourself in the serenity of nature while enjoying the finest amenities and design, where every moment is a harmonious blend of luxury and tranquility.
Are you searching for your dream home? Finding the perfect house involves more than just browsing listings; it’s about discovering a space that fits your lifestyle and needs. Whether you’re looking for a cozy suburban home, a chic urban apartment, or a spacious rural property, the right real estate can transform your life. Consider the location, amenities, and potential for future growth. Think about the community, nearby schools, and the convenience of shopping and transportation. A good real estate agent can guide you through the process, from identifying suitable properties to negotiating the best deal. Your dream home is out there, waiting to be found – let’s embark on this journey together!
Investing In The US As A Canadian… And How To Do It RIGHT!! (feat. Erwin Szet...Volition Properties
=== Investing In The US As A Canadian… And How To Do It RIGHT!! (feat. Erwin Szeto) ===
Ever been curious about Real Estate Investing in the US?? At Volition, for the past 14 years, we have been focused on helping investors invest in over $250M of real estate and generate $100M of wealth in the Toronto market, but we are always open to learning more about other business models and learning from other investors.
The US has always been an intriguing market to invest in. But the US is a big place… if you’re interested in investing in the US, you probably have a lot of questions, like:
☑️ Specifically WHERE should you invest?
☑️ What are the best markets to invest in and why?
☑️ How much are property prices there?
☑️ What are the returns like?
☑️ What is cashflow like?
☑️ Compared to investing in Toronto or other cities in Ontario, what are the benefits / tradeoffs?
☑️ What ownership structure should I use?
☑️ What are the tax implications?
☑️ Can I get financing?
☑️ What are tenants like?
Enter Erwin Szeto, a longtime friend of Volition. Since 2005, Erwin Szeto and his team have navigated the challenging landscape of being landlords in Ontario. Now, they are shifting their focus and guiding their clients' investments toward the more landlord-friendly environment of the USA. This decision comes after assisting Canadian clients in transacting over $440,000,000 in income properties. Faced with issues like affordability constraints, tenant-friendly laws, rent control, and rental licensing in Canada, Erwin sees a clear opportunity in the U.S. Here, there is a significant influx of investments leading to the creation of high-paying manufacturing jobs. Erwin and his clients are poised to capitalize on these opportunities where landlord rights are stronger and there is no rent control.
To facilitate this transition, Erwin has partnered with and become a client of SHARE, a one-stop-shop U.S. Asset Manager. Founded by Canadians for Canadians, SHARE enables as passive an ownership experience as possible for landlords in the U.S., while still maintaining direct, 100% ownership.
Erwin is “Making Real Estate Investing Great Again”!!
Website: https://www.infinitywealth.ca/
Facebook: https://www.facebook.com/iwinrealestate and https://www.facebook.com/ErwinSzetoOfficial
Podcast: https://www.truthaboutrealestateinvesting.ca/
Instagram: https://www.instagram.com/iwinrealestate/ and https://www.instagram.com/erwinszeto/
The SVN® organization shares a portion of their new weekly listings via their SVN Live® Weekly Property Broadcast. Visit https://svn.com/svn-live/ if you would like to attend our weekly call, which we open up to the brokerage community.
Omaxe Sports City Dwarka stands out as a premier residential and recreational destination, offering a blend of luxury and sports-centric living. Located in the thriving area of Dwarka, this project by Omaxe Limited is designed to cater to modern lifestyle needs while promoting a healthy, active living environment.
Elegant Evergreen Homes - Luxury Apartments Redefining Comfort in Yelahanka, ...JagadishKR1
Experience unmatched luxury at Elegant Evergreen Homes, offering exquisite 2, 3, and 4 BHK apartments in the serene locality of Yelahanka, Bangalore. These meticulously crafted homes blend modern design with timeless elegance, providing a harmonious living environment. Enjoy top-tier amenities and a prime location, making Elegant Evergreen Homes the ideal choice for discerning homeowners.
Elegant Evergreen Homes - Luxury Apartments Redefining Comfort in Yelahanka, ...
Core logic home value index jan 2021 final
1. Media enquires contact: Michelle McKinnon or Jade Harling– 1300 472 767 or
media@corelogic.com.au
Hedonic Home Value Index
0.7%
1.0%
1.1%
1.1%
1.1%
0.7%
2.3%
0.6%
1.7%
1.8%
1.4%
2.0%
1.2%
2.1%
3.2%
0.9%
1.6%
1.0%
Sydney
Melbourne
Brisbane
Adelaide
Perth
Hobart
Darwin
Canberra
Regional NSW
Regional Vic
Regional Qld
Regional SA
Regional WA
Regional Tas
Regional NT
Combined capitals
Combined regionals
Australia
4 January 2021
CoreLogic: Housing markets build momentum through the
end of 2020, pointing to a strong start to 2021
Australia’s housing market finished the year on a strong
footing with CoreLogic’s national home value index rising a
further 1.0% in December; the third consecutive month-on-
month rise following a -2.1% drop in dwelling values between
April and September.
Australian home values finished the year 3.0% higher with
regional housing values rising by 6.9%, a rate of capital gain that
was more than three times higher than the combined capitals,
where home values were up 2.0% over the year.
CoreLogic’s research director, Tim Lawless, said the year was
characterised by a mild COVID dip in values, but unprecedented
volatility in the transaction space. “The number of residential
property sales plummeted by -40% through March and April but
finished the year with almost 8% more sales relative to a year
ago as buyer numbers surged through the second half of the
year. Despite the volatility, housing values showed remarkable
resilience, falling by only -2.1% before rebounding with strength
throughout the final quarter of 2020.”
In retrospect, the rebound in housing market activity and
dwelling values is unsurprising given the rapid and substantial
monetary and fiscal response from the Government and policy
makers. “Record low interest rates played a key role in
supporting housing market activity, along with a spectacular rise
in consumer confidence as COVID-related restrictions were
lifted and forecasts for economic conditions turned out to be
overly pessimistic. Containing the spread of the virus has been
critical to Australia’s economic and housing market resilience,”
Mr Lawless said.
As remote working opportunities became more prevalent and
demand for lifestyle properties and lower density housing
options became more popular, regional areas of Australia saw
housing market conditions surge. “Regional housing markets
had generally underperformed relative to the capital city
regions over the past decade, but 2020 saw regional housing
values surge as demand outweighed supply,” said Mr Lawless.
On the flipside, higher density housing has generally
underperformed throughout the year, with capital city unit
values holding reasonably firm (+0.2%) while house values were
up 2.6%. Excluding Melbourne, every capital city recorded a
higher rate of capital gain for houses relative to units in 2020.
According to Mr Lawless, the stronger growth conditions for
houses over units is due to a range of factors. “Unit markets
have historically been more popular amongst investor buyers;
demand from investors has been weighed down by weak rental
conditions across the unit sector along with high supply levels in
some precincts. A transition of demand towards lower density
housing options has helped to buoy house values.”
Although housing markets are gathering pace, four of the
eight capitals are still recording dwelling values lower relative
to their previous peaks. Melbourne home values are still -4.1%
below their March 2020 peak and Sydney dwelling values need
to recover a further 3.9% before surpassing the previous July
2017 peak. Perth and Darwin values remain -19.9% and -25.7%
below their 2014 peaks.
Index results as at December 31, 2020
Change in dwelling values
Month-on-month change in national dwelling values
Past 12 monthsPast 3 monthsPast month
CoreLogic Home Value Index
Released 4 January 2021
-2.0%
-1.0%
0.0%
1.0%
2.0%
Dec 15 Dec 16 Dec 17 Dec 18 Dec 19 Dec 20
1.3%
1.5%
2.1%
3.6%
2.8%
3.2%
5.5%
3.5%
4.3%
3.7%
4.1%
2.6%
2.5%
4.4%
4.9%
1.8%
4.0%
2.3%
2.7%
-1.3%
3.6%
5.9%
1.9%
6.1%
9.0%
7.5%
8.3%
5.6%
6.9%
8.1%
-3.7%
11.9%
3.5%
2.0%
6.9%
3.0%
Month Quarter Annual Total return
Median
value
Sydney 0.7% 1.3% 2.7% 5.3% $871,749
Melbourne 1.0% 1.5% -1.3% 1.9% $682,197
Brisbane 1.1% 2.1% 3.6% 7.6% $521,686
Adelaide 1.1% 3.6% 5.9% 10.1% $468,544
Perth 1.1% 2.8% 1.9% 6.4% $471,310
Hobart 0.7% 3.2% 6.1% 11.4% $513,552
Darwin 2.3% 5.5% 9.0% 15.0% $416,183
Canberra 0.6% 3.5% 7.5% 12.5% $678,765
Combined capitals 0.9% 1.8% 2.0% 5.3% $651,983
Combined regional 1.6% 4.0% 6.9% 11.8% $420,502
National 1.0% 2.3% 3.0% 6.6% $574,872
Change in dwelling values
2. Media enquires contact: Michelle McKinnon or Jade Harling– 1300 472 767 or
media@corelogic.com.au
Media enquires contact: Michelle McKinnon or Jade Harling - 1300 472 767 or
media@corelogic.com.au
Hedonic Home Value Index
-1.5%
-1.0%
-0.5%
0.0%
0.5%
1.0%
1.5%
2.0%
20%
30%
40%
50%
60%
70%
80%
90%
Dec09
Dec10
Dec11
Dec12
Dec13
Dec14
Dec15
Dec16
Dec17
Dec18
Dec19
Dec20
clearance rate (left axis) monthly change in dwelling values (right axis)
Low inventory levels have been a feature of the Australian
housing market through 2020. Although the number of new
listings surged higher through spring and early summer, the total
number of residential dwellings advertised for sale has remained
persistently low throughout 2020.
Total listings peaked at the end of November with approximately
165,000 properties available for sale, -18% lower relative to the
same period in 2019, and -22% below the five year average for
that time of the year. At the end of 2020 there was -21% fewer
properties available for sale than at the end of 2019.
According to Mr Lawless, low advertised stock levels reflect a
rapid rate of absorption; put simply there are more active buyers
than new listings being added to the market. “Despite new listing
numbers being consistently lower relative to their 2019 levels, the
estimated number of home sales were almost 8% higher though
2020 compared with the 2019 calendar year. This imbalance
between effective supply and demand is another factor that has
supported a rise in housing prices as a sense of urgency returned
to the market. With home buyers outnumbering sellers, most
areas around the country represent a seller’s market.”
Strong selling conditions are also reflected in auction clearance
rates which have held firm around the 70% mark since the first
week of November. Auction conditions have shown extreme
volatility through 2020, with a large portion of auctions withdrawn
from sale during periods of lockdown when onsite auctions and
home inspections were banned.
As housing market conditions firm, homes are selling faster and
vendors are discounting their prices less. Across the combined
capital cities, the median number of days on market has reduced
from a recent high of 43 days over the three months ending July to
33 days throughout the December quarter. Similarly, vendors are
discounting their asking prices by a smaller amount, with the
median vendor discount reducing from 3.6% to 2.8%.
Performance across broad valuation cohorts
The most affordable quartile of the market is continuing to drive
the strongest rise in values, however the performance gap is
narrowing relative to more expensive properties. Across the
combined capitals, lower quartile home values were up 1.0% over
the month compared with a 0.9% rise across the broad middle of the
market and a 0.8% gain across the upper quartile of the market.
In Melbourne, where the upper quartile lost the most value through
COVID, home values are now rebounding the fastest. Melbourne’s
upper quartile index increased in value by 0.98% in December,
compared with a 0.97% rise across the lower quartile.
Sydney’s upper quartile is also bouncing back strongly, recording a
0.70% rise in values over the month compared with a 0.63% rise
across the lower quartile.
Brisbane is also showing strength across the upper quartile, with
dwelling values up 1.25% in December compared with a 0.94% rise
in values across the lower quartile of the market.
Previous cycles have shown a similar trend, where the more
expensive end of the market has shown both stronger gains
through the upswing and larger declines through the down phase of
the cycle. With housing markets once again gaining momentum, it is
likely the top end of the market will again start to outperform
relative to other sectors.
New listings, rolling 28 day
count, national
Total listings, rolling 28 day
count, national
Rolling three month change in capital city dwelling
values by quartile
Monthly volume of sales, national
Most recent months of sales volumes are estimates and will revise
Auction clearance rate, combined capitals
-6%
-4%
-2%
0%
2%
4%
6%
8%
Dec 10 Dec 12 Dec 14 Dec 16 Dec 18 Dec 20
Lower quartile Middle market Upper quartile
CoreLogic Home Value Index
Released 4 January 2021
0
10,000
20,000
30,000
40,000
50,000
60,000
Jan
Mar
May
Jul
Sep
Nov
2016 2017 2018
2019 2020
As at 27 Dec, 2020
100,000
120,000
140,000
160,000
180,000
200,000
220,000
240,000
260,000
Jan
Mar
May
Jul
Sep
Nov
2016 2017 2018
2019 2020
As at 27 Dec, 2020
20,000
25,000
30,000
35,000
40,000
45,000
50,000
Jan Feb Mar Apr May Jun Jul Aug Sep Oct Nov Dec
2020 2019 2018 5yr average
3. Media enquires contact: Michelle McKinnon or Jade Harling– 1300 472 767 or
media@corelogic.com.au
Hedonic Home Value Index
In summary, 2020 has been a year of extremes for Australian
housing markets. Despite the volatility, home values have been
resilient to material falls through the worst of the COVID-related
economic downturn and the final quarter of 2020 has seen housing
markets around the country stage a broad-based rise in values
amidst strong demand and low advertised supply.
Housing market activity, which provides a multiplier effect for the
Australian economy more broadly, ended the year with annual
home sales about 8% higher than a year ago. More home sales
implies more work for a range of industries including real estate
professionals, removalists, conveyancers, financiers and building
inspectors along with more spending on household goods such as
home furnishings, white goods and appliances.
The risks related to less fiscal support and the expiry of mortgage
repayment deferrals have diminished as the economy
outperforms forecasts and labour markets recover lost jobs.
Indeed, the mid-year economic and fiscal outlook estimates that
around 600,000 fewer workers would need JobKeeper through
December than originally expected and unemployment looks set to
peak lower than the original budget estimates at 7.5%.
According to APRA, home loan deferrals dropped to $68.2Bn or
3.9% of the loan book in October, down from $195Bn (11%) in June.
As the March expiry of mortgage repayment holidays approaches
it’s looking less likely that there will be a significant rise in
distressed homes coming onto the market.
Although the trajectory for housing markets is looking positive as
we move into 2021, the downside risks remain clear and present.
As demonstrated by Melbourne’s second round of lockdowns, new
restrictions associated with a COVID outbreak would set back the
economic recovery and have a negative, although temporary
impact on housing markets.
Closed international borders are another wildcard; the longer
borders remain closed the greater the impact is on housing
demand, especially rental demand. Regions where overseas
migration has historically comprised a larger portion of overall
population growth, such as Melbourne and Sydney, will be
impacted the most by prolonged border closures.
Rental conditions have diverged substantially in 2020 from both a geographical perspective and across the housing types.
From a geographical perspective, the annual change in rents has been strong in Perth and Darwin where house rents are up around 10%
in both cities and unit rents are 6.8% higher in Perth and 7.6% higher in Darwin. Mr Lawless attributes the strength in Perth and Darwin
rentals to both strong demand and a recent history of minimal supply additions. “Both Perth and Darwin have recorded below average
levels of investor activity since housing market conditions started to cool in mid-2014 which has led to a shortage of rental stock. More
recently, with stronger interstate migration driving housing demand, rental rates have been under substantial upwards pressure as
demand for rentals outweighs supply.”
Although rents are surging higher in Perth and Darwin, the longer term trend highlights the weak rental conditions that persisted prior to
the recent upswing. Perth rents remain -10.4% lower than the previous peak in May 2013 and Darwin rents remain almost -20% below
their 2014 peak.
At the opposite end of the spectrum are rental conditions across the Melbourne and Sydney unit markets where weak demand and high
supply has driven a sharp drop in rents. Demand for inner city unit rentals has been significantly impacted by stalled overseas migration,
especially from lower overseas student numbers. Weak demand for inner city unit rentals has been exacerbated by a recent history of
high rise apartment construction in Melbourne and Sydney, with the pipeline of new units that are still under construction remaining well
above the decade average. Melbourne unit rents are down -7.6% over the calendar year and Sydney unit rents are down -5.7%. Weak
rental conditions across the unit sector are likely to persist until overseas migration starts to ramp up and the higher levels of supply are
absorbed.
Rental yields have been under some mild downwards pressure through the COVID period, with the gross yield across the combined
capitals region reducing from 3.51% at the end of 2019 to 3.42% in December 2020, while yields across the combined regional areas have
reduced from 5.03% last year to 4.83% this year. Despite the lower yield profile, with interest rates likely to remain at record lows for
some time yet, the opportunity for positive cash flow properties is becoming more prevalent. Opportunities for positive cash flow
properties along with the potential for capital gains is likely to see investment activity consistently lift through 2021.
Annual change in rents,
Houses
Gross rental yields,
dwellings
CoreLogic Home Value Index
Released 4 January 2021
2.9%
3.1%
4.3%
4.3%
4.5%
4.5%
6.0%
4.5%
4.4%
4.3%
5.2%
5.8%
6.2%
5.0%
6.7%
3.4%
4.8%
3.7%
Sydney
Melbourne
Brisbane
Adelaide
Perth
Hobart
Darwin
Canberra
Regional NSW
Regional Vic
Regional Qld
Regional SA
Regional WA
Regional Tas
Regional NT
Combined capitals
Combined regionals
National
Annual change in rents,
Units
4. Media enquires contact: Michelle McKinnon or Jade Harling– 1300 472 767 or
media@corelogic.com.au
Hedonic Home Value Index
Methodology
The CoreLogic Hedonic Home Value Index
is calculatedusing a hedonic regression methodology that
addresses the issue of compositionalbias associatedwith
median price and other measures. In simple terms, the index
is calculatedusing recent sales data combined with information
about the attributes of individual properties such as the number
of bedrooms and bathrooms, land area and geographical
context of the dwelling. By separating each property into its
various formational and locational attributes,observed sales
values for each property can be distinguished between those
attributed to the property’s attributesand those resulting
from changes in the underlying residential property market.
Additionally, by understandingthe value associatedwith each
attribute of a given property, this methodology can be used to
estimate the value of dwellings with known characteristics
for which there is no recent sales price by observing the
characteristicsand sales prices of other dwellings which have
recently transacted.It then follows that changes in the market
value of the entire residentialproperty stock can be accurately
tracked through time. The detailed methodologicalinformation
can be found at:
https://www.corelogic.com.au/research/rp-data-corelogic-
home-value-index-methodology/
CoreLogic is able to produce a consistentlyaccurate and robust
Hedonic Index due to its extensive property related database,
which includes transaction data for every home sale within
every state and territory. CoreLogic augments this data with
recent sales advice from real estate industry professionals,
listings information and attribute data collectedfrom a
variety of sources.
CoreLogic is the largest independent provider of property information, analytics and property-
related risk management services in Australia and New Zealand.
* The median value is the middle estimated value of all residential properties derived through the hedonic regression methodology that underlies
the CoreLogic Hedonic Home Value Index.
CoreLogic Home Value Index tables
CoreLogic Home Value Index
Released 4 January 2021
Sydney Melbourne Brisbane Adelaide Perth Hobart Darwin Canberra
Regional
NSW
Regional
Vic
Regional
Qld
Regional
SA
Regional
WA
Regional
Tas
Regional
NT
Combined
capitals
Combined
regional
National
Month 0.7% 1.0% 1.1% 1.1% 1.1% 0.7% 2.3% 0.6% 1.7% 1.8% 1.4% 2.0% 1.2% 2.1% na 0.9% 1.6% 1.0%
Quarter 1.3% 1.5% 2.1% 3.6% 2.8% 3.2% 5.5% 3.5% 4.3% 3.7% 4.1% 2.6% 2.5% 4.4% na 1.8% 4.0% 2.3%
YTD 2.7% -1.3% 3.6% 5.9% 1.9% 6.1% 9.0% 7.5% 8.3% 5.6% 6.9% 8.1% -3.7% 11.9% na 2.0% 6.9% 3.0%
Annual 2.7% -1.3% 3.6% 5.9% 1.9% 6.1% 9.0% 7.5% 8.3% 5.6% 6.9% 8.1% -3.7% 11.9% na 2.0% 6.9% 3.0%
Total return 5.3% 1.9% 7.6% 10.1% 6.4% 11.4% 15.0% 12.5% 12.8% 10.6% 12.3% 14.0% 2.6% 18.2% n a 5.3% 11.8% 6.6%
Gross yield 2.9% 3.1% 4.3% 4.3% 4.5% 4.5% 6.0% 4.5% 4.4% 4.3% 5.2% 5.8% 6.2% 5.0% na 3.4% 4.8% 3.7%
Median value $871,749 $682,197 $521,686 $468,544 $471,310 $513,552 $416,183 $678,765 $503,744 $416,288 $405,763 $251,483 $330,684 $344,897 na $651,983 $420,502 $574,872
Houses
Month 1.1% 1.2% 1.2% 1.2% 1.1% 0.9% 2.3% 0.7% 1.8% 1.8% 1.5% 2.1% 1.2% 2.5% 2.8% 1.1% 1.7% 1.3%
Quarter 2.5% 1.5% 2.5% 3.9% 2.8% 3.6% 5.0% 4.0% 4.5% 3.7% 4.2% 3.1% 2.3% 4.6% 5.1% 2.4% 4.2% 2.8%
YTD 4.0% -2.0% 4.6% 5.9% 2.0% 7.7% 11.9% 8.5% 8.8% 5.5% 7.3% 7.8% -3.9% 12.0% 2.8% 2.6% 7.1% 3.7%
Annual 4.0% -2.0% 4.6% 5.9% 2.0% 7.7% 11.9% 8.5% 8.8% 5.5% 7.3% 7.8% -3.9% 12.0% 2.8% 2.6% 7.1% 3.7%
Total return 6.3% 0.8% 8.5% 10.0% 6.4% 13.1% 17.5% 13.2% 13.2% 10.3% 12.5% 14.0% 2.3% 18.7% 10.0% 5.8% 11.9% 7.1%
Gross yield 2.7% 2.8% 4.1% 4.1% 4.3% 4.5% 5.5% 4.2% 4.4% 4.3% 5.0% 5.8% 6.1% 4.9% 6.6% 3.3% 4.7% 3.6%
Median value $1,015,354 $799,980 $576,338 $504,829 $490,810 $551,462 $497,222 $762,608 $521,519 $443,586 $417,877 $258,042 $343,619 $359,521 $434,182 $696,413 $435,623 $596,090
Units
Month -0.1% 0.6% 0.4% 0.5% 1.1% -0.3% 2.3% 0.3% 1.2% 1.7% 1.0% 0.6% 0.0% -0.9% na 0.2% 1.1% 0.4%
Quarter -1.4% 1.4% 0.5% 1.9% 2.5% 1.6% 6.4% 1.6% 3.0% 3.9% 3.7% -5.3% 5.4% 2.3% na 0.0% 3.4% 0.5%
YTD -0.2% 0.0% -0.6% 5.6% 1.3% 0.0% 3.6% 4.1% 5.7% 6.5% 5.7% 11.7% -0.2% 10.5% na 0.2% 5.9% 1.0%
Annual -0.2% 0.0% -0.6% 5.6% 1.3% 0.0% 3.6% 4.1% 5.7% 6.5% 5.7% 11.7% -0.2% 10.5% na 0.2% 5.9% 1.0%
Total return 3.3% 3.9% 4.3% 10.9% 6.4% 4.9% 10.3% 10.2% 10.4% 12.2% 11.5% 11.0% 7.1% 15.3% na 4.1% 11.2% 5.0%
Gross yield 3.3% 3.7% 5.1% 5.2% 5.3% 4.8% 7.0% 5.6% 4.7% 4.9% 5.5% 6.1% 7.8% 5.7% na 3.8% 5.2% 4.0%
Median value $733,852 $576,905 $390,785 $344,493 $365,037 $417,724 $290,774 $467,977 $425,135 $307,791 $375,076 $194,084 $217,801 $271,076 na $574,388 $364,101 $525,688
HousesUnits
All Dwellings
Capitals Rest of state regions Aggregate indices
Dwellings