Contour maps
•Download as PPT, PDF•
1 like•3,901 views

Contour maps show elevation and topographical features of land using contour lines, compass directions, scales, keys, and other information. Contour lines connect points of equal elevation and the spacing of lines indicates steepness of slopes. Features like streams and rivers are shown by the direction contour lines cross them. Contour maps provide elevation data and can be used to calculate gradients and depict profiles of terrain. Exercises are given to interpret points, gradients, directions and other details from sample contour maps.

More Related Content
What's hot
What's hot (20)
Viewers also liked
Viewers also liked (20)
Similar to Contour maps
Similar to Contour maps (10)
Recently uploaded
Recently uploaded (20)
Contour maps
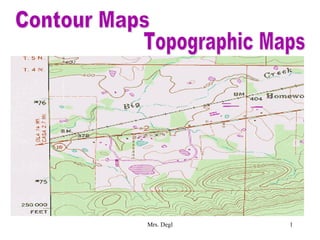
- 1. Mrs. Degl 1
- 2. Mrs. Degl 2 Contour Maps show the elevation of the land.
- 3. Mrs. Degl 3
- 4. Mrs. Degl 4 Things you find on a Contour or Topo Map: 1. Contour Lines that show elevation 2. Compass directions to show N, S, E, W 3. A scale for distances 4. Latitude and Longitude 5. A Key to show different features and locations 6. Colors: Blue = Water White = Bedrock Brown = Contour Lines Red = Roads Green = Vegetation Black = Names 7. Title and Location of the area the map is from 8. Magnetic Declination:
- 5. Mrs. Degl 5 Things to know about Contour Maps: 1. Contour Interval means “what every line is worth”. 2. The rule of the Contour V’s Streams and rivers flow opposite to the point of the V that is formed when a contour line crosses them. 3. Close contour lines means that there is a steep slope. 4. Contour lines that are far apart mean that the land is flatter. 5. The Gradient Formula is used to calculate the slope. 6. Gradient means slope. 7. Bulls eyes represent hills or mountains. 8. Hachured lines on bulls eyes mean depressions or valleys. 9. Each line represents a different elevation in feet or meters. 10. Places on the same contour line are at the same elevation. 11. A Profile is a side view or real representation of the topography of an area.
- 6. Mrs. Degl 6
- 7. Mrs. Degl 7 1. What is the elevation of Point A? 2. What is the elevation of Point B? 3. What direction does Stream X flow? 4. What is the gradient between A and B? 5. Below stream Y, what direction does the Taconic State Parkway run? 6. What side of Briarcliff High School has the highest gradient? 7. What Quadrant is the depression located in?
- 8. Mrs. Degl 8 0 l 2 Elevation is in feet Distance is in miles Scale OCEAN Red River Map
- 9. Mrs. Degl 9 1. What is the elevation of Point A? 2. What is the elevation of Point B? 3. What is the elevation of Point C? 4. What is the gradient between X and Y? 5. What direction is Red River flowing? 6. What side of Hill D has the steepest/highest gradient?
- 10. Mrs. Degl 9 1. What is the elevation of Point A? 2. What is the elevation of Point B? 3. What is the elevation of Point C? 4. What is the gradient between X and Y? 5. What direction is Red River flowing? 6. What side of Hill D has the steepest/highest gradient?