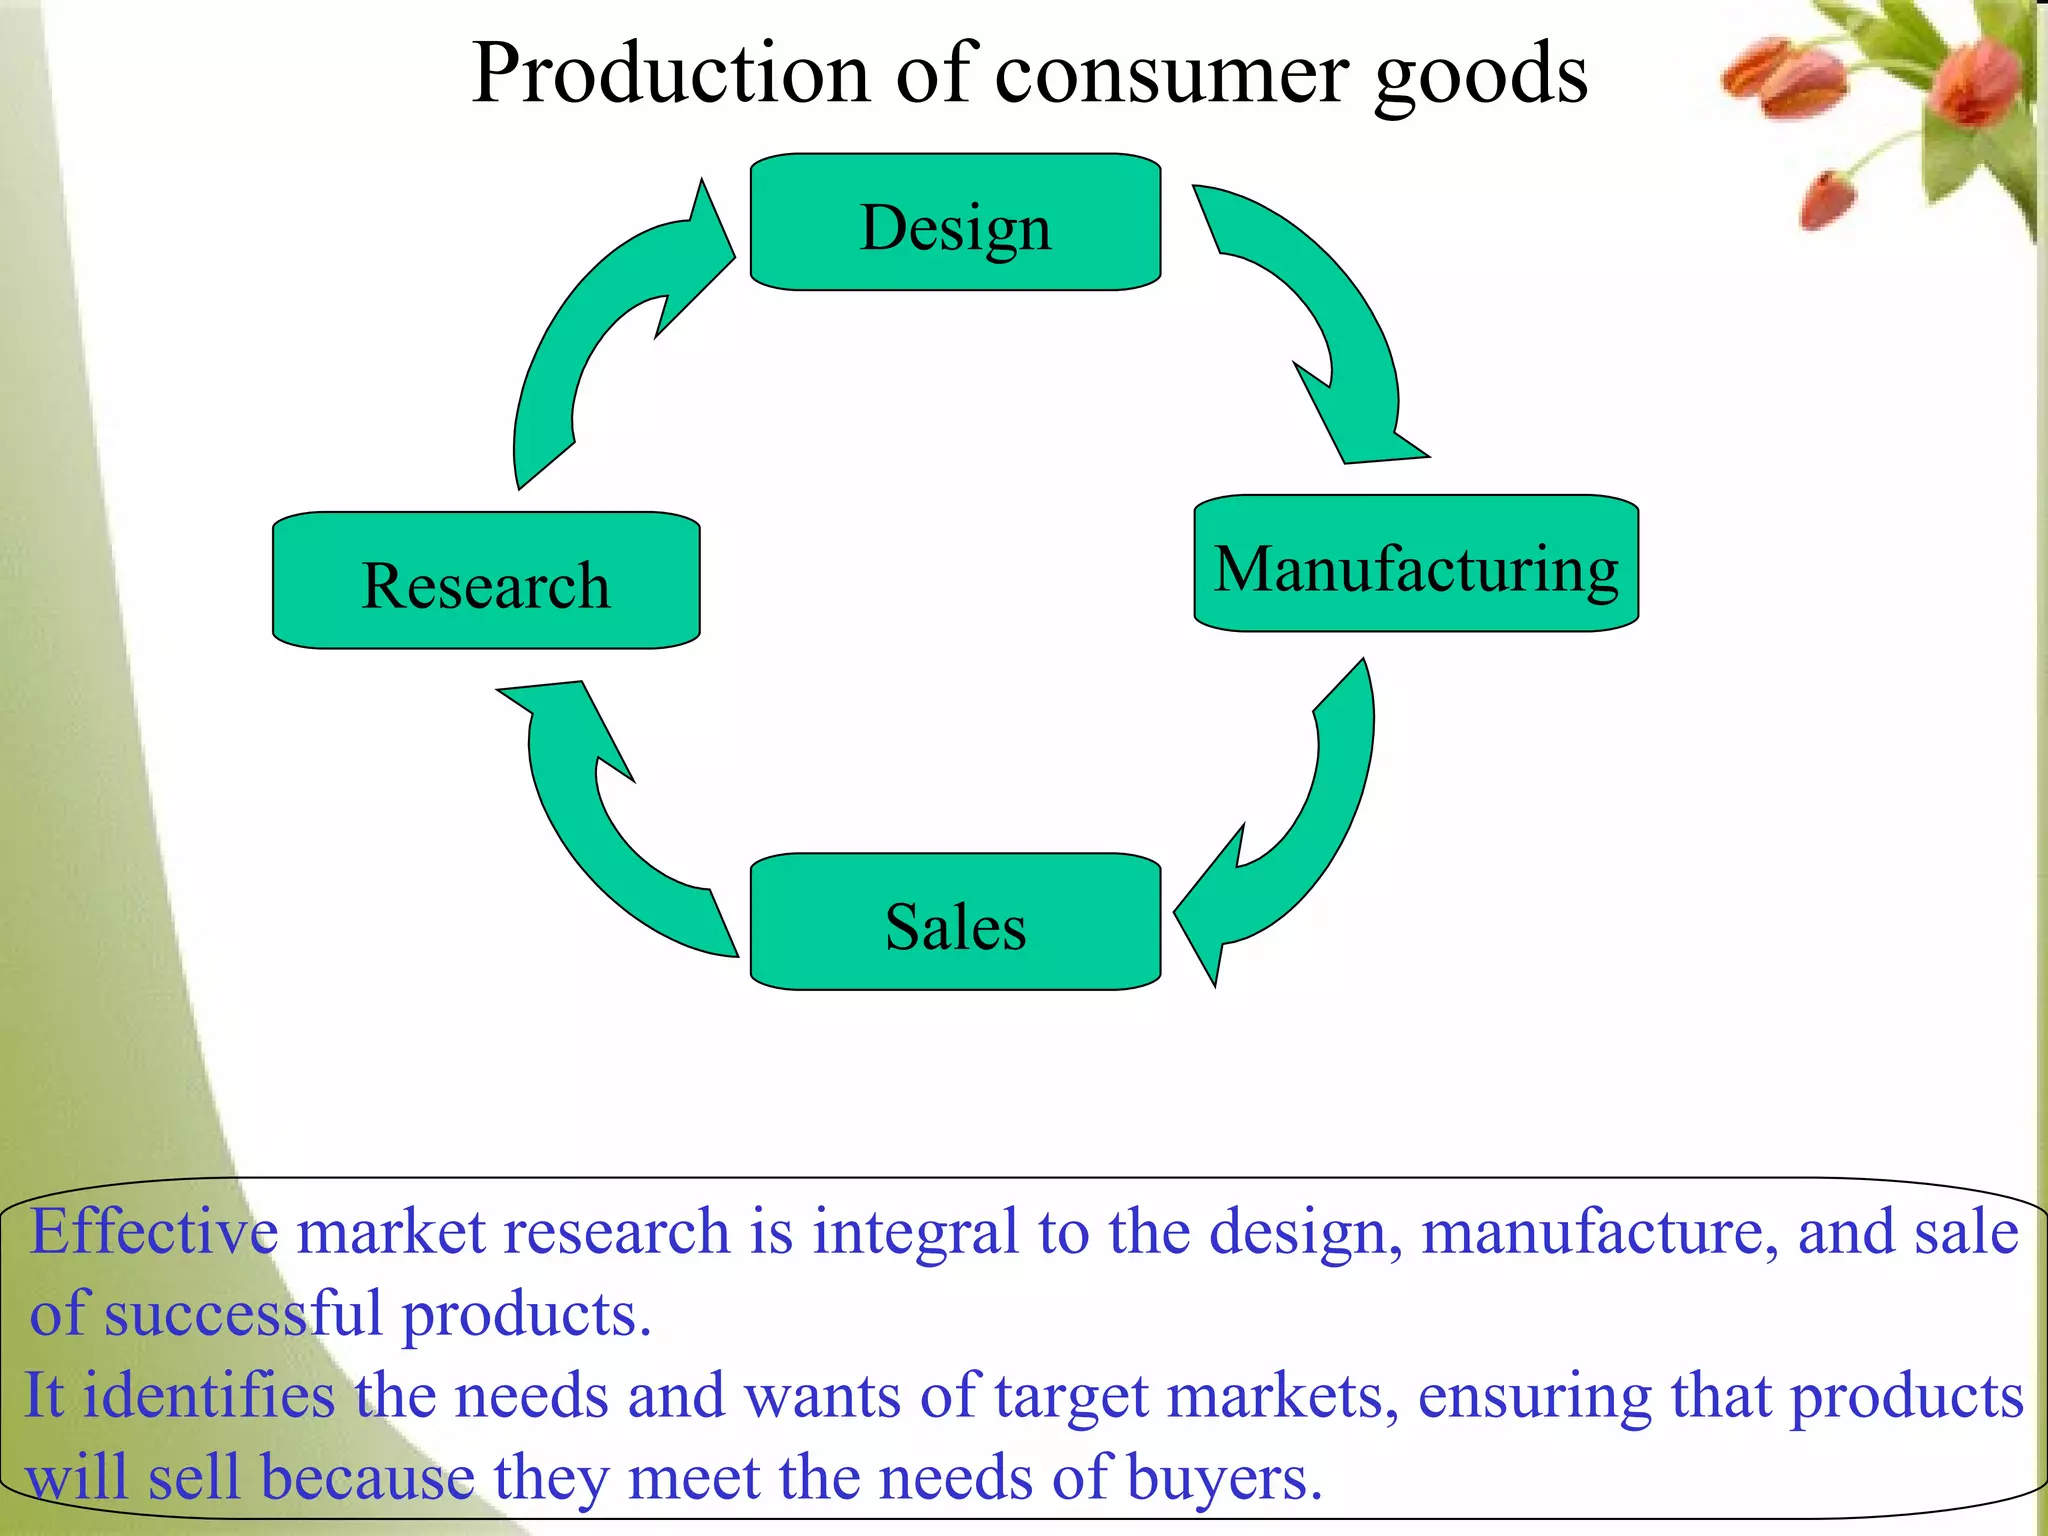
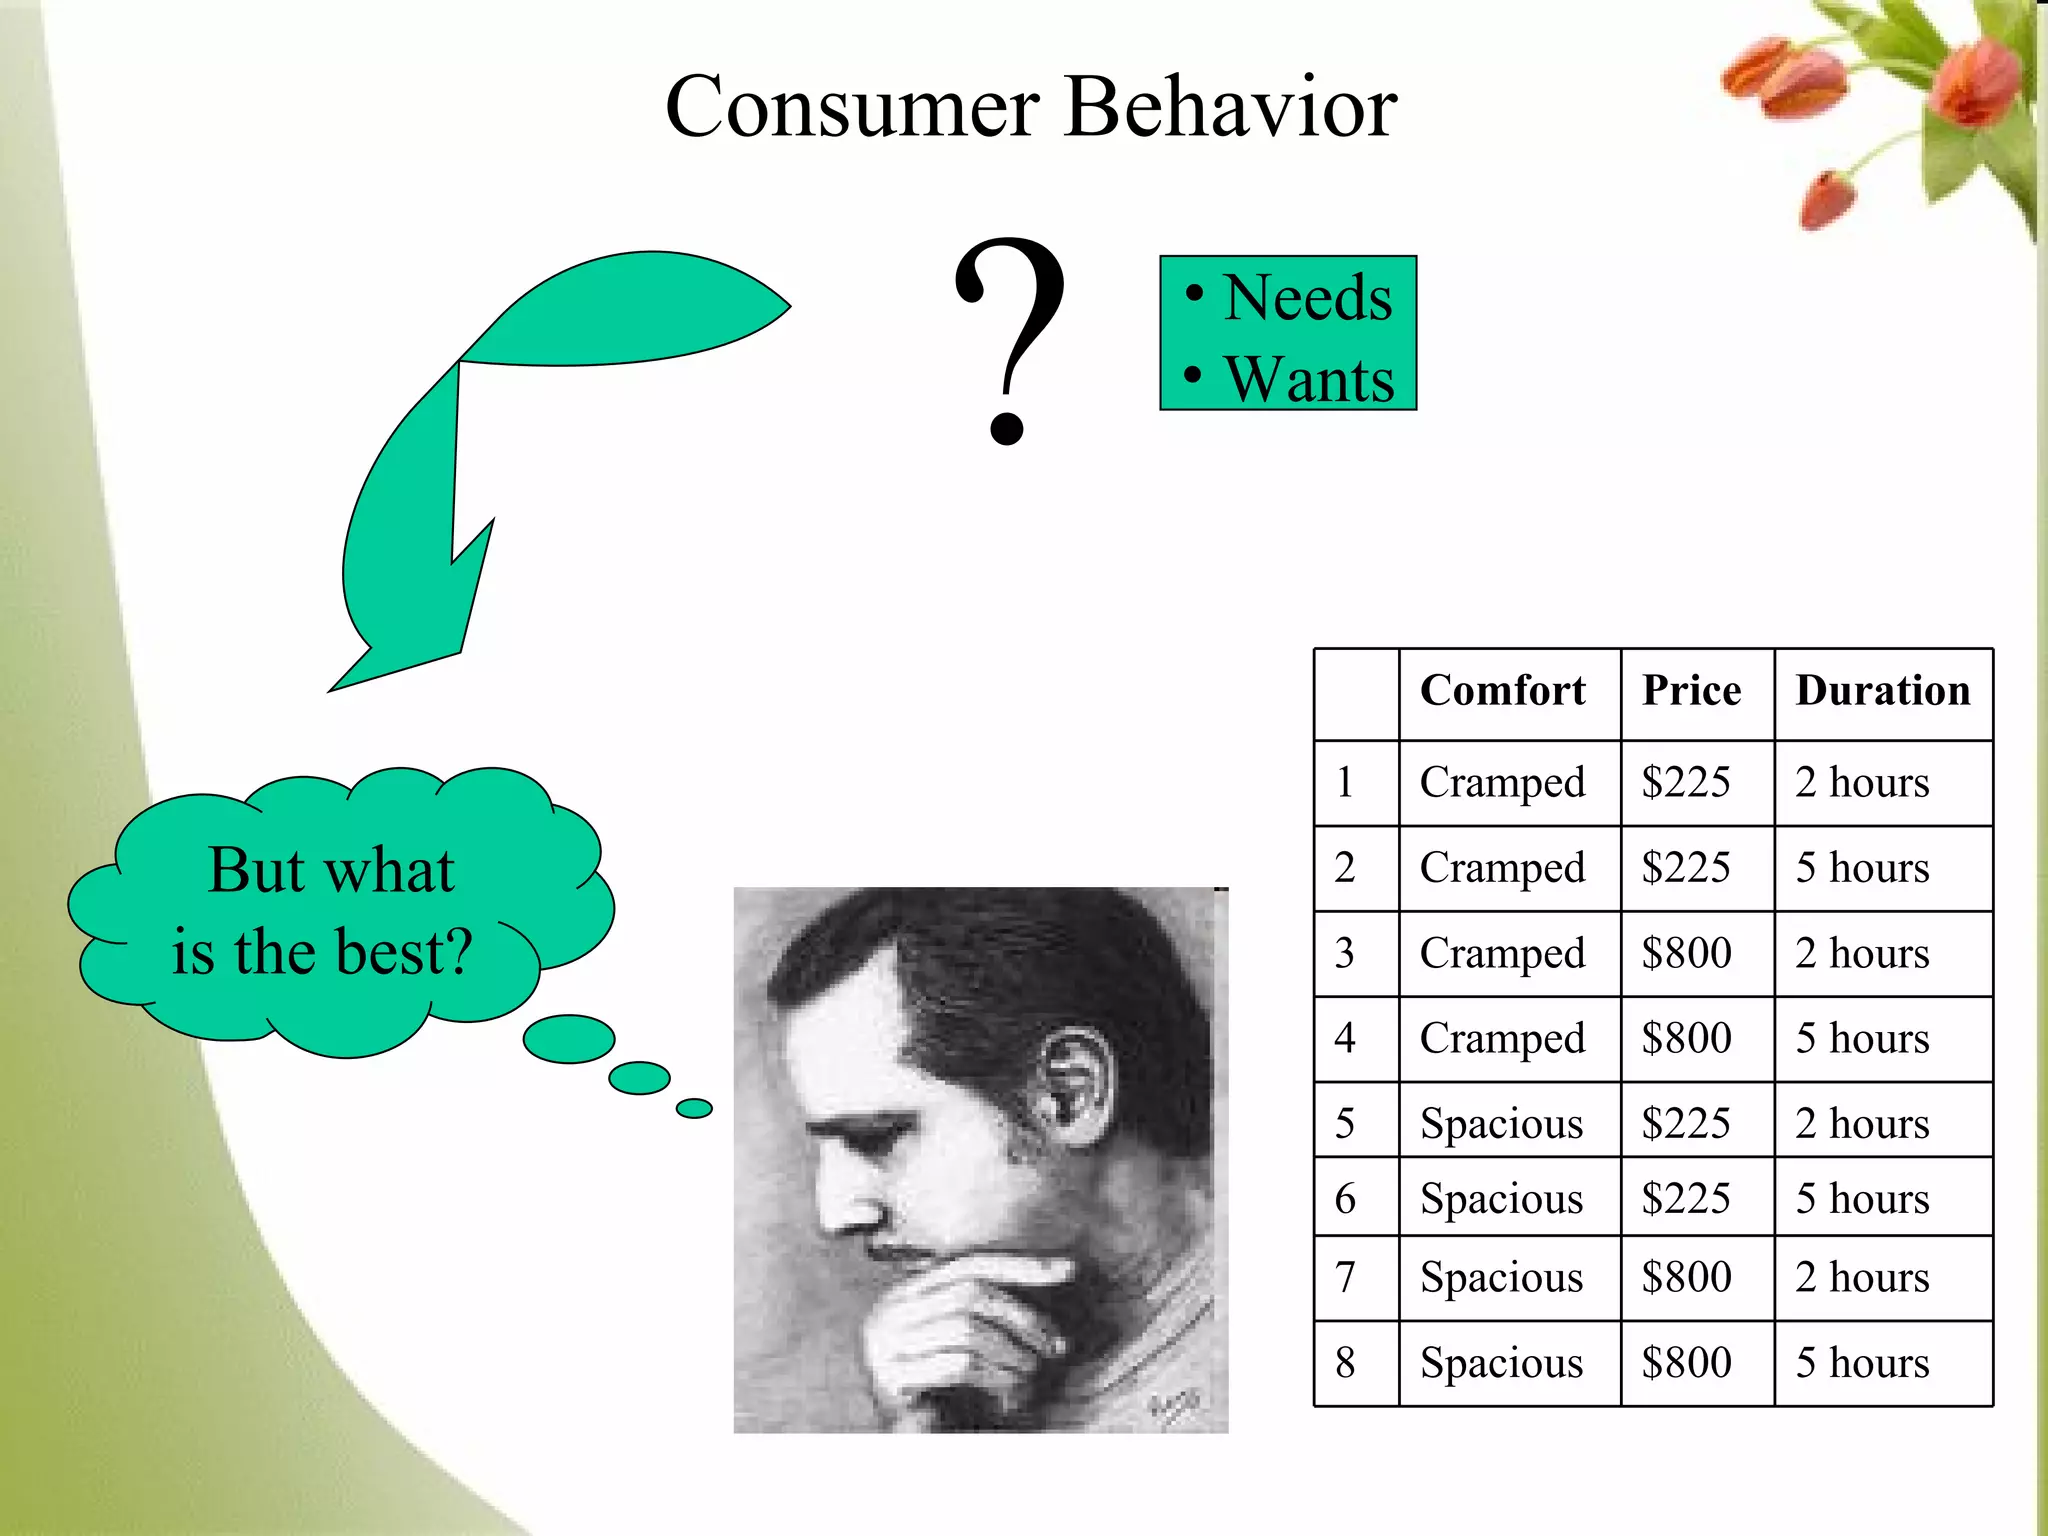
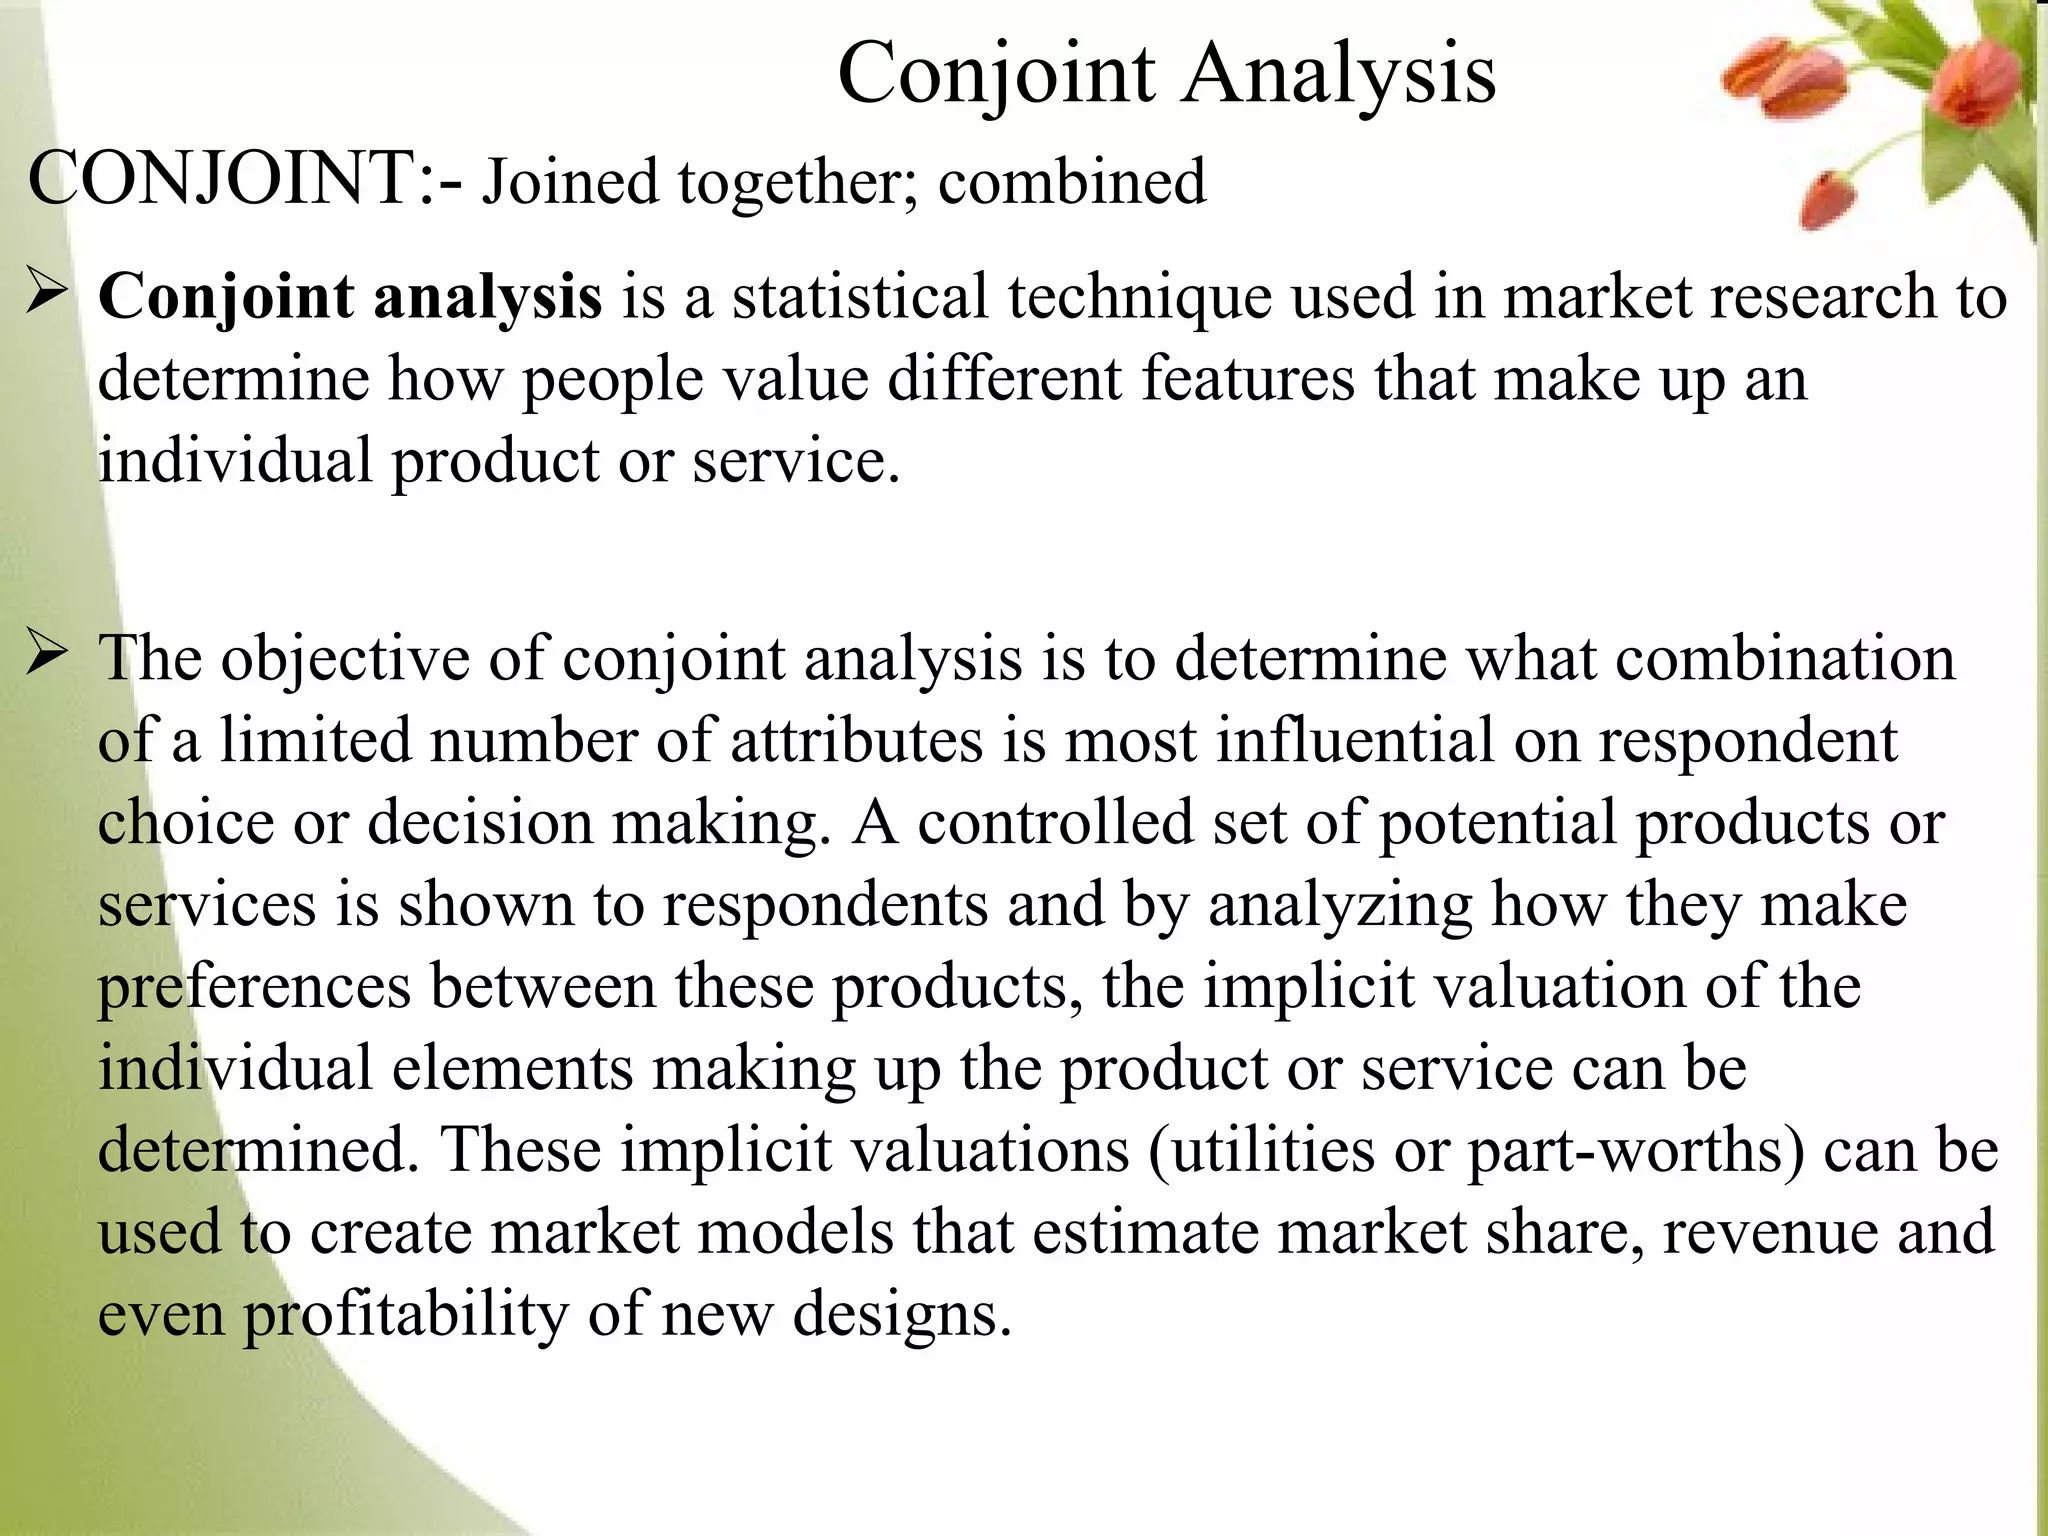
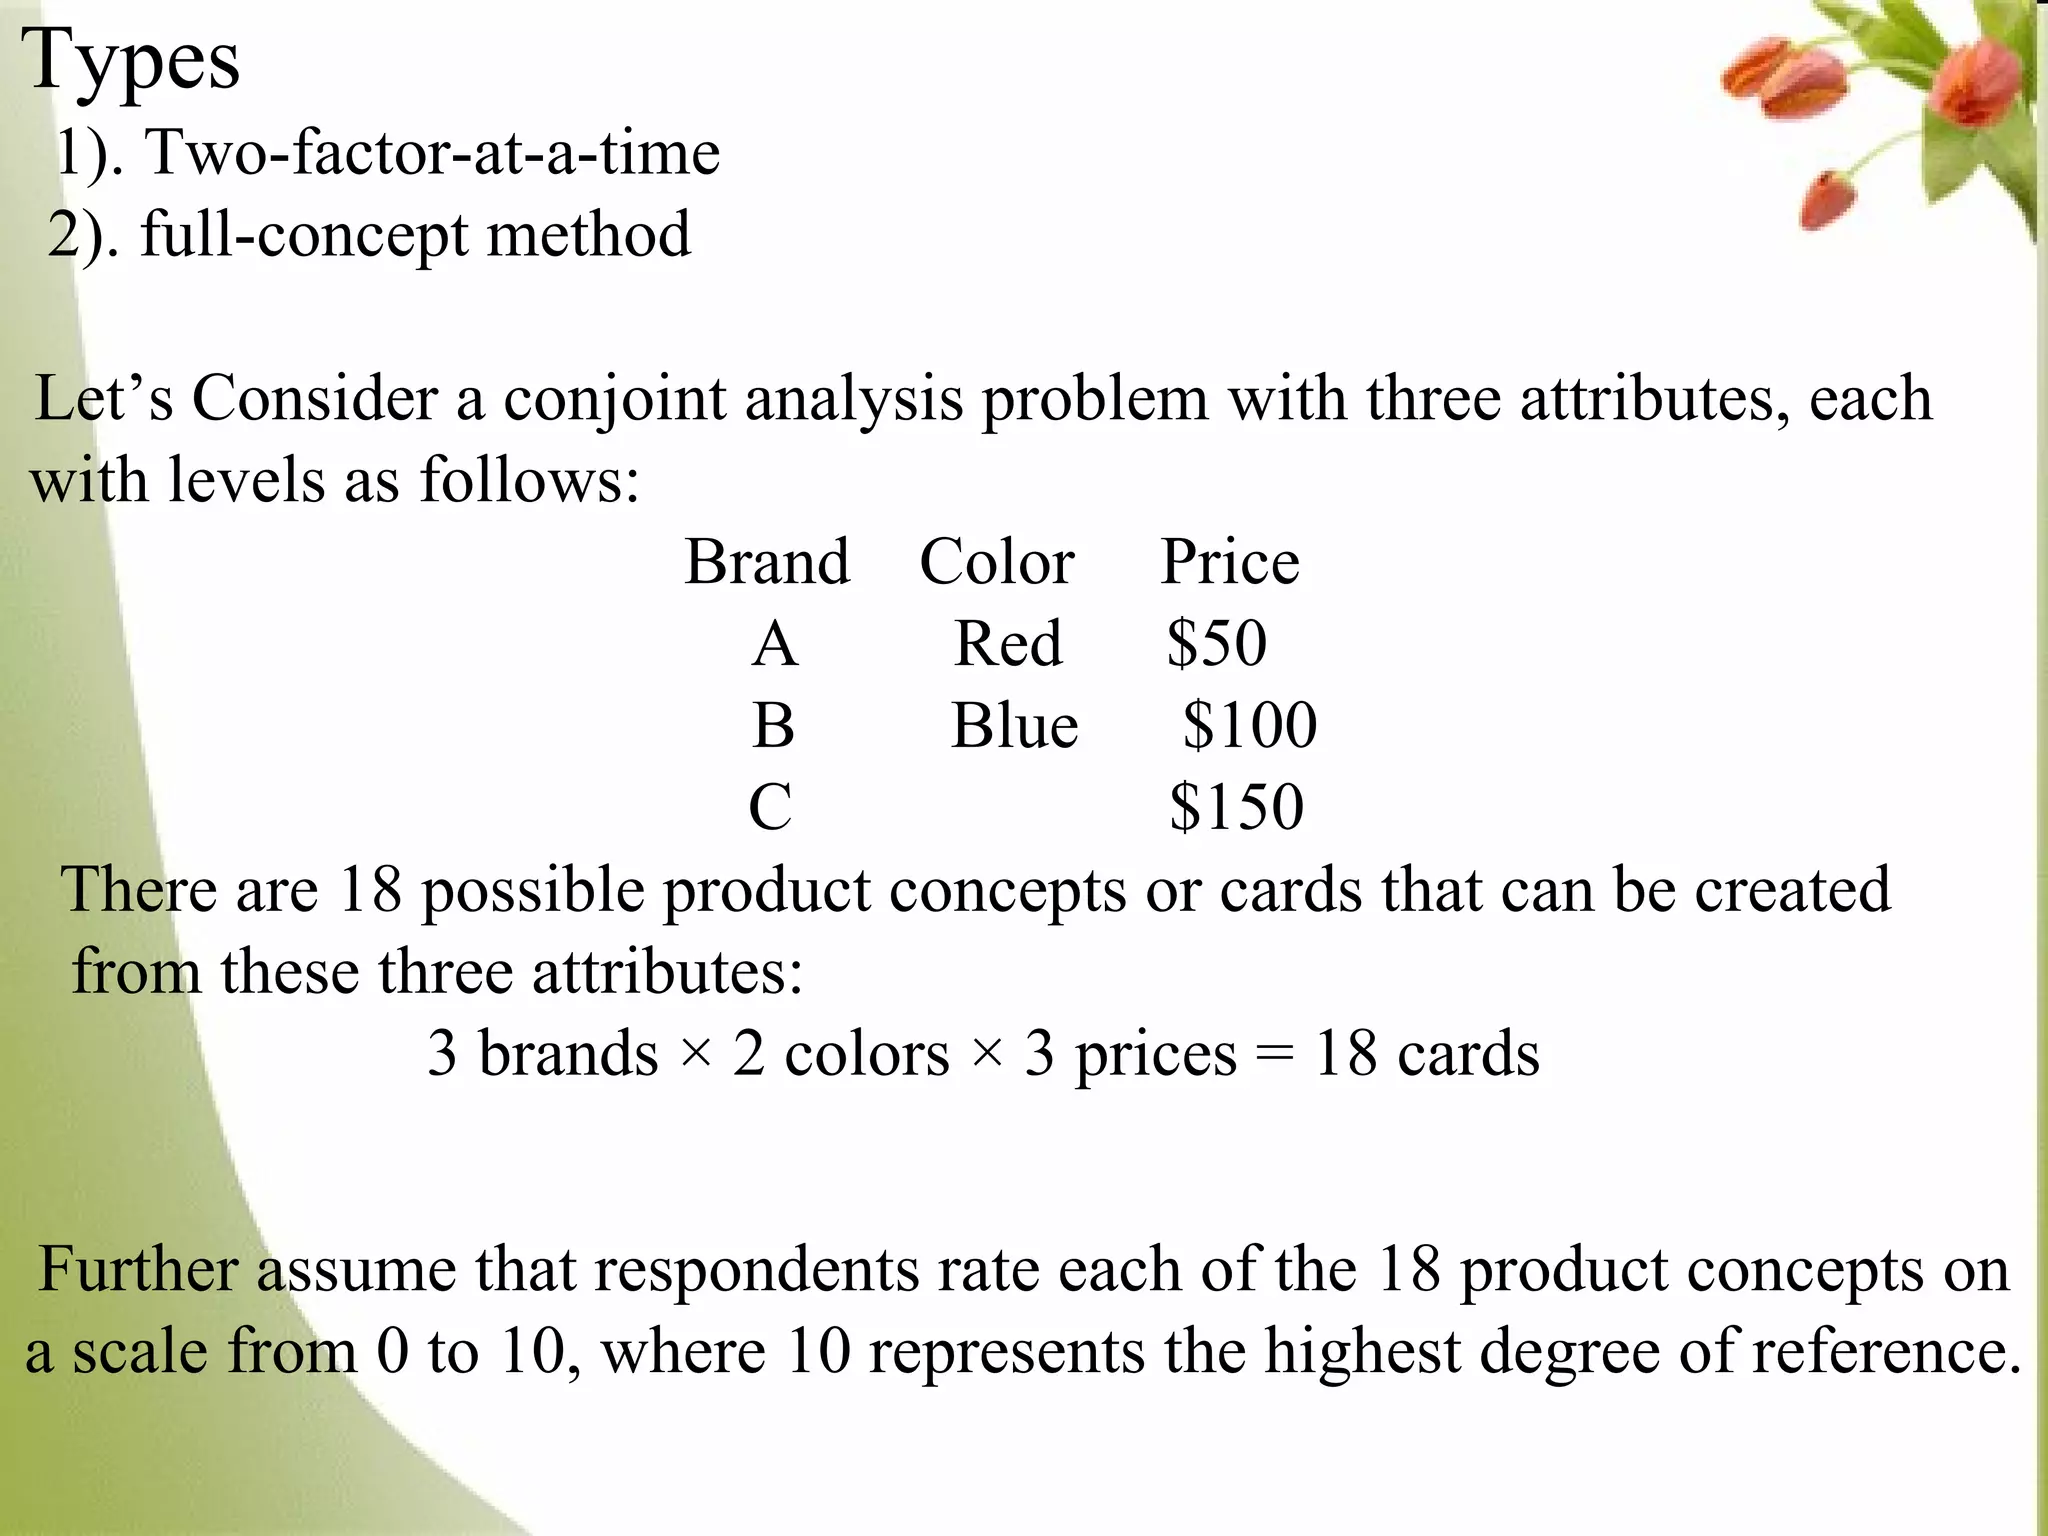
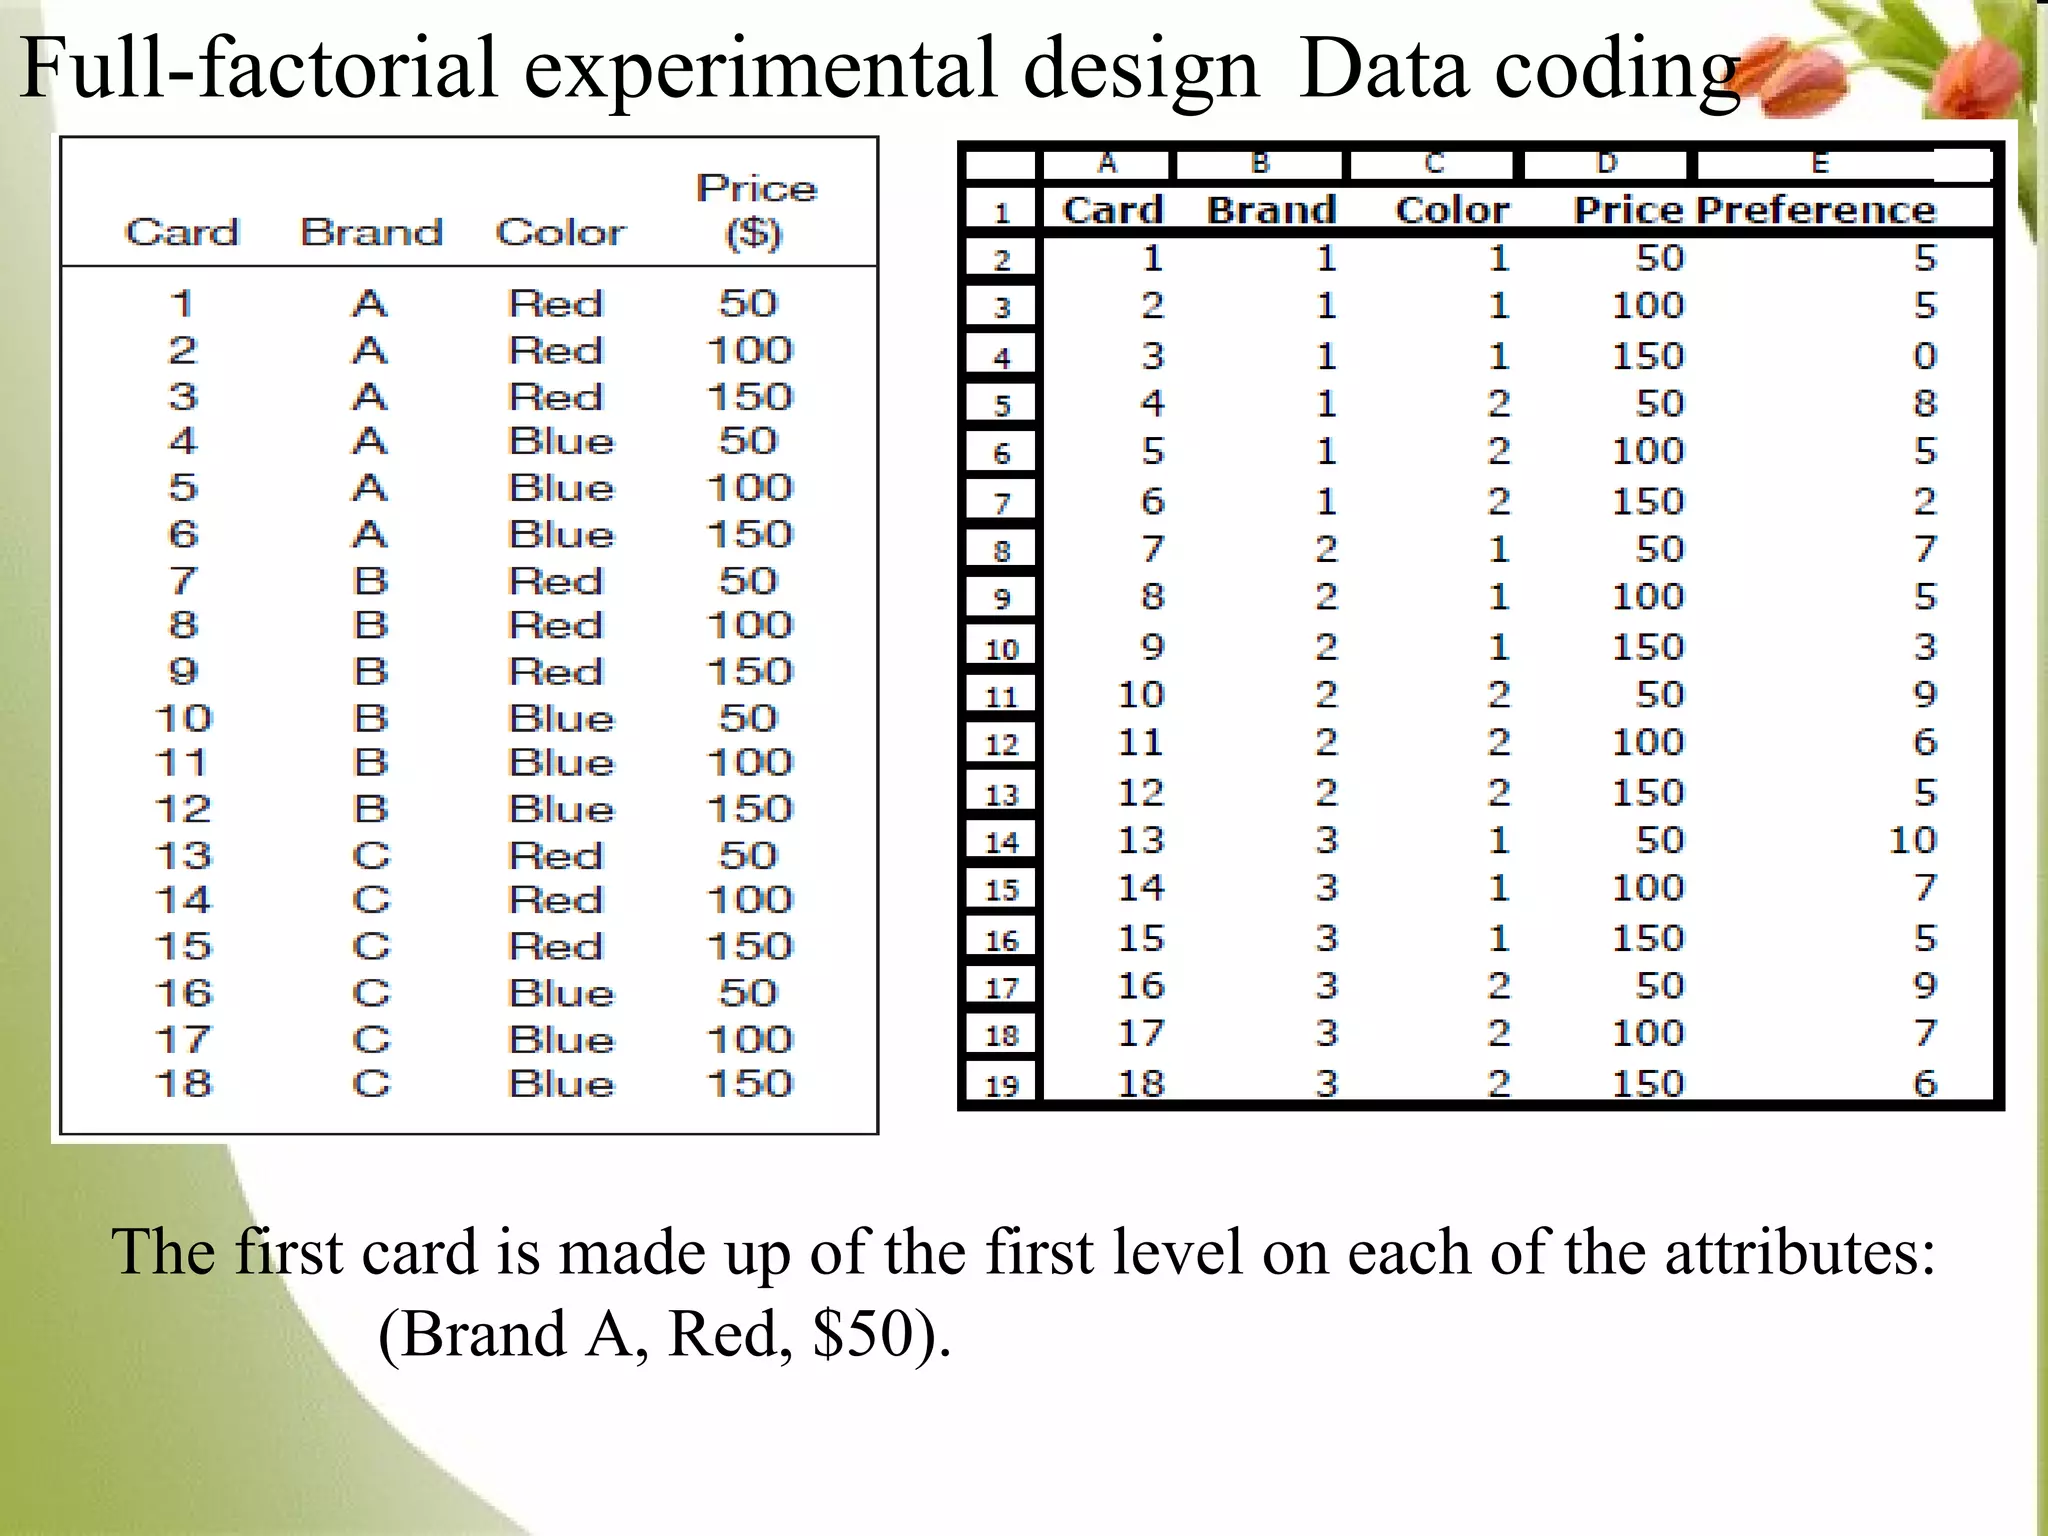
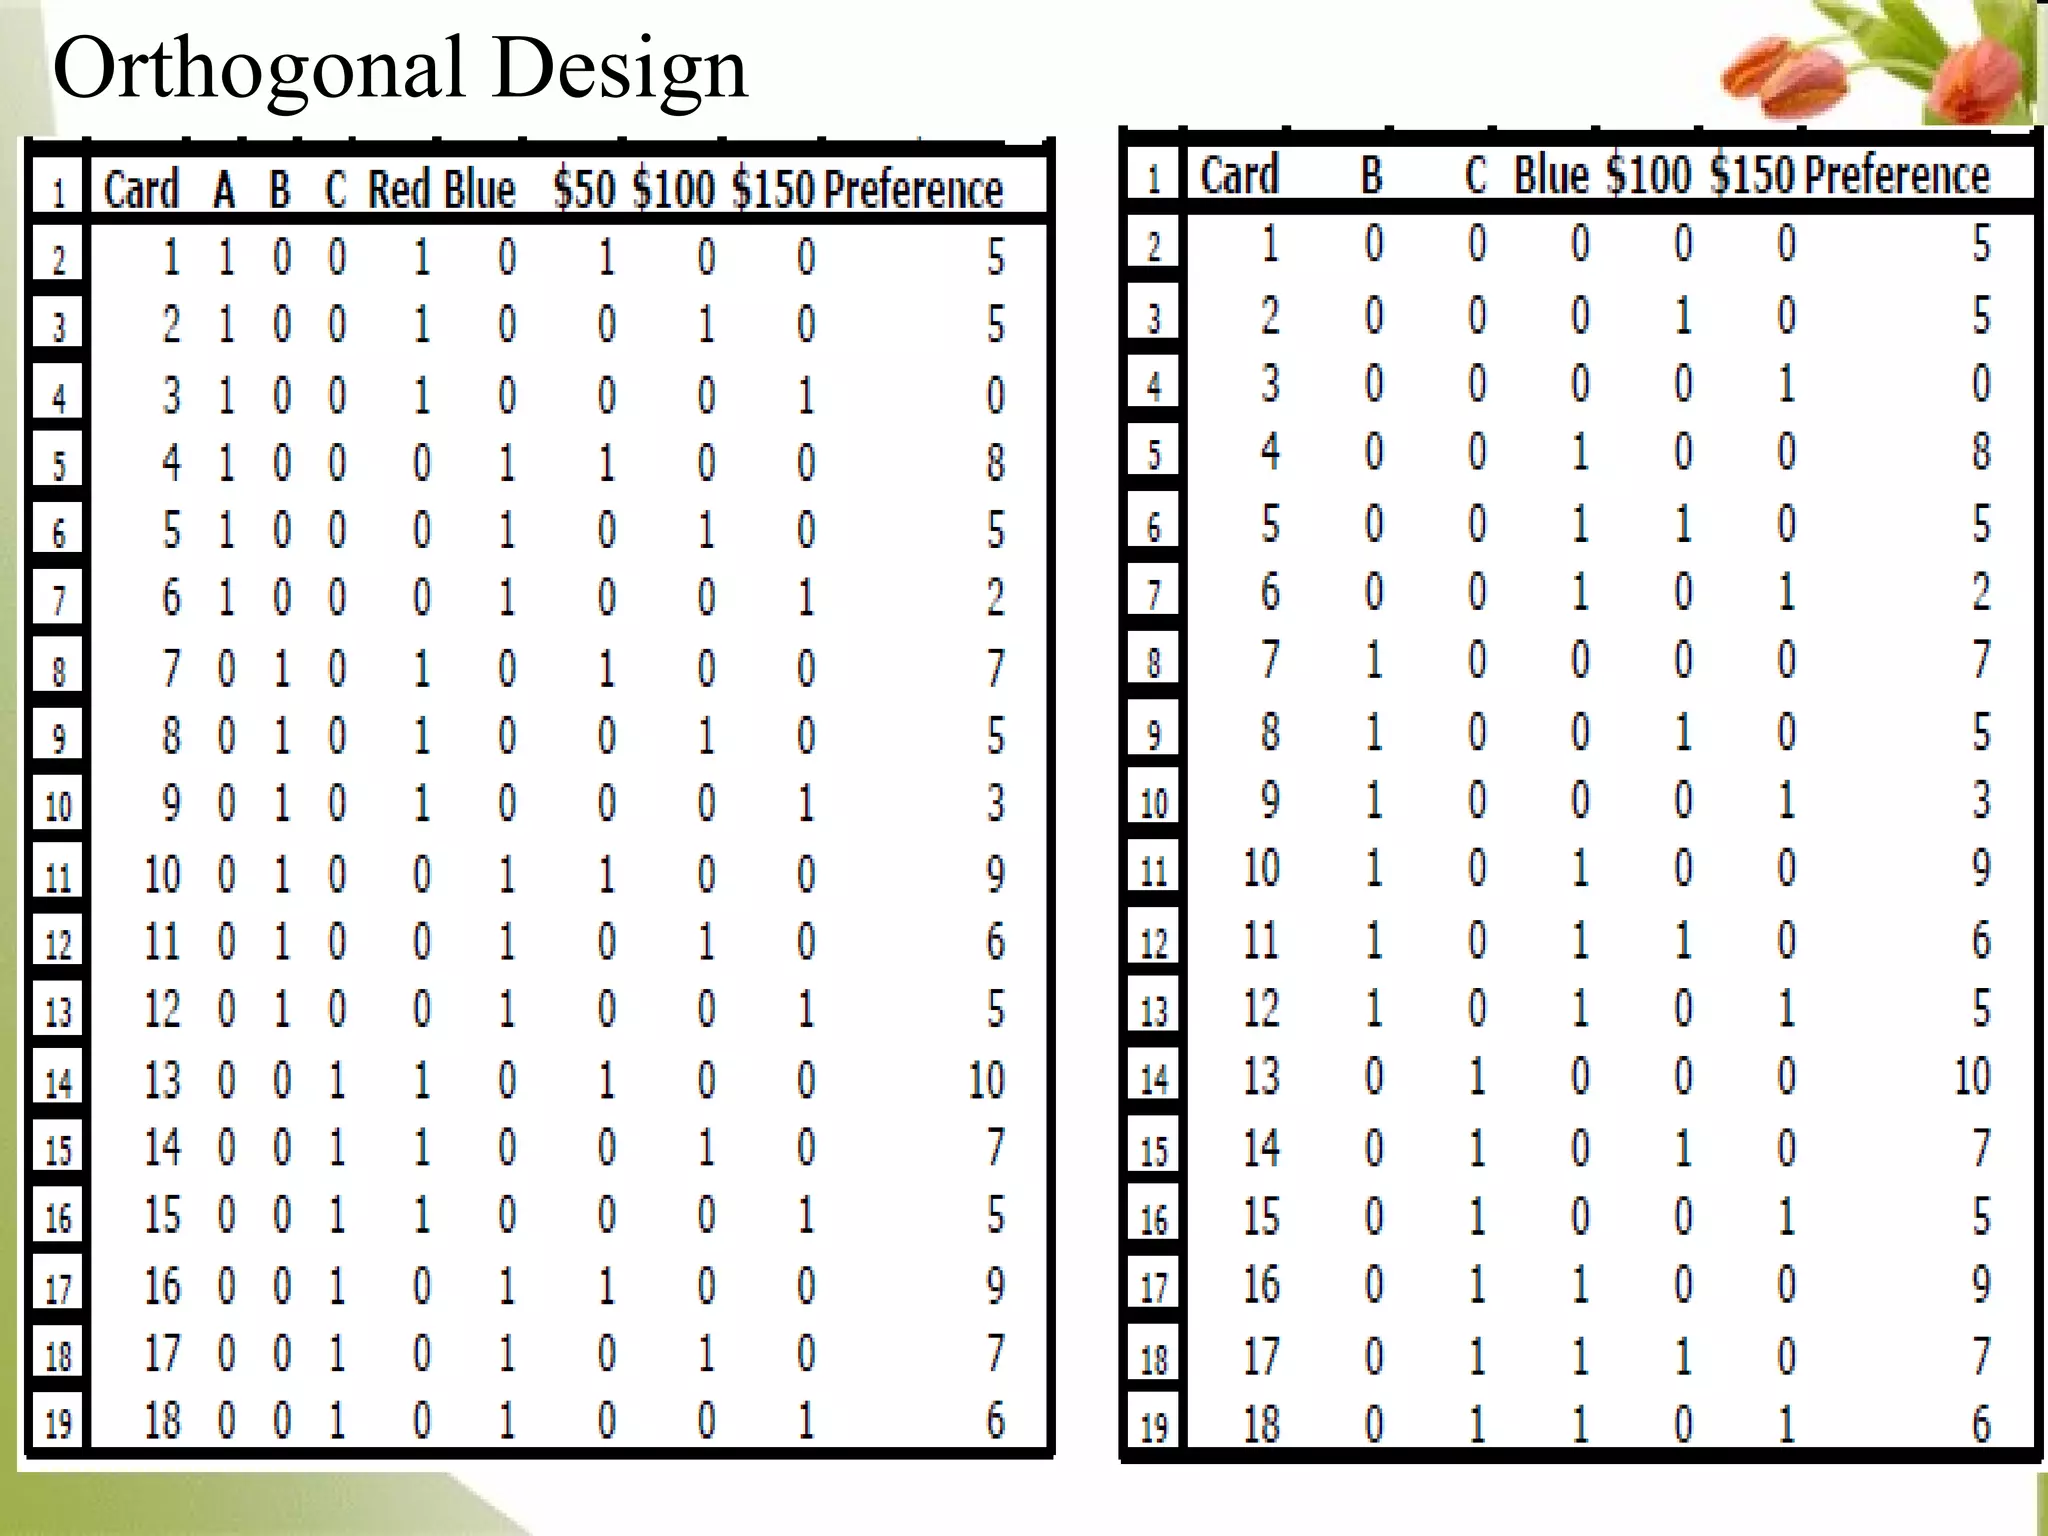
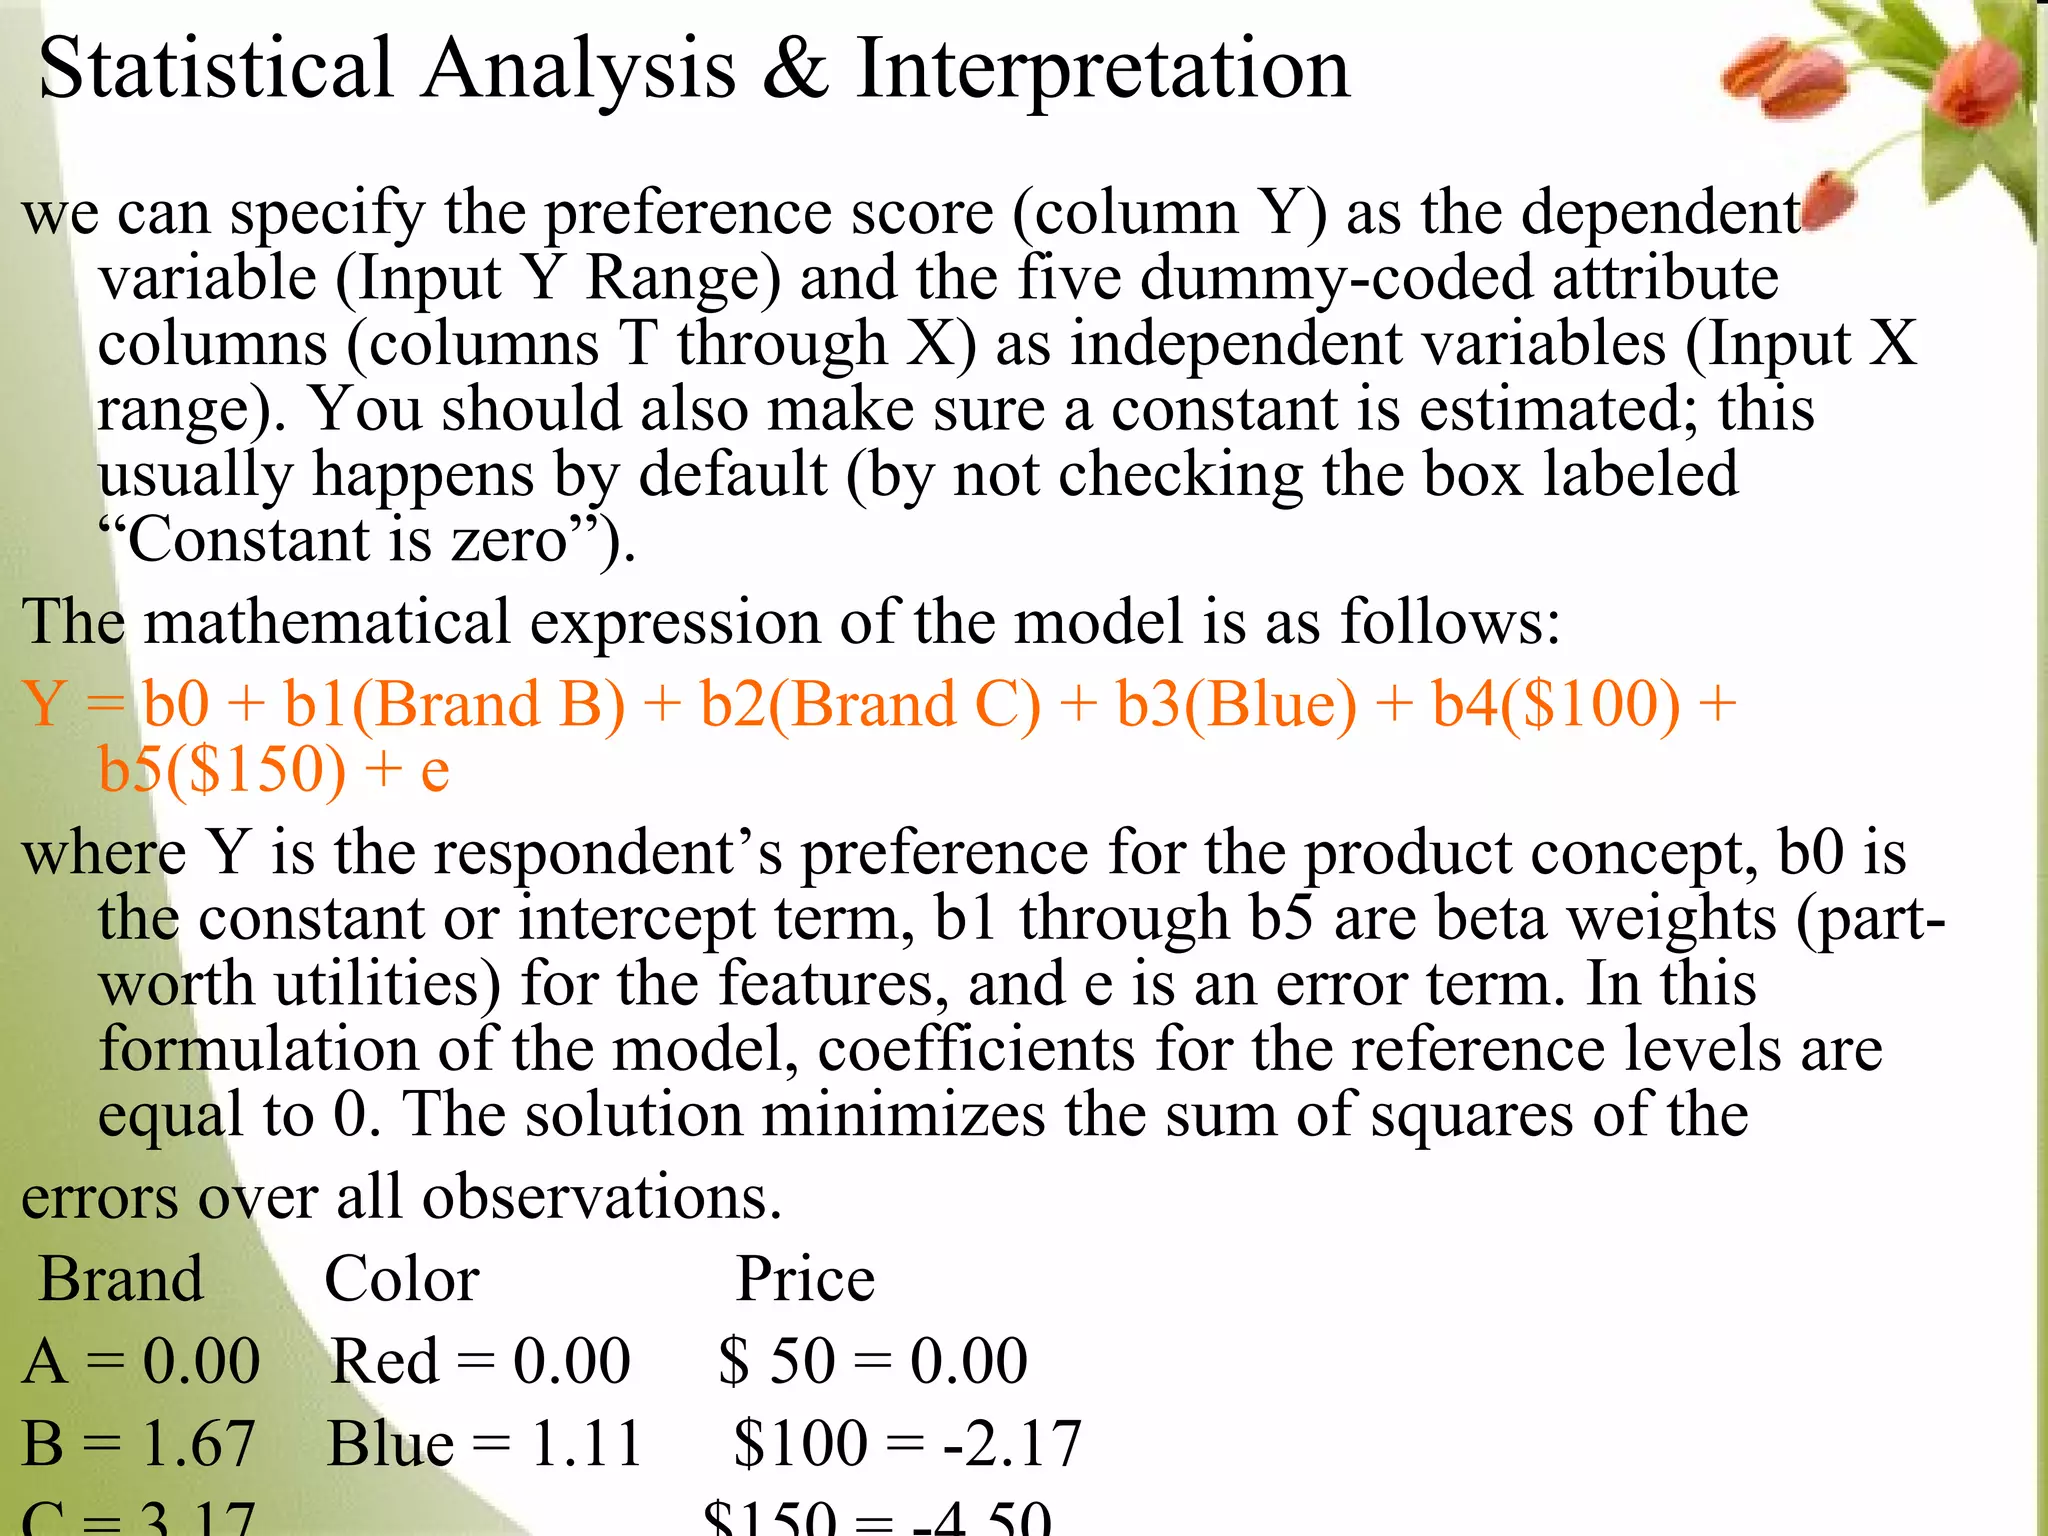
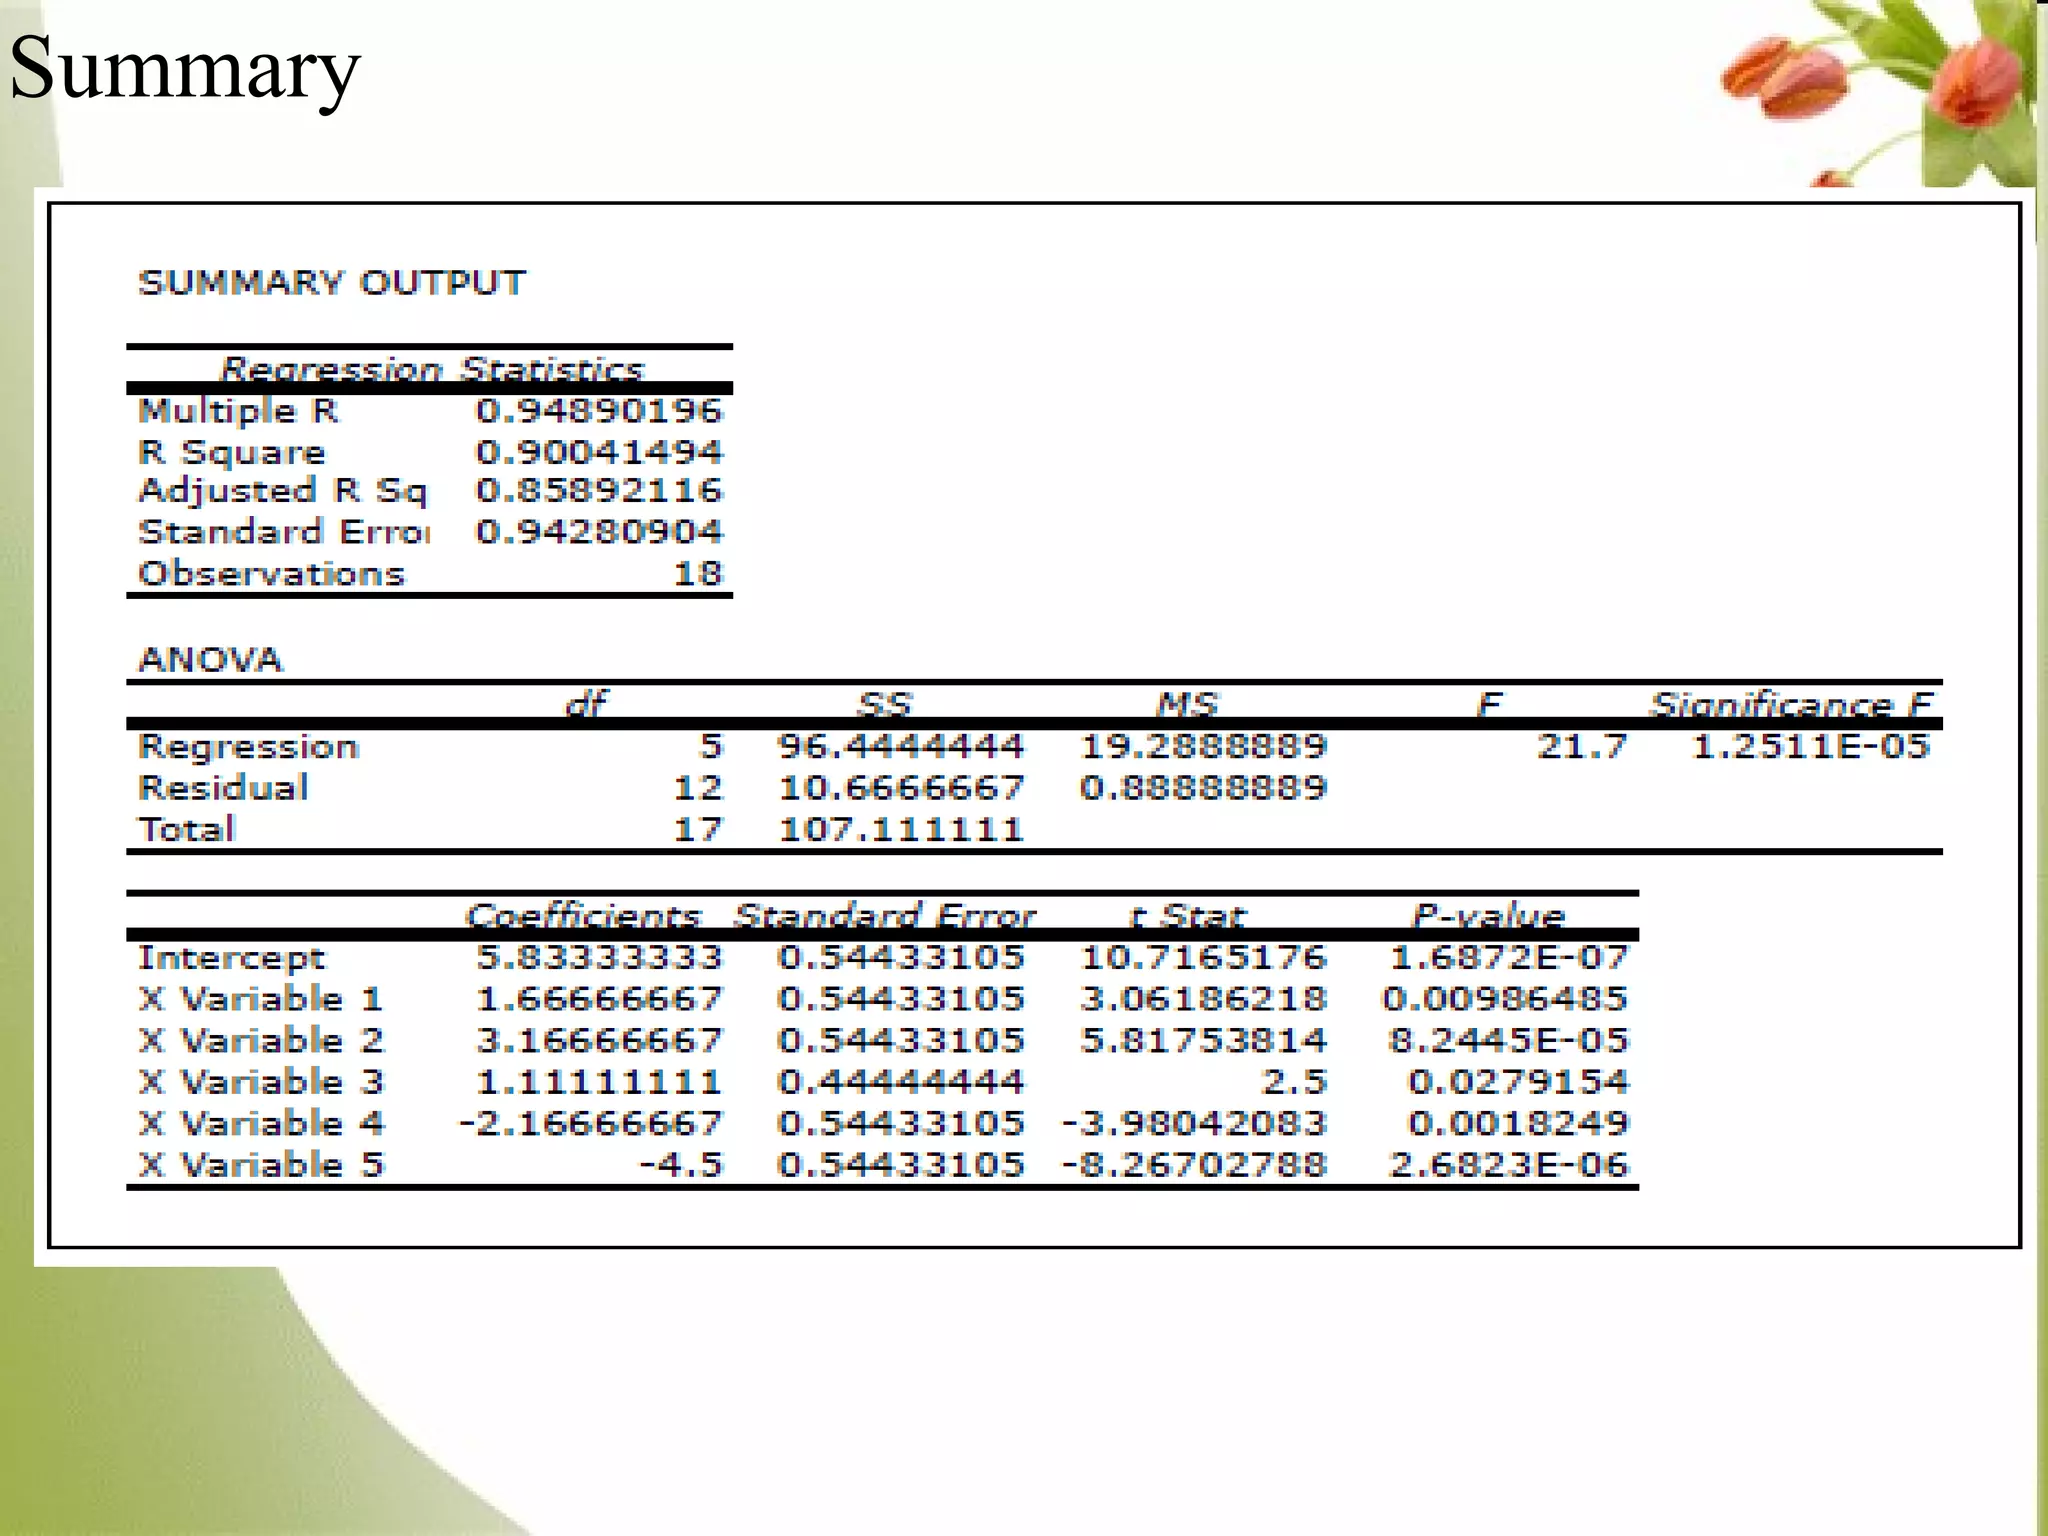
Good Evening   JAI SHREE GANESHAH NAMAH
Production of consumer goods   Research Design Manufacturing Sales Effective market research is integral to the design, manufacture, and sale of successful products.  It identifies the needs and wants of target markets, ensuring that products will sell because they meet the needs of buyers.
Consumer Behavior   ? But what is the best? Needs Wants 5 hours $800 Spacious 8 2 hours $800 Spacious 7 5 hours $225 Spacious 6 2 hours $225 Spacious 5 5 hours $800 Cramped 4 2 hours $800 Cramped 3 5 hours $225 Cramped 2 2 hours $225 Cramped 1 Duration Price Comfort
Conjoint analysis  is a statistical technique used in market research to determine how people value different features that make up an individual product or service. The objective of conjoint analysis is to determine what combination of a limited number of attributes is most influential on respondent choice or decision making. A controlled set of potential products or services is shown to respondents and by analyzing how they make preferences between these products, the implicit valuation of the individual elements making up the product or service can be determined. These implicit valuations (utilities or part-worths) can be used to create market models that estimate market share, revenue and even profitability of new designs. Conjoint Analysis   CONJOINT:-   Joined together; combined
Types   1). Two-factor-at-a-time  2). full-concept method  Let’s Consider a conjoint analysis problem with three attributes, each with levels as follows:  Brand  Color  Price A  Red  $50 B  Blue  $100 C  $150 There are 18 possible product concepts or cards that can be created  from these three attributes:  3 brands × 2 colors × 3 prices = 18 cards Further assume that respondents rate each of the 18 product concepts on a scale from 0 to 10, where 10 represents the highest degree of reference.
Full-factorial experimental design Data coding The first card is made up of the first level on each of the attributes: (Brand A, Red, $50).
Orthogonal Design
we can specify the preference score (column Y) as the dependent variable (Input Y Range) and the five dummy-coded attribute columns (columns T through X) as independent variables (Input X range). You should also make sure a constant is estimated; this usually happens by default (by not checking the box labeled “Constant is zero”). The mathematical expression of the model is as follows:  Y = b0 + b1(Brand B) + b2(Brand C) + b3(Blue) + b4($100) + b5($150) + e  where Y is the respondent’s preference for the product concept, b0 is the constant or intercept term, b1 through b5 are beta weights (part-worth utilities) for the features, and e is an error term. In this formulation of the model, coefficients for the reference levels are equal to 0. The solution minimizes the sum of squares of the errors over all observations. Brand  Color  Price A = 0.00  Red = 0.00  $ 50 = 0.00 B = 1.67  Blue = 1.11  $100 = -2.17 C = 3.17  $150 = -4.50 Statistical Analysis & Interpretation
Summary
Interpretation


Decide to lead

Conjoint Analysis Vinay Kr Singh

  • 1.
    Good Evening JAI SHREE GANESHAH NAMAH
  • 2.
    Production of consumergoods Research Design Manufacturing Sales Effective market research is integral to the design, manufacture, and sale of successful products. It identifies the needs and wants of target markets, ensuring that products will sell because they meet the needs of buyers.
  • 3.
    Consumer Behavior ? But what is the best? Needs Wants 5 hours $800 Spacious 8 2 hours $800 Spacious 7 5 hours $225 Spacious 6 2 hours $225 Spacious 5 5 hours $800 Cramped 4 2 hours $800 Cramped 3 5 hours $225 Cramped 2 2 hours $225 Cramped 1 Duration Price Comfort
  • 4.
    Conjoint analysis is a statistical technique used in market research to determine how people value different features that make up an individual product or service. The objective of conjoint analysis is to determine what combination of a limited number of attributes is most influential on respondent choice or decision making. A controlled set of potential products or services is shown to respondents and by analyzing how they make preferences between these products, the implicit valuation of the individual elements making up the product or service can be determined. These implicit valuations (utilities or part-worths) can be used to create market models that estimate market share, revenue and even profitability of new designs. Conjoint Analysis CONJOINT:- Joined together; combined
  • 5.
    Types 1). Two-factor-at-a-time 2). full-concept method Let’s Consider a conjoint analysis problem with three attributes, each with levels as follows: Brand Color Price A Red $50 B Blue $100 C $150 There are 18 possible product concepts or cards that can be created from these three attributes: 3 brands × 2 colors × 3 prices = 18 cards Further assume that respondents rate each of the 18 product concepts on a scale from 0 to 10, where 10 represents the highest degree of reference.
  • 6.
    Full-factorial experimental designData coding The first card is made up of the first level on each of the attributes: (Brand A, Red, $50).
  • 7.
  • 8.
    we can specifythe preference score (column Y) as the dependent variable (Input Y Range) and the five dummy-coded attribute columns (columns T through X) as independent variables (Input X range). You should also make sure a constant is estimated; this usually happens by default (by not checking the box labeled “Constant is zero”). The mathematical expression of the model is as follows: Y = b0 + b1(Brand B) + b2(Brand C) + b3(Blue) + b4($100) + b5($150) + e where Y is the respondent’s preference for the product concept, b0 is the constant or intercept term, b1 through b5 are beta weights (part-worth utilities) for the features, and e is an error term. In this formulation of the model, coefficients for the reference levels are equal to 0. The solution minimizes the sum of squares of the errors over all observations. Brand Color Price A = 0.00 Red = 0.00 $ 50 = 0.00 B = 1.67 Blue = 1.11 $100 = -2.17 C = 3.17 $150 = -4.50 Statistical Analysis & Interpretation
  • 9.
  • 10.
  • 11.
  • 12.
  • 13.
  • 14.
  • 15.
  • 16.