This document describes an experiment to investigate how the concentration of hydrochloric acid (HCl) affects the conductivity when zinc is added. Five trials were conducted with varying HCl concentrations from 4M to 0.25M and zinc mass held constant at 2g. Conductivity readings were taken every 30 seconds over 150 seconds. Results show conductivity decreasing over time for each trial and conductivity rate declining as HCl concentration decreased from 4M to 0.25M. The goal of understanding how HCl concentration impacts zinc reaction conductivity was achieved. Improving measurement accuracy by precisely controlling variables like zinc mass and HCl volume was suggested.
Controlling of Depth of Dopant Diffusion Layer in a Material by Time Modulati...IJCI JOURNAL
In this paper as a development of recently introduced analytical approach for estimation of temporal characteristics of mass and heat transport we present analysis of diffusion depth of dopant in a material with time varying diffusion coefficient. It has been shown, that changing of time dependence of diffusion coefficient gives a possibility to accelerate or decelerate diffusion process. In this situation it is an actual question is control of diffusion depth during manufacturing p-n-junctions. The controlling gives a possibility to obtain required depth of the junctions, but not larger or smaller.
Poster: Characterizing Ignition behavior through morphing to generic curvesEdward Blurock
The qualitative notion that ignition processes have similar behavior, even over an extensive range of starting conditions, is quantitatively demonstrated through the production of a single ’generic’ ignition curve. The key to the production of the generic curve is the recognition that the basic shapes of the species and temperature profiles occurring in the ignition process differ only in their ’timing’. By ’morphing’ the time scale, the profile shapes can be made to align. From the aligned profile shapes a generic or ’average’ profile can be derived. Synchronizing chemical events modifies the ignition progress times. In addition to fixing the ignition time to have the progress value of one, intermediate ignition events (such as selected profile maxima or inflection points) that occur before ignition are also aligned to have specific ’normalized’ times.
Welcome to International Journal of Engineering Research and Development (IJERD)IJERD Editor
call for paper 2012, hard copy of journal, research paper publishing, where to publish research paper,
journal publishing, how to publish research paper, Call For research paper, international journal, publishing a paper, IJERD, journal of science and technology, how to get a research paper published, publishing a paper, publishing of journal, publishing of research paper, reserach and review articles, IJERD Journal, How to publish your research paper, publish research paper, open access engineering journal, Engineering journal, Mathemetics journal, Physics journal, Chemistry journal, Computer Engineering, Computer Science journal, how to submit your paper, peer reviw journal, indexed journal, reserach and review articles, engineering journal, www.ijerd.com, research journals,
yahoo journals, bing journals, International Journal of Engineering Research and Development, google journals, hard copy of journal
This presentation was given in Cardiff at the European Society of Rheology Conference in 2009. The presentation is about research in "extreme" areas of rheology and includes work on measuring the viscoelasticity of low viscosity fluids and the limiting extensional viscosity of high viscosity fluids.
IJRET : International Journal of Research in Engineering and Technology is an international peer reviewed, online journal published by eSAT Publishing House for the enhancement of research in various disciplines of Engineering and Technology. The aim and scope of the journal is to provide an academic medium and an important reference for the advancement and dissemination of research results that support high-level learning, teaching and research in the fields of Engineering and Technology. We bring together Scientists, Academician, Field Engineers, Scholars and Students of related fields of Engineering and Technology
Determine the velocity constant of alkaline hydrolysis of ethyl acetate by co...PRAVIN SINGARE
This experiment is based on the experimental demonstration of Determine the velocity constant of alkaline hydrolysis of ethyl acetate by conductometric method. The presentation is made for the chemistry undergraduate students of Mumbai University.
Limiting partial molar volumes of Potassium aluminium sulphate in dimethyl su...IOSR Journals
Densities of potassium aluminium sulphate have been measured in dimethyl sulphoxide (DMSO) + water, containing 0, 5, 10, 15, and 20 mass percent of DMSO, at different concentration and at 298.15, 303.15, 308.15 and 313.15 K. From the densities, apparent molar volumes have been derived. The apparent molar volume data have been analyzed using Masson equation. The limiting molar volumes, vф0, and Sv* slop are interpreted in terms of solute-solvent and solute-solute interactions respectively. The vф0 values vary with temperature as power series of temperature. Finally, the structure making/ breaking capacities of salts have been inferred from the Hepler’s criterion.
A short project to find out Critical Micellar Concentration of reverse micelle in non-polar environment. the instrument used is obviously Dynamic Light Scattering Machine.
Inhibitory Effect of Some Carbazides on Corrosion of Aluminium in Hydrochloric Acid and Sodium Hydroxide Solutions
The dissolution of aluminium in hydrochloric acid and sodium hydroxide solutions in the presence of semicarbazide, thiosemicar- bazide and sym.dipheny1carbazide as corrosion inhibitors has been studied using thermometric, weight-loss and polarization methods. The three methods gave consistent results. The higher inhibition efficiency of these compounds in acidic than in alkaline madia may be due to the less negative potential of aluminium in hydrochloric acid solution, favouring adsorption of the additive.The adsorption of these compounds were found to obey Frurnkin adsorption isotherm. Cathodic polarization measurements showed that these com- pounds are cathodic inhibitors and their adsorption in the double layer does not change the mechanism of the hydrogen evolution reaction. The results are analysed in terms of both molecular and cationic adsorption.
Using Ethylthiazole-4-Carboxylate as Inhibitor for Copper Corrosion in 0.5 M ...paperpublications3
Abstract: In this research was the study effect of ethylthiazole-4-carboxylate as inhibitor on copper corrosion in 0.5M HCl acid by using weight loss and polarization methods, results showed of decrease corrosion current density and corrosion rate with increasing inhibitor concentration of corrosion at 30 C and corresponding increase the efficiency of inhibition and surface coverage, the same way for the temperature of 40 and 50 C , where efficiency decreases depending on the temperature increase. Increase the inhibitor concentration, increased energy both activation, enthalpy and free of adsorption and decreased entropy energy, and this shows that the inhibitor has good energy to activate the process of adsorption and desorption be chemical type from good type inhibitor. Formation layer of film due found oxygen, nitrogen and sulphur molecules which have a crucial role to build the film.
Images and data in the presentation are subject to copyright. Please contact redhwanm(at)mcmaster(dot)ca for permission if you want to use any of its contents.
Electrochemical Treatment of Acid Green V dye solution in a tubular flow reactorIJERD Editor
International Journal of Engineering Research and Development is an international premier peer reviewed open access engineering and technology journal promoting the discovery, innovation, advancement and dissemination of basic and transitional knowledge in engineering, technology and related disciplines.
To find the susceptibility arising due to water in the solution of MnCl2 , ionic molecular susceptibility ,magnetic moment of the Mn++ using quinche's Method
ARENA - Young adults in the workplace (Knight Moves).pdfKnight Moves
Presentations of Bavo Raeymaekers (Project lead youth unemployment at the City of Antwerp), Suzan Martens (Service designer at Knight Moves) and Adriaan De Keersmaeker (Community manager at Talk to C)
during the 'Arena • Young adults in the workplace' conference hosted by Knight Moves.
White wonder, Work developed by Eva TschoppMansi Shah
White Wonder by Eva Tschopp
A tale about our culture around the use of fertilizers and pesticides visiting small farms around Ahmedabad in Matar and Shilaj.
Visual Style and Aesthetics: Basics of Visual Design
Visual Design for Enterprise Applications
Range of Visual Styles.
Mobile Interfaces:
Challenges and Opportunities of Mobile Design
Approach to Mobile Design
Patterns
Fonts play a crucial role in both User Interface (UI) and User Experience (UX) design. They affect readability, accessibility, aesthetics, and overall user perception.
Storytelling For The Web: Integrate Storytelling in your Design ProcessChiara Aliotta
In this slides I explain how I have used storytelling techniques to elevate websites and brands and create memorable user experiences. You can discover practical tips as I showcase the elements of good storytelling and its applied to some examples of diverse brands/projects..
Maximize Your Content with Beautiful Assets : Content & Asset for Landing Page pmgdscunsri
Figma is a cloud-based design tool widely used by designers for prototyping, UI/UX design, and real-time collaboration. With features such as precision pen tools, grid system, and reusable components, Figma makes it easy for teams to work together on design projects. Its flexibility and accessibility make Figma a top choice in the digital age.
Explore the essential graphic design tools and software that can elevate your creative projects. Discover industry favorites and innovative solutions for stunning design results.
Decormart Studio is widely recognized as one of the best interior designers in Bangalore, known for their exceptional design expertise and ability to create stunning, functional spaces. With a strong focus on client preferences and timely project delivery, Decormart Studio has built a solid reputation for their innovative and personalized approach to interior design.
Technoblade The Legacy of a Minecraft Legend.Techno Merch
Technoblade, born Alex on June 1, 1999, was a legendary Minecraft YouTuber known for his sharp wit and exceptional PvP skills. Starting his channel in 2013, he gained nearly 11 million subscribers. His private battle with metastatic sarcoma ended in June 2022, but his enduring legacy continues to inspire millions.
1. Conductivity rate
Background information
-Conductivity is the measure of the ability of a material to conduct either electricity of heat.
The purpose of this experiment is to observe the relationship between the concentration in the
molar of HCl and the conductivity rate. In this experiment, 2g of Zinc will be added to different
molar of HCl and it will be constant. The change that we observe will between thirty second.
There will be five data point and each will have five different decrease or increase conductivity.
Each data point will be presented graphically to see their relationship.
Materials
1. 5-250ml beaker
2. Conductivity Probe
3. Water
4. HCl
5. Zn
6. Timer
7. Goggle
8. Balance
9. Calculator
10. Cylinder
11. Stamp
Safety
Goggle on
Do not touch the reaction
No Food
Wash hand after done
Siang ZaLian Page 1
2. Design
1. How does the change in concentration of HClaffect the conductivity in adding Zinc.
2HCl + Zn ------ H2 + ZnCl2
Independent Variable: Pressure
Dependent Variables: conductivity, time
Controlled Variable: Temperature(degree), Mass(g), HCl
2. Pressure: In this experiment, pressure is totally independent.
Time: You will observe how the reaction rate changes in every 30 second.The time will
stop at 180s.
Mass(Zn): You must weigh the mass of Zinc. It mass be 2g for each data point.
Conductivity: This is the most vital part; you need to record the conductivity data on
your table.
Temperature: Temperature is the one variable that you want to keep constant as possible
as you can, because as result of the temperature change the reaction rate will vary also.
Procedure
1. Be ready with your materials.
2. Put .1 mole of HCl in the beaker
3. Weight any that is less than 5g of Zinc; Keep it constant every trial.
4. Play the conductivity probe and drop the amount of Zinc that you measure at the
same time. The probe will play 180s.
5. Stir a little bit at the same speed for each trial.
6. After 180s pass, record the conductivity of Zinc at 30s, 60s, 90s, 120s, and 150s on
the data point table.
7. Repeat the step above but increase HCl by .3 moles.
Siang ZaLian Page 2
3. The original goal is to investigate how the increasing ofconcentration of Hydrogen
chloride affects the conductivity when combine with constant Zinc mass.
Graph of Reaction
The Conductivity at 4M of HCl
Experiment Zn (g) HCl Time(s) Conductivity(µS/cm)
Data point1 2 4M 30 29605
60 28931
90 28352
120 27632
150 27072
The Conductivity at 2 M of HCl
Experiment Zn (g) HCl Time(s) Conductivity (µS/cm)
Data point 2 2 2M 30 30771
60 30648
90 30629
120 30572
150 30524
The Conductivity at 1M of HCl
Experiment Zn (g) HCl Time(s) Conductivity(µS/cm)
Data point 3 2 1M 30 31094
60 31084
90 31046
120 30952
150 30942
The conductivity at .5M of HCl
Experiment Zn (g) HCl Time(s) Conductivity(µS/cm)
Data point 4 2 .5M 30 31198
Siang ZaLian Page 3
4. 60 31122
90 31110
120 31103
150 31008
The conductivity at .25M of HCl
Experiment Zn (g) HCl Time(s) Conductivity(µS/cm)
Data point 5 2 .25M 30 31008
60 30904
90 30771
120 30762
150 30696
Molar of HCl Conductivity rate(µS/cm.s)
4 2.532
2 3.425
1 3.447
.5 3.456
.25 3.425
Evaluating
To calculate conductivity rate, the five conductivities result must be add and divide
them each by 5. Now I get the average for each data point. What I want to get is that
by how much does the conductivity decrease per second for each data point.
Siang ZaLian Page 4
5. 4M of HCl
Sum = 113960/5 = 22792(Average)
Total time = 150 minute * 60 = 9000s
Conductivity rate = 2.532 µS/cm.s
2M HCl
Sum = 153144/5 = 30628.8(Average)
Conductivity rate = 30628.8/9000 = 3.403 µS/cm.s
1M HCl
Sum = 155118/5 = 31023.6(Average)
Conductivity rate = 31023.6/9000 = 3.447 µS/cm.s
.5M HCl
Sum= 155541/5 = 31108.2(Average)
Conductivity rate = 31108.2/9000 = 3.456 µS/cm.s
.25M of HCl
Sum = 154141/5 = 30828.2 (Average)
Total time = 150 minute * 60 second = 9000s
Conductivity rate = 30828.2/9000 = 3.425µS/cm.s
Siang ZaLian Page 5
6. Conductivity vs Time
30000
29500
29000
Conductivity
28500
28000
4 M HCl
27500 Conductivity(µS/cm)
27000
26500
0.0 50.0 100.0 150.0 200.0
Time
This graph is the result of the concentration of 4M of HCl reacting with 2 g of Zinc. Each
dot on the graph represents the conductivity after 30 second. In this reaction, the reaction
rate of the conductivity is 2.532µS/cm.s. The line is very straight compare others because
the reaction is very strong and fast.
Conductivity(µS/cm) Vs Time
30800
30750
Conductivity
30700
30650
30600 2MHCl
Conductivity(µS/cm)
30550
30500
0.0 50.0 100.0 150.0 200.0
Time
Siang ZaLian Page 6
7. This graph represents the reaction of Zinc in 50 ml of 2M of HCl. There is a little curve in the
middle of the line. That’s because the reaction is much slower than the previous one. According
to the calculation, the conductivity rate is 3.403 µS/cm.s.
Conductivity(µS/cm) vs TIme
31120
31100
31080
31060
Conductivity
31040
31020
31000 1 M HCl
30980 conductivity(µS/cm)
30960
30940
30920
0.0 50.0 100.0 150.0 200.0
Time
The third graph show the conductivity over time when reacting 1M of HCl with Zinc.
Base on the graph, it shows that the reaction was very slow with round curve. From the
calculation, the rate at which the conductivity does down per second is 3.447 µS/cm.s
Siang ZaLian Page 7
8. Conductivity (µS/cm) vs Time
31250
31200
31150
Conductivity
31100
.5M HCl Conductivity
31050 (µS/cm)
31000
30950
0.0 50.0 100.0 150.0 200.0
Time
This is the graph in which two gram of Zinc is reacted with .5M of HCl. The reaction of
Zinc in .5M of HCl is very weak that the reaction could hardly be seen in the middle of
the time or reaction. The conductivity rate in this reaction is 3.456 µS/cm.s.
Siang ZaLian Page 8
9. Conductivity(µS/cm) vs Time
31050
31000
30950
Conductivity
30900
30850
30800 .25M HCl
30750 Conductivity(µS/cm)
30700
30650
0.0 50.0 100.0 150.0 200.0
Time(s)
Unlike others graph, this graph look more like the first graph. The line it creates is very straight
line. We can see a little bit curve(stop) at around hundred second. In the reaction, it’s hard to if
the reaction whether the reaction occur because of too much H2O and too little HCl. Base on the
calculation, the conductivity rate for this reaction is 3.425µS/cm.s.
Siang ZaLian Page 9
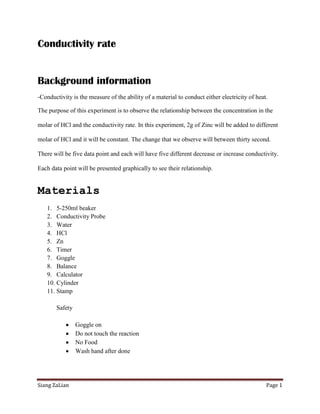
10. Zinc(g) +/-.005 (Volume) Uncertainty Uncertainty
+/- .5 Zinc Volume
2 50 0.01 1
2 50 0.01 1
2 50 0.01 1
2 50 0.01 1
2 50 0.01 1
Conductivity rate
4
3.5
3
2.5
Conductivity rate
2
1.5
Conductivity rate
1
0.5
0
0 1 2 3 4 5
Molar of HCl
This graph represent the conductivity rate over the decreasing of the molar of HCl.
The conductivity rate decrease as the molar of HCl is increased.
Siang ZaLian Page 10
11. Conclusion
The goal of the experiment was to investigate how the change in the concentration of HCl affects
the electrical conductivity when the amount of Zinc is controlled. Base on the experiment, we
can acknowledge that when HCl and Zinc is reacted the conductivity decrease depend on how
much of each is used. The more HCl is used the less the conductivity, inversely is true. We also
know that H2O conduct more electric than HCl, which means the electrical current can flow
more rapidly through water although water is one of the substance or elements that conduct
electric. As the Molar of HCl is reduce therate of the conductivity seem to increase but the
reaction is fast when there is more HCl. The whole assumption is that difference of the rate of
the conductivity in which the molar of HCl is decreased in constant mass of Zinc is
.191µS/cm.s.
Improving the investigation
There are many factors that could be controlled better. Something that could be improve in this lab is that
the mass of Zinc, it mass be added the same amount as required in the lab. If some or even 1 mass is lost,
it could vary the data collecting. Even though exactly 50 ml is required, the exact millimeter might have
not been measure and that is one of the reason the data are not accurate. Actually this experiment should
be done by two people. Because someone must play the application for the conductivity while the other
drop Zinc, in that way the more accurate information could be recorded. The time is very important. It
need more time when HCl is decreasing, because the reaction will not start instantly if you have a few
molar of HCl. In that case, you need to wait for a long time to observe the reaction happen. Otherwise
your information is less accurate.
Siang ZaLian Page 11