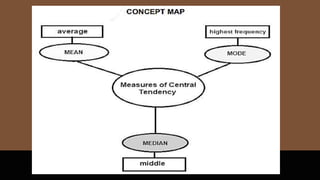
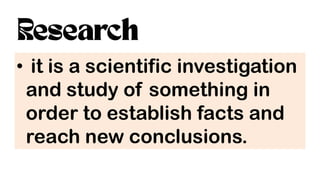
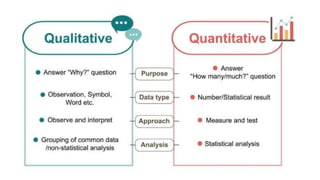
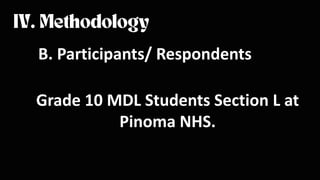
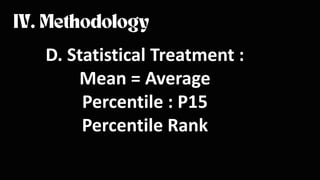
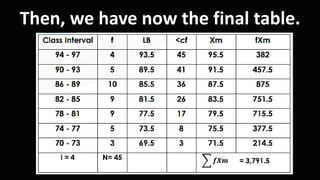
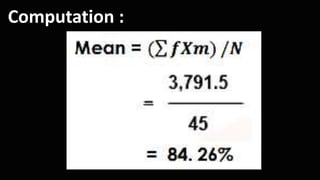
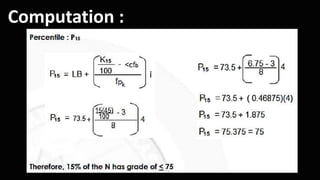
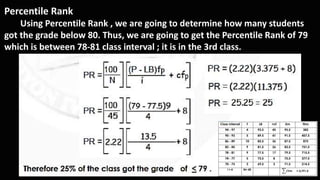
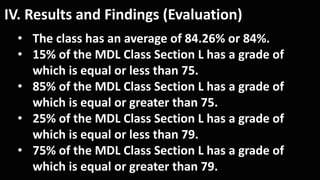
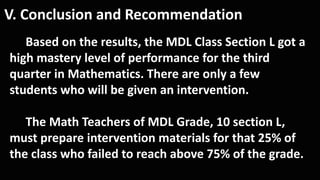
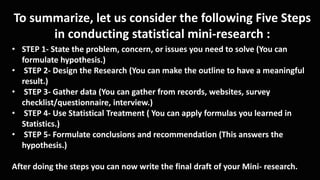
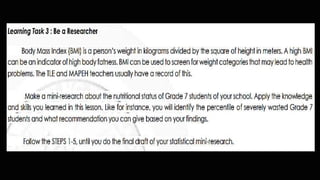
20. Look at the pictures below, does it illustrate something?
What can you say about it ?
21. Let us use the number in
each card in reviewing the
concepts about the measures
of central tendency and
variability.These numbers are
: 7, 10, 8, 4, 6, 3, 7
25. b. Median :
(To identifify the median, we need to put the
data in an array from lowest to greatest.)
3, 4, 6, 7, 7, 8 , 10
We can see that the middle is 7,
therefore, the median is 7.
26. C. Mode :
is the number that occurs the most
frequently.
3, 4, 6, 7, 7, 8 , 10
The mode is 7
30. โข it is a scientific investigation
and study of something in
order to establish facts and
reach new conclusions.
31. โResearch is a systematic
inquiry to describe, explain,
predict, and control the
observed phenomenon. It
involves inductive and
deductive methods.โ
32. โข comes from two words RE
(again) and SEARCH (to seek
for)
34. Illustrative Example
Suppose you want to know the level
of performance of MDL students in
Mathematics for the third quarter,
thus, you are prompted to conduct a
statistical mini-research.
35. The Performance of Students in
Mathematics of Grade 10 MDL Students in
Pinoma National High School of 3rd
Quarter S.Y. 2020-2021
36. For some reason, Mathematics is one of the
unloved subjects. Many students have low
grades and lack interest in the subjects. Thus,
teachers need to know who among the
students are experiencing difficulties with and
make an intervention that will help them to
overcome these.
37. This mini-research will help the researcher
determine the performance of Grade 10 MDL
Section L Students
in Mathematics at Pinoma National High School
for the 3rd quarter of S.Y. 2020-2021.
38. The research can be able to identify those
students who need help and intervention
on the subject. This will reveal if the
students in MDL class are struggling with
mathematics or not.
39. A. Research Design
This is quantitative research.
Documentary analysis and purposive
sampling was used
in conducting this mini-research.
45. The first thing you should do is to
create a frequency table
46. A frequency table is a table that list
items and shows the number of
times the items occur. We represent
the frequency by
the English alphabet โfโ
50. Percentile Rank
Using Percentile Rank , we are going to determine how many students
got the grade below 80. Thus, we are going to get the Percentile Rank of 79
which is between 78-81 class interval ; it is in the 3rd class.
52. IV. Results and Findings (Evaluation)
โข The class has an average of 84.26% or 84%.
โข 15% of the MDL Class Section L has a grade of
which is equal or less than 75.
โข 85% of the MDL Class Section L has a grade of
which is equal or greater than 75.
โข 25% of the MDL Class Section L has a grade of
which is equal or less than 79.
โข 75% of the MDL Class Section L has a grade of
which is equal or greater than 79.
53. V. Conclusion and Recommendation
Based on the results, the MDL Class Section L got a
high mastery level of performance for the third
quarter in Mathematics. There are only a few
students who will be given an intervention.
The Math Teachers of MDL Grade, 10 section L,
must prepare intervention materials for that 25% of
the class who failed to reach above 75% of the grade.
54. VI. References
Here , you list down the books, journals, links , etc.
that helps you in conducting this mini-research.
55. To summarize, let us consider the following Five Steps
in conducting statistical mini-research :
โข STEP 1- State the problem, concern, or issues you need to solve (You can
formulate hypothesis.)
โข STEP 2- Design the Research (You can make the outline to have a meaningful
result.)
โข STEP 3- Gather data (You can gather from records, websites, survey
checklist/questionnaire, interview.)
โข STEP 4- Use Statistical Treatment ( You can apply formulas you learned in
Statistics.)
โข STEP 5- Formulate conclusions and recommendation (This answers the
hypothesis.)
After doing the steps you can now write the final draft of your Mini- research.
70. Learning Task 2 : Based on Research
Conduct a mini-research on studentsโ
performance in their third quarter summative test
in Mathematics. Apply the knowledge and skills
you have learned in this lesson based on the test
results and make/formulate meaningful decisions
based on the results to resolve the identified
problem, concern, or issue.
71. Learning Task 2 : Based on Research
Grade 10 SPJ โ Grade 10 Zeus
Grade 10 Zeus โ Grade 10 Selene
Grade 10 Selene โ Grade 10 Athena
Grade 10 Athena โ Grade 10 SPJ
Editor's Notes
From the previous lessons you have already learned and identified the measures of position and the process of computing.
Now that you have a deeper understanding of these concepts, in this lesson, you are going to apply the concepts you learned in formulating statistical mini-research. But before we proceed, let us check our previous knowledge about sampling techniques, measures of central tendency, and variability
A population consists of all the objects or events of a certain type about which researchers seek knowledge or information. A population might be broad in scope (e.g., adult males living in the United States) or narrow (e.g., blog postings in the first 24 hours after a significant event). A population is the entire group that you want to draw conclusions about.
Even when a population consists of a relatively small number of objects or events, it is often impractical or impossible to gather data about each member of the population. Instead, researchers select a subset of the population, called a sample, which is a manageable size for observation. From their observations about the sample, researchers make generalizations about the population from which the sample was chosen. A sample is the specific group that you will collect data from. The size of the sample is always less than the total size of the population.
A measure of central tendency is a single value that attempts to describe a set of data by identifying the central position within
that set of data
Maen
Since you are going to conduct a statistical mini-research, the aforementioned terminologies are important, and applications
also of the computational knowledge you gained are significant.
Solution :
The picture above illustrates the tabletop game using cards. This game is called Solitaire (Solitaryo in tagalog ay larong nagsasanay ng utak ) and can be played by one person. This is popular among people even in the old times, particularly in a remote area. We can observe our grandparents playing these tabletop game cards solely while resting after a hard time working from the farm. Solitaire is an excellent way to diffuse any tension in oneโs mind or body and helps the person enjoys the day or get to sleep better at night; enough sleep keeps the body healthy. It gives the mind something to focus on, particularly in times of low action when the opportunity to fret is high.
Let us make a Concept Map about the measures of central tendency and use the numbers shown from the cards to identify the mean, median , mode, range, and interquartile range.
Now that you have reviewed the concepts about measures of central tendency and variability; and you have already learned and identified measures of position and the process of computing and interpreting results. All these concepts are significant as you learn the lesson on how to conduct a statistical mini-research and be able to answer the guide question: โHow can the position of data be described and used in solving problems?โ
Research is the careful consideration of study regarding a particular concern or research problem using scientific methods.
According to the American sociologist Earl Robert Babbie, โresearch is a systematic inquiry to describe, explain, predict, and control the observed phenomenon. It involves inductive and deductive methods.โ
Research is the careful consideration of study regarding a particular concern or research problem using scientific methods.
Note:
-Research is not only about the discovery of something unknown but it is coming up with a new explanation of something that is known.
-Research is a process. It is a process of searching for something to solve for an existing problem or difficulty that needs to solve.
But I will not discuss in detailed the concept of the research as a topic because 1 hour or weeks is not enough. There will be a particular subject for this research, especially when you move to SHS. What I will show you is the concept of mini-statistical research preparatory concepts and ideas for college and shs. Now letโs have a sample.
Title must be specific.
The background of a study is the first section of the paper and establishes the context underlying the research. It contains the rationale, the key problem statement, and a brief overview of research questions that are addressed in the rest of the paper.
A statement of the problem is used in research work as a claim that outlines the problem addressed by a study. The statement of the problem briefly addresses the question: What is the problem that the research will address?
The problem must be reflected in your title. It means to talk about the subject matter of your paper. Ina way it means describing the issue you are going to investigate and solve.
This focuses the question: โWho will benefit from the study? It also states the contribution and usefulness of your study in the society.
Research design is a plan to answer your research question.
The main difference between quantitative and qualitative research is the type of data they collect and analyze.
-Quantitative research collects numerical data and analyzes it using statistical methods. The aim is to produce objective, empirical data that can be measured and expressed in numerical terms. Quantitative research is often used to test hypotheses, identify patterns, and make predictions.
-Qualitative research, on the other hand, collects non-numerical data such as words, images, and sounds. The focus is on exploring subjective experiences, opinions, and attitudes, often through observation and interviews.
(This is most important part of statistics, data should be collected accurately and convenient to use.)
A statistical treatment is a summary of the procedure, including statistical methods used.
(This is most important part of statistics, data should be collected accurately and convenient to use.)