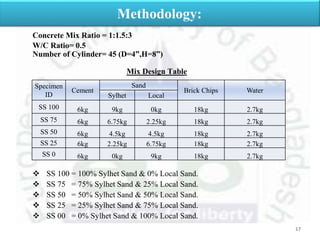
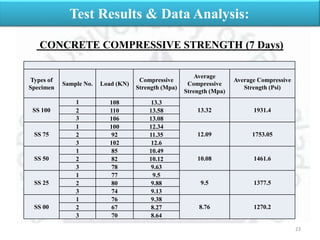
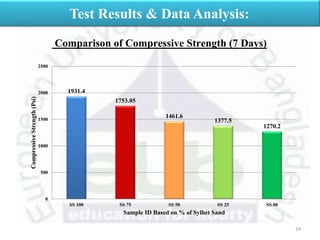
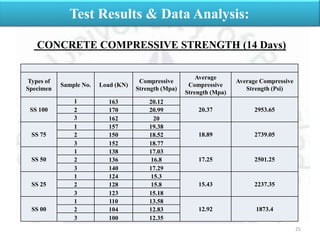
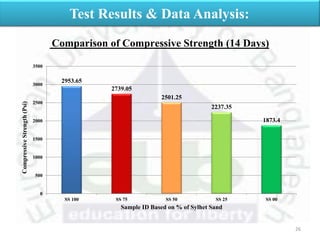
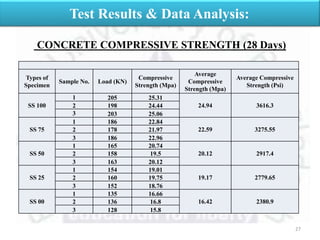
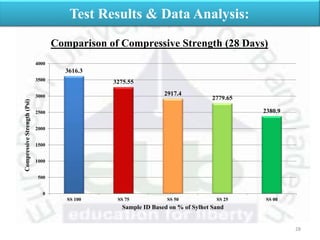
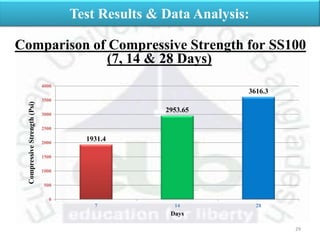
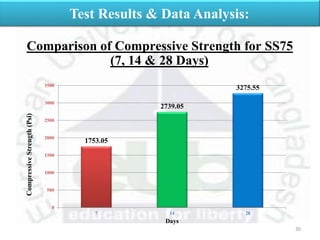
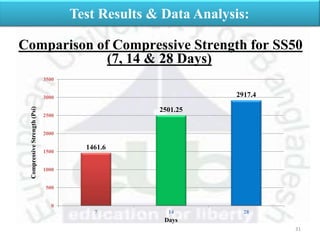
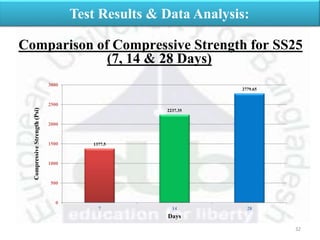
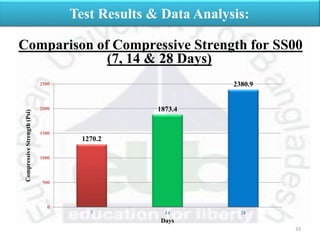
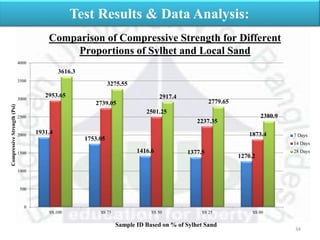
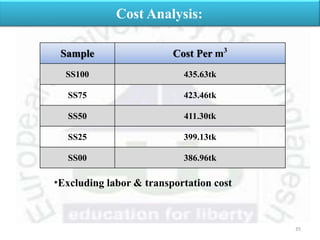
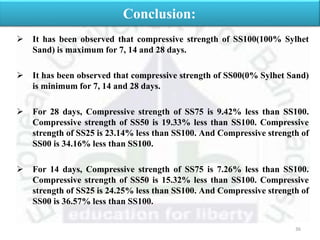
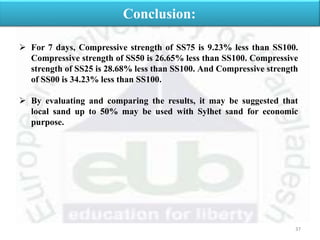
This document summarizes a presentation on the effect of different proportions of local and Sylhet sand on the compressive strength of concrete. The presentation outlines the objectives, methodology, test results and conclusions. Testing involved casting concrete cylinders with varying ratios of local to Sylhet sand and testing compressive strength at 7, 14, and 28 days. Results showed compressive strength was highest with 100% Sylhet sand and lowest with 100% local sand. A ratio of 50% local sand provided acceptable strength at lower cost.


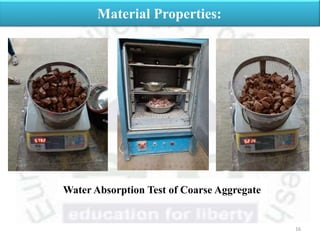
![ Water Absorption Capacity of Coarse Aggregate:
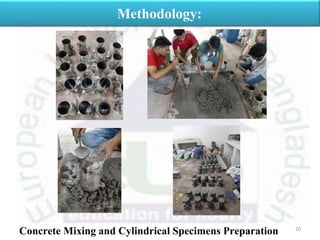
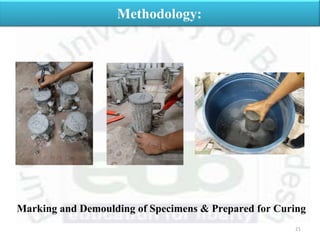
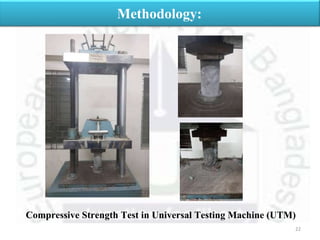
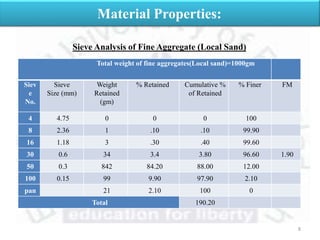
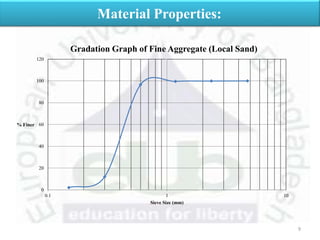
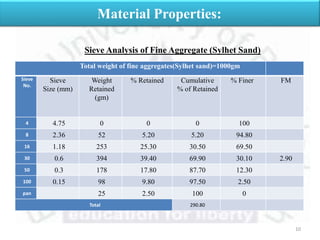
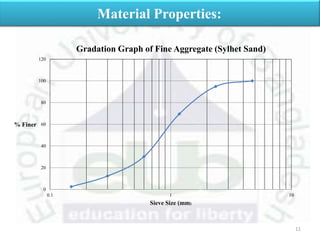
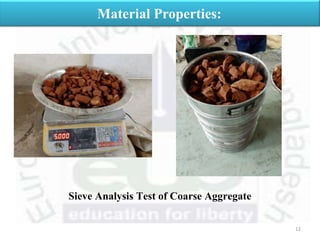
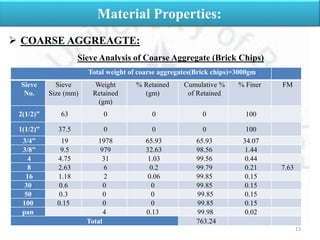
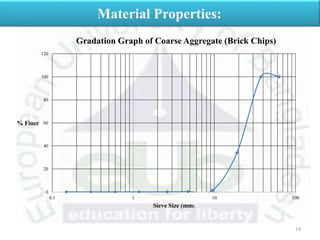
Material Properties:
Wet Weight after 24 hours
Immersion= 5792 gm
Oven Dry Weight after 24 hours = 5214 gm
Water Absorption Capacity
= [(5792-5214)/5214]X 100
=11.08 %
15](https://image.slidesharecdn.com/concretemixdesign-200927075640/85/Concrete-Mix-design-15-320.jpg)