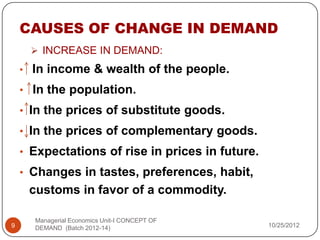
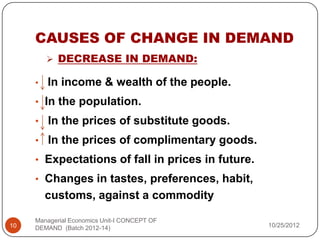
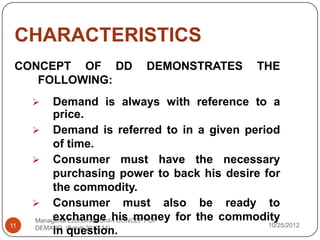
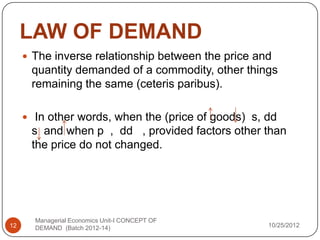
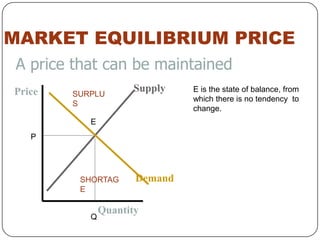
1. CONCEPT OF DEMAND
By
SHRUTI SATIJA
Managerial Economics Unit-I CONCEPT OF
1 DEMAND (Batch 2012-14) 10/25/2012
2. DEMAND
Desire backed by ‘willingness’ and ‘ability’ to pay
for a commodity.
It implies:
Desire to acquire it
Willingness to pay for it
Ability to pay for it.
Managerial Economics Unit-I CONCEPT OF
2 DEMAND (Batch 2012-14) 10/25/2012
3. Demand by Market Segment and
Total Market.
Geographical spread
Product uses
Distribution channel
Customer size
Product variety
Managerial Economics Unit-I CONCEPT OF
3 DEMAND (Batch 2012-14) 10/25/2012
4. TYPES OF DEMAND
1. Consumer goods and Producer goods
Consumer goods- Goods & services used for final
consumption.
Producer goods- Goods used for production of other
goods.
2. Perishable and Durable goods.
3. Autonomous and Derived demand
Autonomous- Goods whose demand is not tied up with
the demand for some other goods.
4. Individual’s demand & Market demand
Mkt dd is the summation of dd for a good by all individual.
Price of X and dd by buyer1,2,3 and all buyers market dd.
Managerial Economics Unit-I CONCEPT OF
4 DEMAND (Batch 2012-14) 10/25/2012
5. 5. Firm & Industry demand
All firms producing a particular good.
Eg.- DD for Hyundai car and all types of car.
6. Demand by market segment and total market.
Geographical spread
Product uses
Distribution channel
Customer size
Product variety
Managerial Economics Unit-I CONCEPT OF
5 DEMAND (Batch 2012-14) 10/25/2012
6. DEMAND FUNCTION
The DD function is an algebraic expression of the relation
between the demand for a commodity and its various
determinants.
Dx = f(PX , PS, PC, Y, T,E,U )
Dx = Demand for X item
PX = Price of X item
PS = Price of substitute goods
PC = Price of complimentary goods
Y= Income of consumer
T= Taste or preference of consumer
E= Price expectation of the user
U= All other factors
Managerial Economics Unit-I CONCEPT OF
6 DEMAND (Batch 2012-14) 10/25/2012
7. DETERMINANTS OF DEMAND
Price of the commodity
Price of the related commodities
Substitute goods.
Complimentary goods.
Income of the consumer d y
Normal goods.
Necessites.
Inferior goods.
Tastes & preferences of consumer.
Expectations about future price.
Managerial Economics Unit-I CONCEPT OF
7 DEMAND (Batch 2012-14) 10/25/2012
8. DETERMINANTS OF DEMAND
Size and regional distribution of population.
Composition of population.
Distribution of income.
Managerial Economics Unit-I CONCEPT OF
8 DEMAND (Batch 2012-14) 10/25/2012
9. CAUSES OF CHANGE IN DEMAND
INCREASE IN DEMAND:
• In income & wealth of the people.
• In the population.
• In the prices of substitute goods.
• In the prices of complementary goods.
• Expectations of rise in prices in future.
• Changes in tastes, preferences, habit,
customs in favor of a commodity.
Managerial Economics Unit-I CONCEPT OF
9 DEMAND (Batch 2012-14) 10/25/2012
10. CAUSES OF CHANGE IN DEMAND
DECREASE IN DEMAND:
• In income & wealth of the people.
• In the population.
• In the prices of substitute goods.
• In the prices of complimentary goods.
• Expectations of fall in prices in future.
• Changes in tastes, preferences, habit,
customs, against a commodity
Managerial Economics Unit-I CONCEPT OF
10 DEMAND (Batch 2012-14) 10/25/2012
11. CHARACTERISTICS
CONCEPT OF DD DEMONSTRATES THE
FOLLOWING:
Demand is always with reference to a
price.
Demand is referred to in a given period
of time.
Consumer must have the necessary
purchasing power to back his desire for
the commodity.
Consumer must also be ready to
exchange his money for the commodity
Managerial Economics Unit-I CONCEPT OF
11 DEMAND (Batch 2012-14) 10/25/2012
in question.
12. LAW OF DEMAND
The inverse relationship between the price and
quantity demanded of a commodity, other things
remaining the same (ceteris paribus).
In other words, when the (price of goods) s, dd
s and when p , dd , provided factors other than
the price do not changed.
Managerial Economics Unit-I CONCEPT OF
12 DEMAND (Batch 2012-14) 10/25/2012
13. Downward sloping in DD
curve
Managerial Economics Unit-I CONCEPT OF
13 DEMAND (Batch 2012-14) 10/25/2012
14. Reason for downward sloping
Curve
1. Law of diminishing marginal utility.
As a consumer keeps on consuming successive units of the
same commodity, consumption of other commodities
remaining constant, MU diminishes.
2. Income effect.
3. Substitution effect.
4. Changes in the number of consumers.
5. Diverse uses of commodity.
Managerial Economics Unit-I CONCEPT OF
14 DEMAND (Batch 2012-14) 10/25/2012
15. EXCEPTIONS TO LAW OF
DEMAND
1. Prestige is directly associated with price of
goods.
2. Giffen paradox
3. Emergency
4. Expectations about future price
Managerial Economics Unit-I CONCEPT OF
15 DEMAND (Batch 2012-14) 10/25/2012
16. CHANGE IN DEMAND & CHANGE IN
QUANTITY DEMANDED
CHANGE IN DEMAND CHANGE IN QUANTITY
DEMANDED
Change in demand
essentially happens due to Change in quantity
a change in the factors demanded happens
affecting demand. essentially due to a change
in the price of that
commodity.
Change in demand causes
Change in quantity
a shift in the Demand
demanded causes a
Curve ,i.e., an increase in
movement along the
demand causes the
demand curve.
demand curve to shift
outwards whereas a
16 decrease causes an
Managerial Economics Unit-I CONCEPT OF
DEMAND (Batch 2012-14) 10/25/2012
inward shift.
17. MOVEMENT ALONG DD
CURVE
A movement along a demand curve occurs when
the ONLY factor that changes
.
Managerial Economics Unit-I CONCEPT OF
17 DEMAND (Batch 2012-14) 10/25/2012
18. It is just an arrow along the demand curve in the
correct direction. As price increases the
movement would be to the left, as price
decreases the movement would be to the right.
If the quantity decreases it is known as
contraction.
If the quantity increases it is known as expansion
Managerial Economics Unit-I CONCEPT OF
18 DEMAND (Batch 2012-14) 10/25/2012
19. SHIFT IN DD CURVE
Managerial Economics Unit-I CONCEPT OF
19 DEMAND (Batch 2012-14) 10/25/2012
20. In this diagram the shift from demand curve D1 to
demand curve D2 is represented by an actual
translation across the plane. This particular
diagram features an inward shift to the left, or a
shrink in demand. An outward shift would be an
increase in demand.
This shift is caused by any actual changes in the
determinants of demand.
Managerial Economics Unit-I CONCEPT OF
20 DEMAND (Batch 2012-14) 10/25/2012
21. CONCEPT OF SUPPLY
Managerial Economics Unit-I CONCEPT OF
21 DEMAND (Batch 2012-14) 10/25/2012
22. SUPPLY
It is the willingness and ability of producers to make
a specific quantity of output available to consumers
at a particular price over a given period of time.
Supply is the mirror image of demand.
Managerial Economics Unit-I CONCEPT OF
22 DEMAND (Batch 2012-14) 10/25/2012
23. LAW OF SUPPLY
There is positive relation between price and
quantity supplied other things remaining constant.
Variables other than price:
Money cost of production
Inter-related supply
Managerial Economics Unit-I CONCEPT OF
23 DEMAND (Batch 2012-14) 10/25/2012
24. TYPES OF SUPPLY CURVE
The supply curve is upward sloping.
There are TWO types of change in supply;
1. Movement ALONG the supply curve
2. SHIFTS in the supply curve
Managerial Economics Unit-I CONCEPT OF
24 DEMAND (Batch 2012-14) 10/25/2012
25. A movement ALONG the supply
curve
A movement along the supply curve is caused by a
change in PRICE of the good or service.
For instance, an increase in the price of the good
results in an EXTENSION of supply (quantity
supplied will increase), whilst a decrease in price
causes a CONTRACTION of supply (quantity
supplied will decrease).
Managerial Economics Unit-I CONCEPT OF
25 DEMAND (Batch 2012-14) 10/25/2012
26. A SHIFT in the supply curve
A shift in the supply
curve is caused by a
change in any non-
price determinant of
supply. The curve can
shift to the right or left.
A rightward shift
represents an increase
in the quantity supplied
(at all prices) S1 to S2,
whilst a leftward shift
represents a decrease
in the quantity supplied
Managerial Economics Unit-I CONCEPT OF
26 DEMAND (Batch 2012-14) (at all prices). S1 to S3.
10/25/2012
27. THINGS TO REMEMBER
The supply curve follows the law f supply when price
and quantity supplied increases and vice versa.
The horizontal axis-quantity-has time dimension.
The quantities are of the same quality.
The vertical axis-price-is a relative price.
The curve assumes everything else is constant.
Effects of price is shown by movement and shift in
supply curve.
Managerial Economics Unit-I CONCEPT OF
27 DEMAND (Batch 2012-14) 10/25/2012
28. MARKET EQUILIBRIUM PRICE
A price that can be maintained
Price SURPLU
Supply E is the state of balance, from
which there is no tendency to
S
change.
E
P
SHORTAG Demand
E
Quantity
Q
29. THANK YOU
Managerial Economics Unit-I CONCEPT OF
29 DEMAND (Batch 2012-14) 10/25/2012