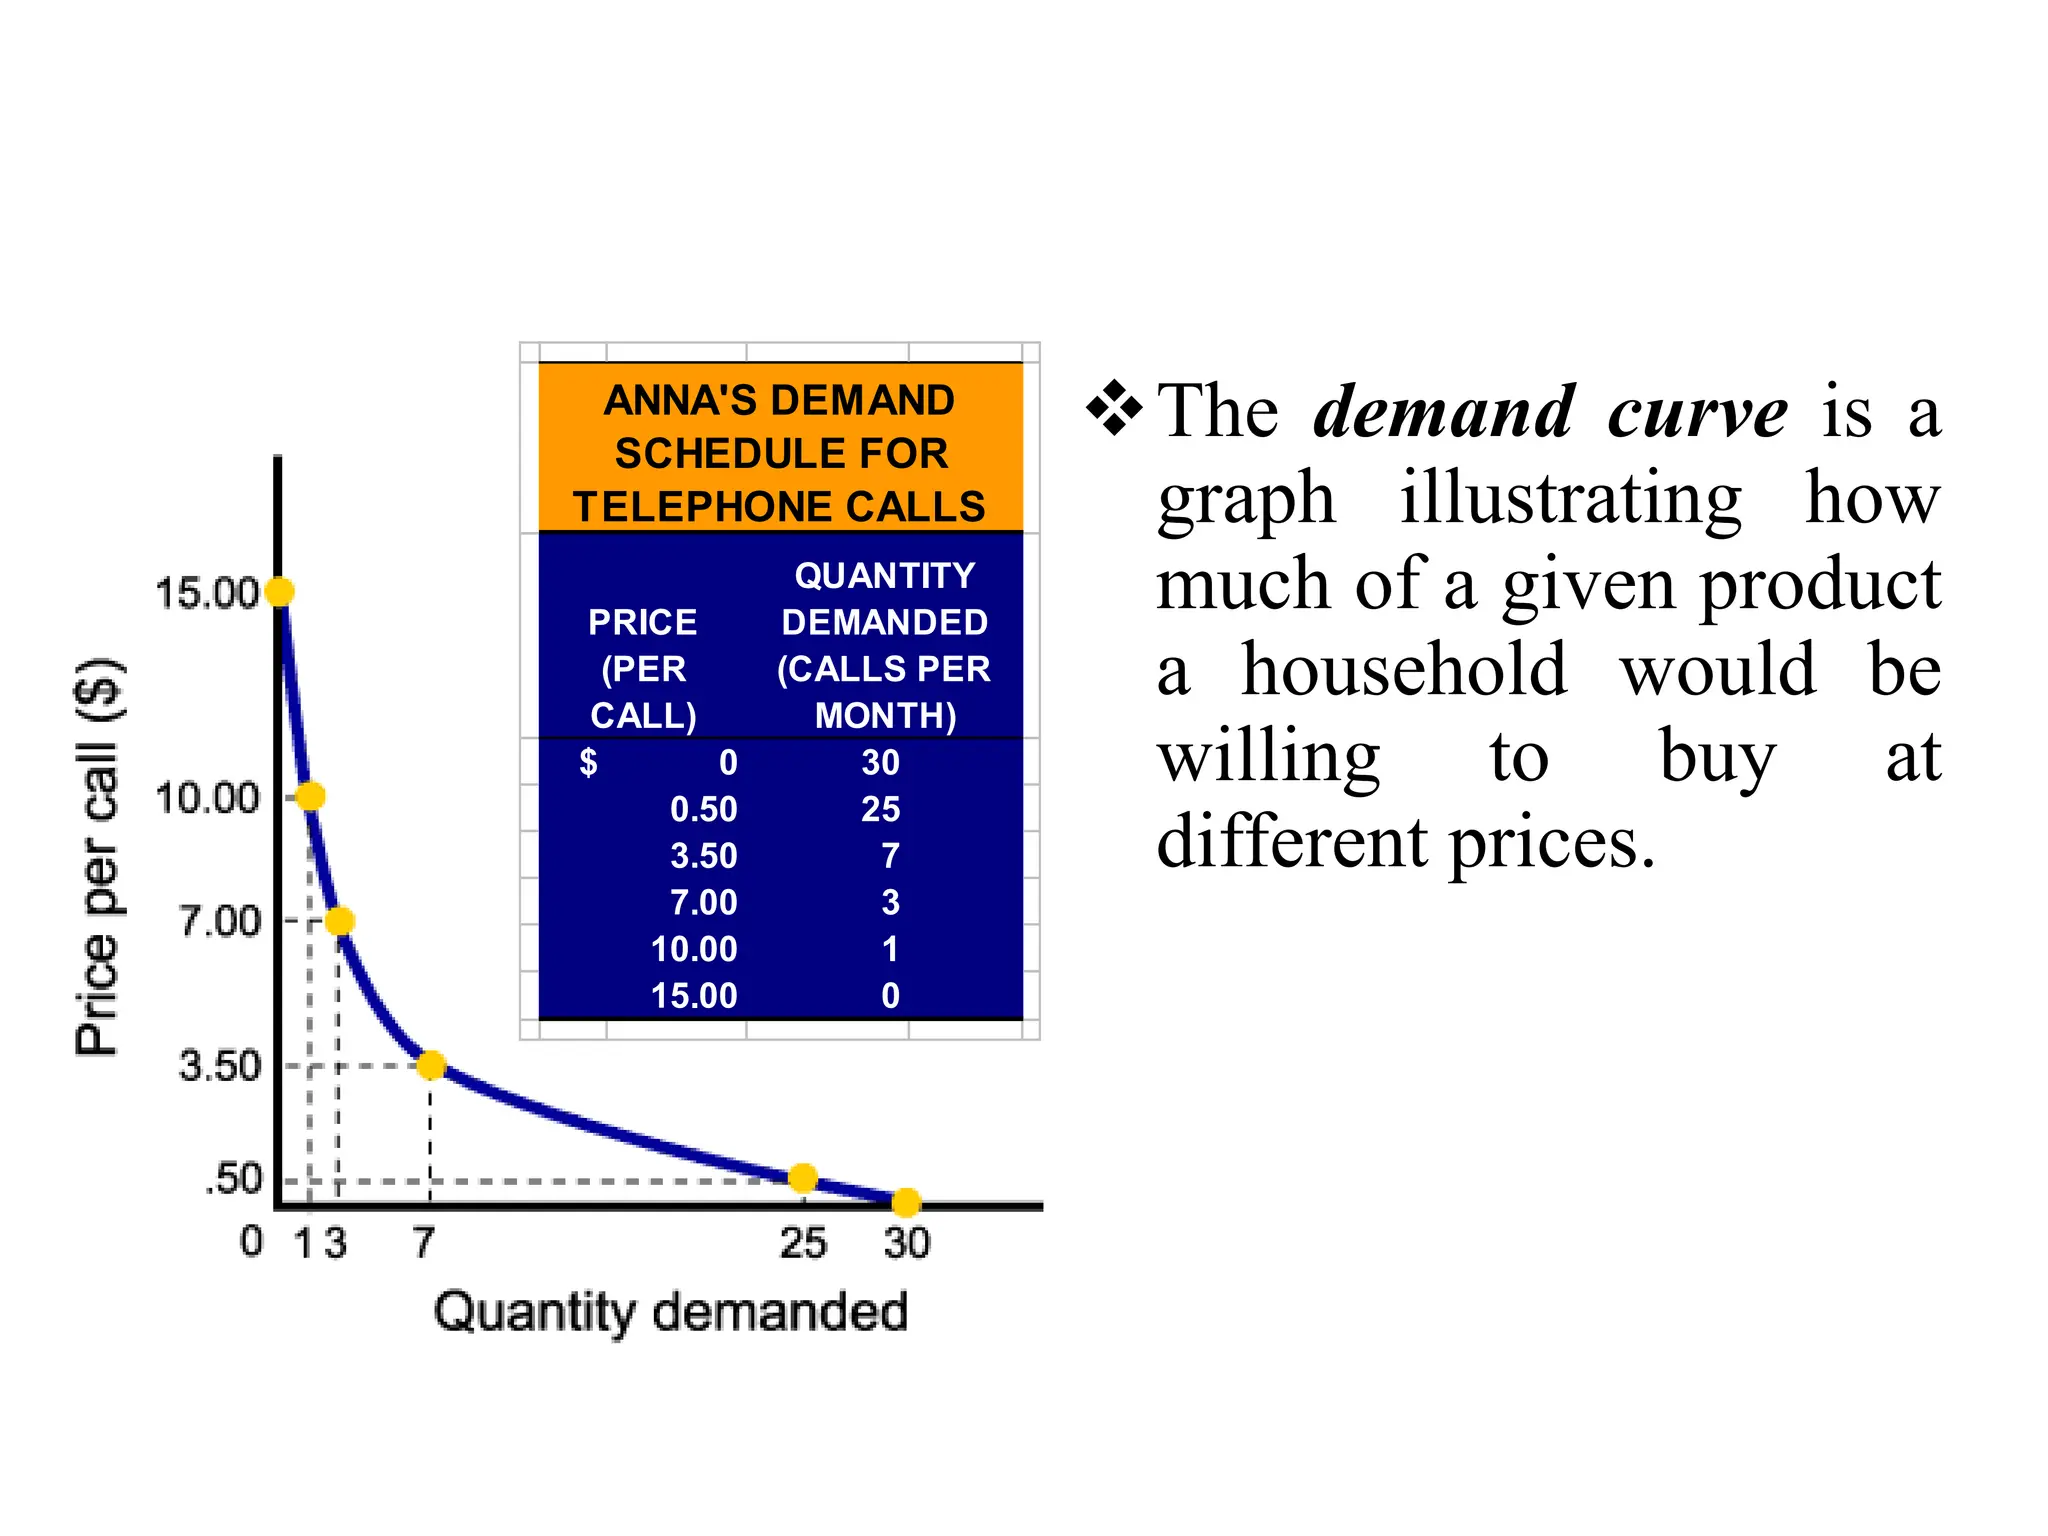
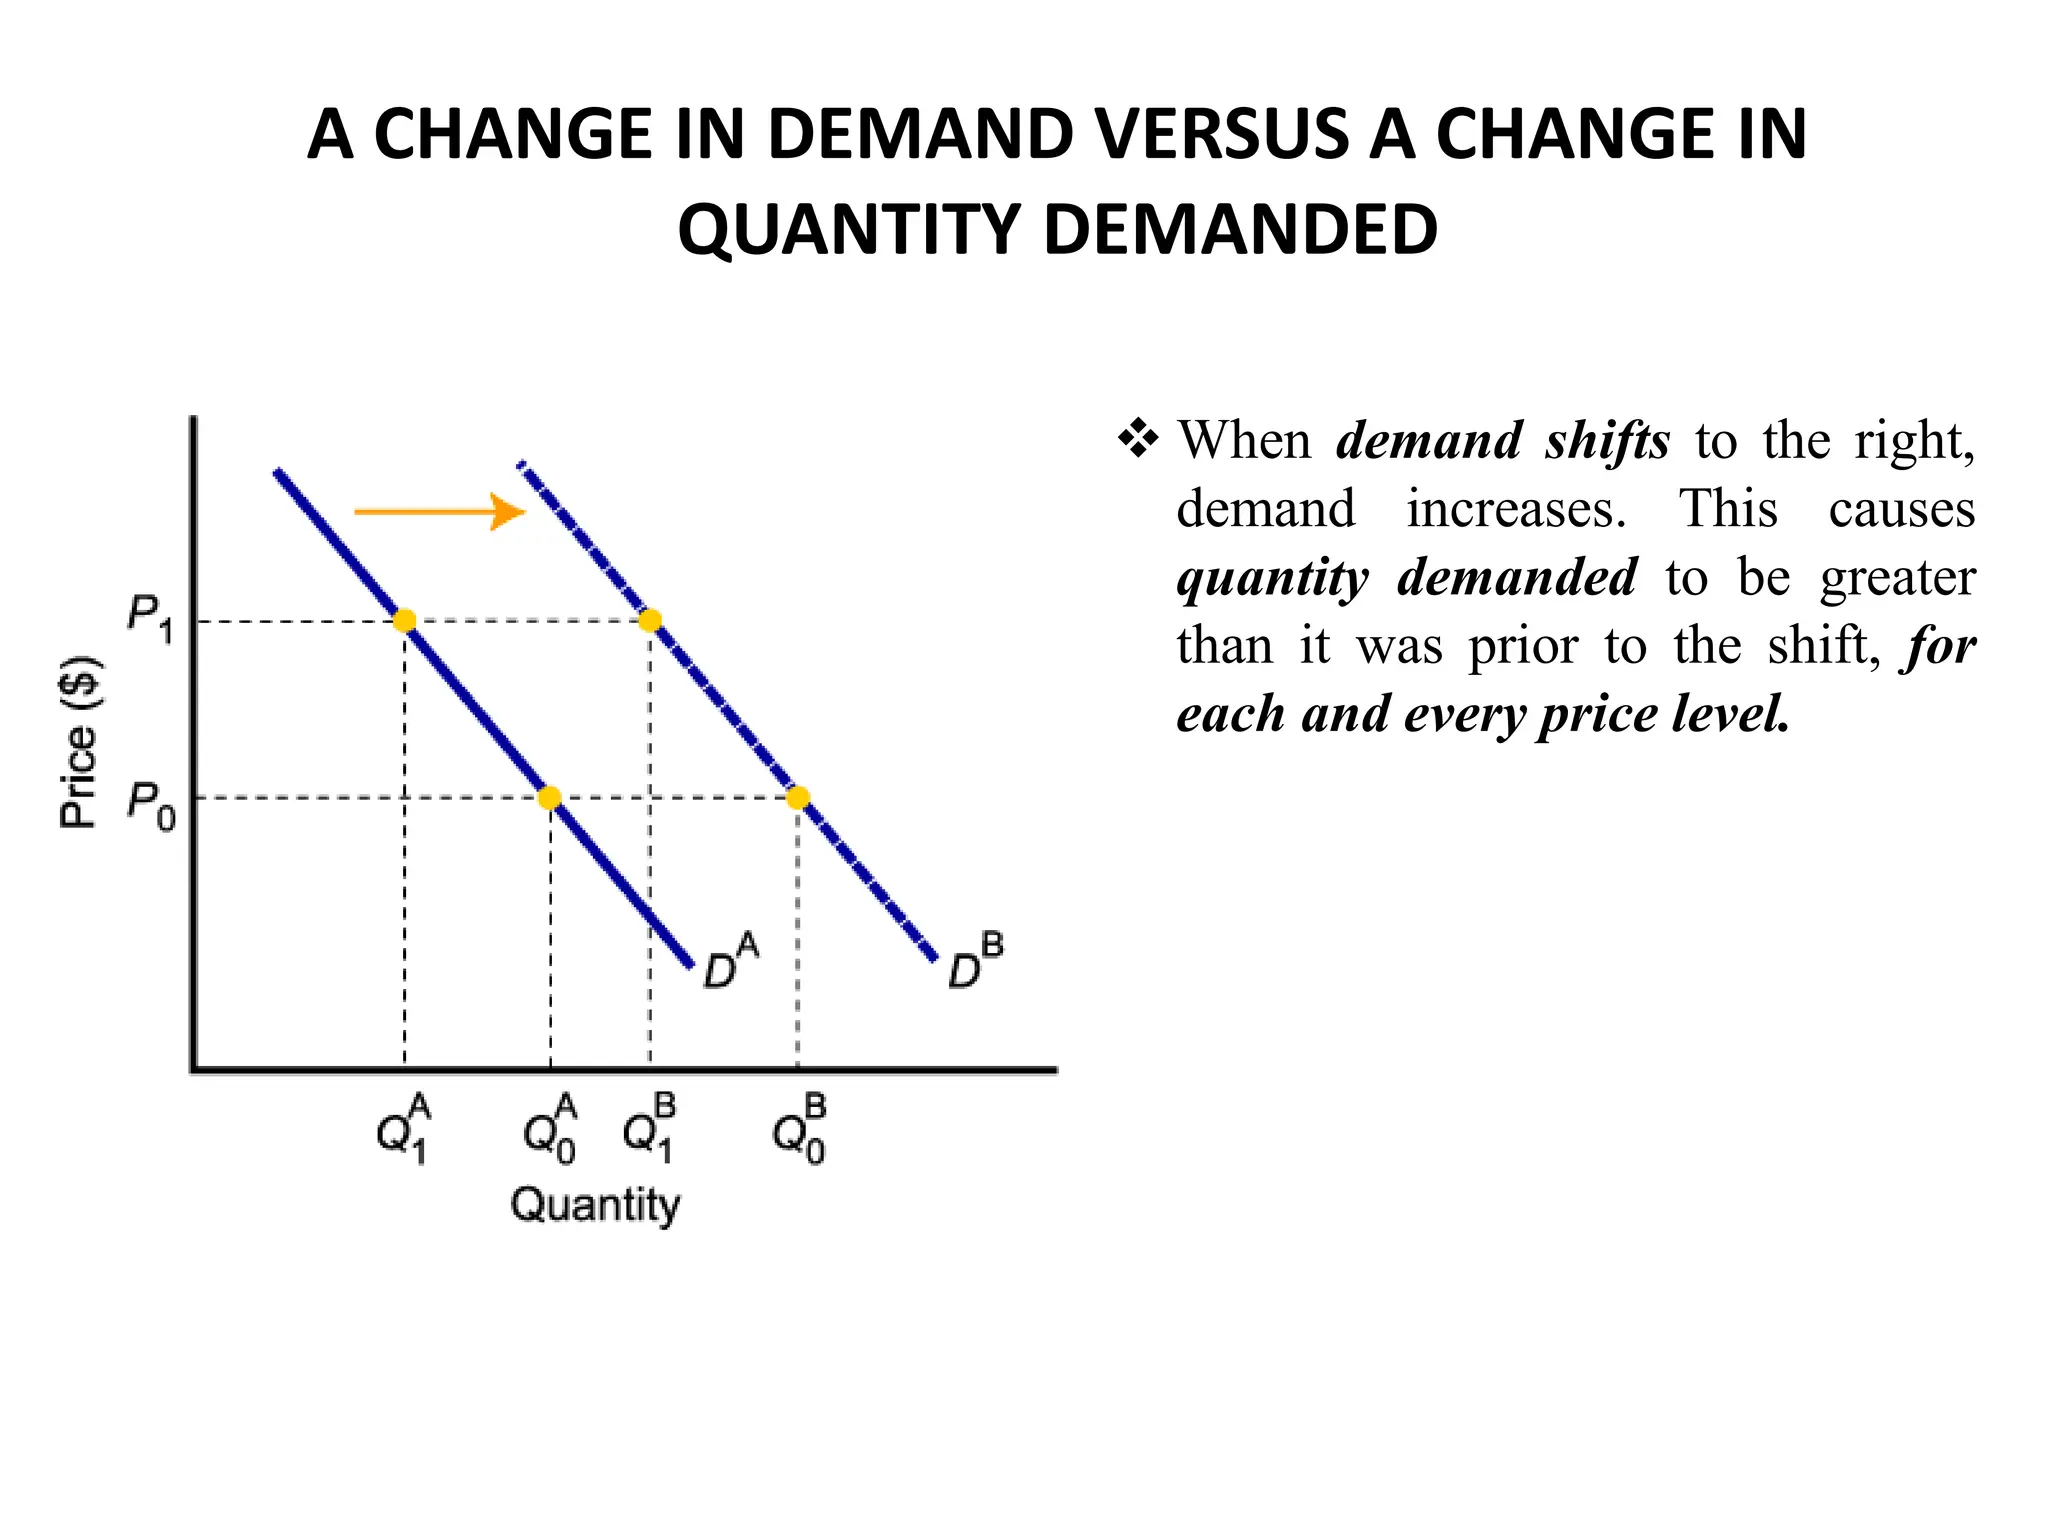
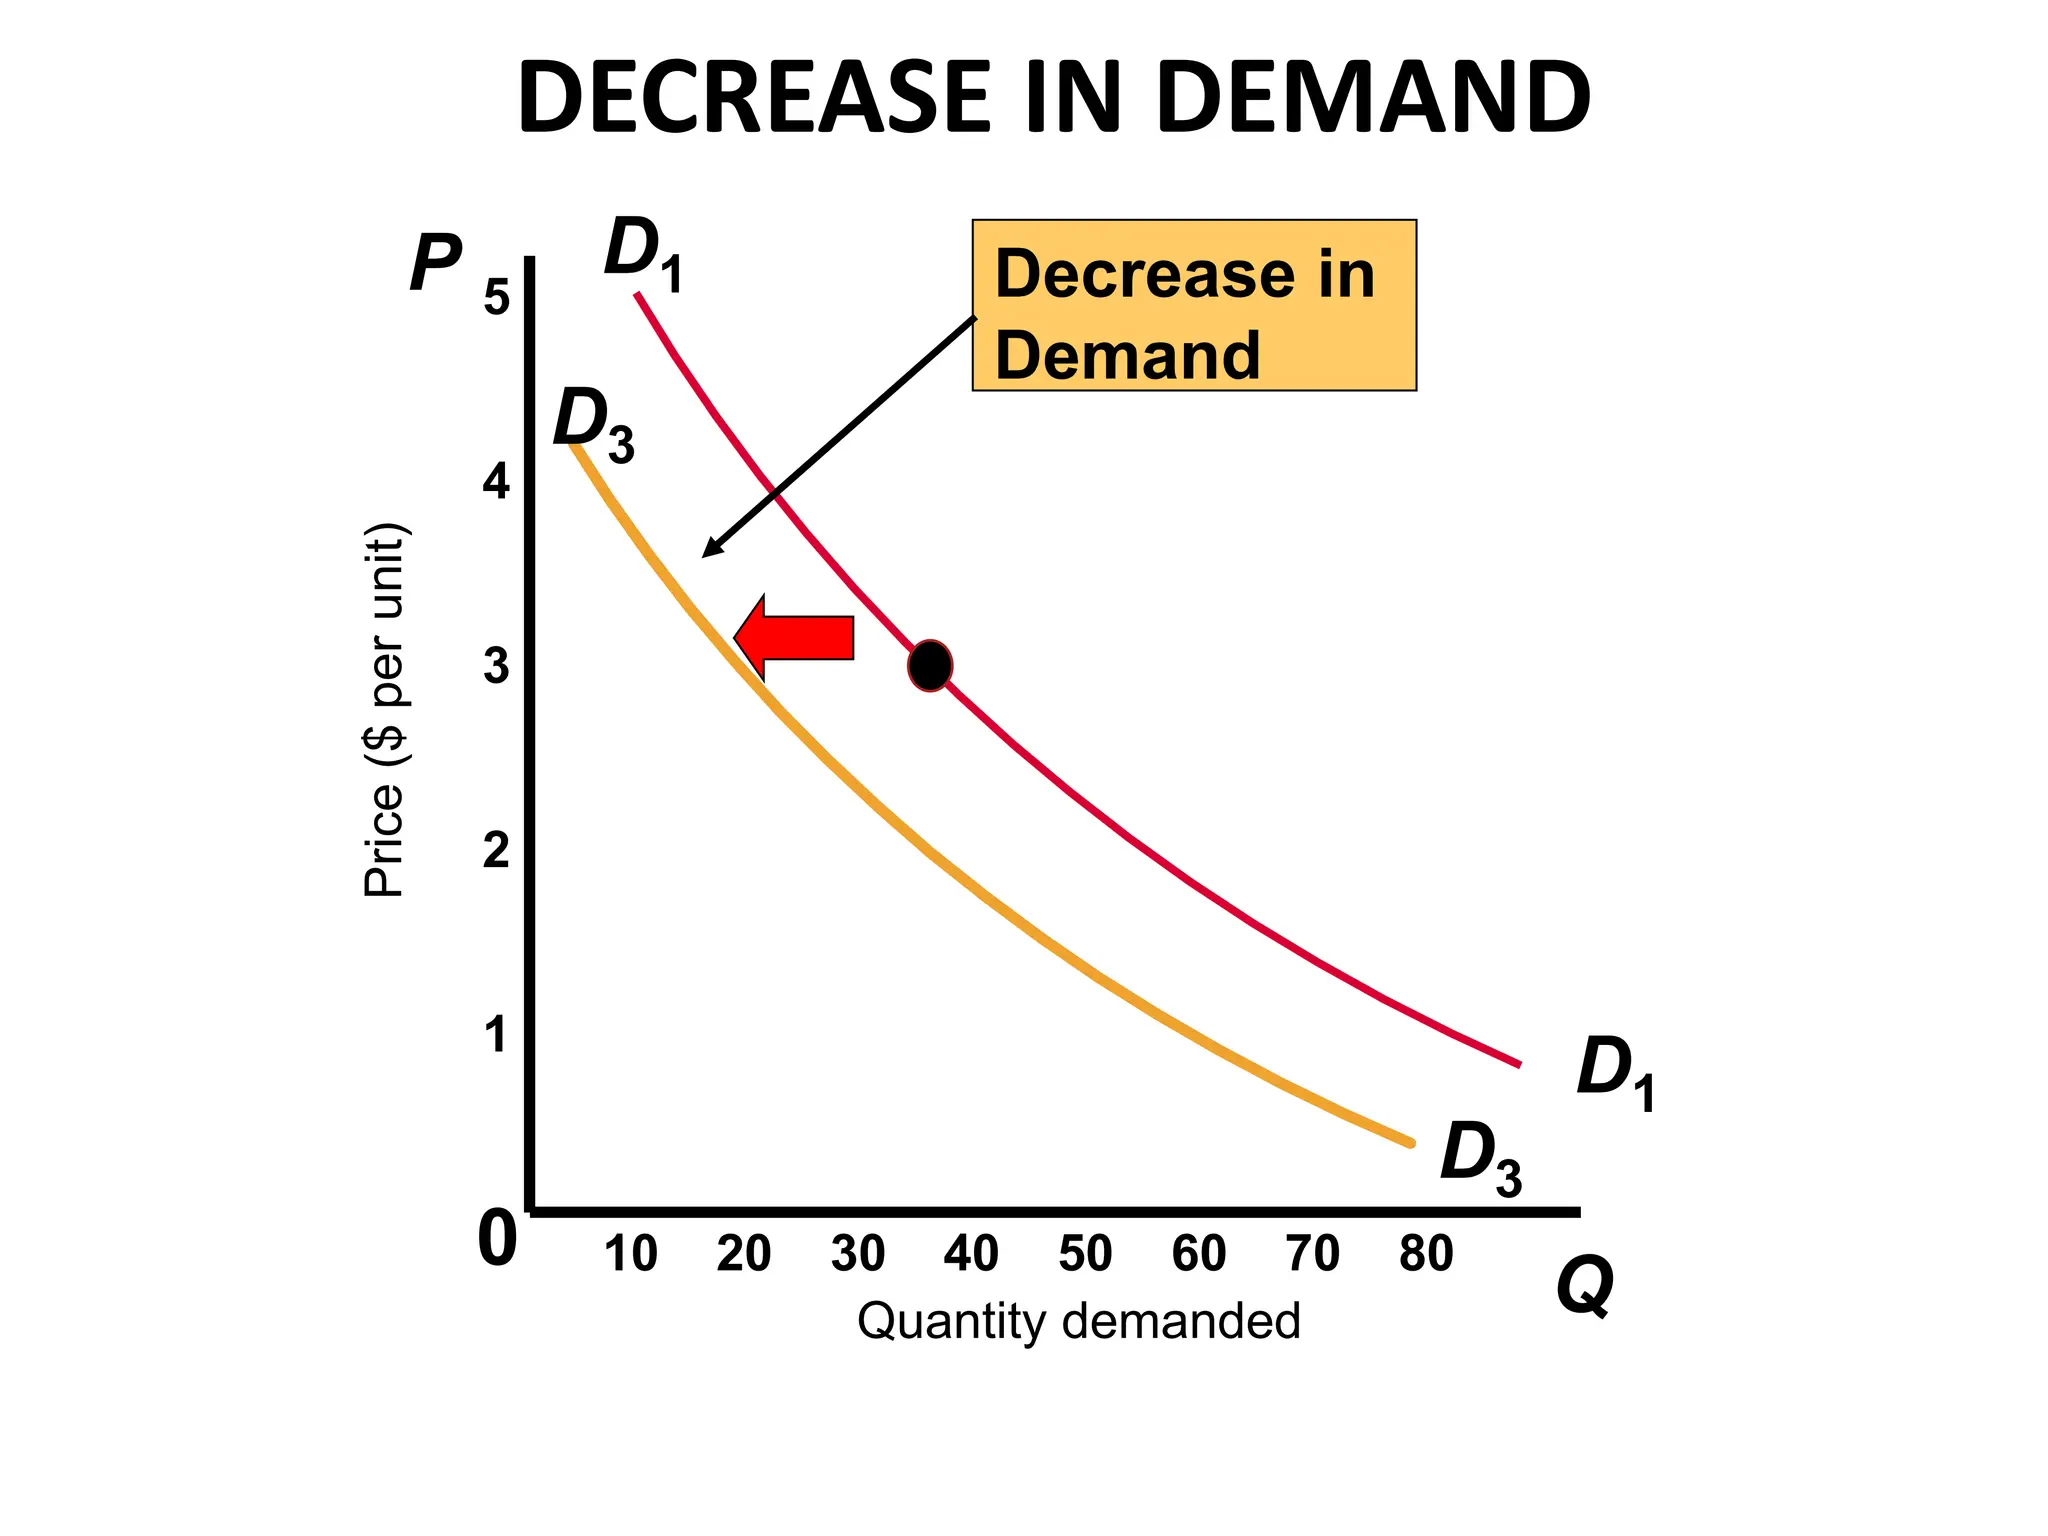
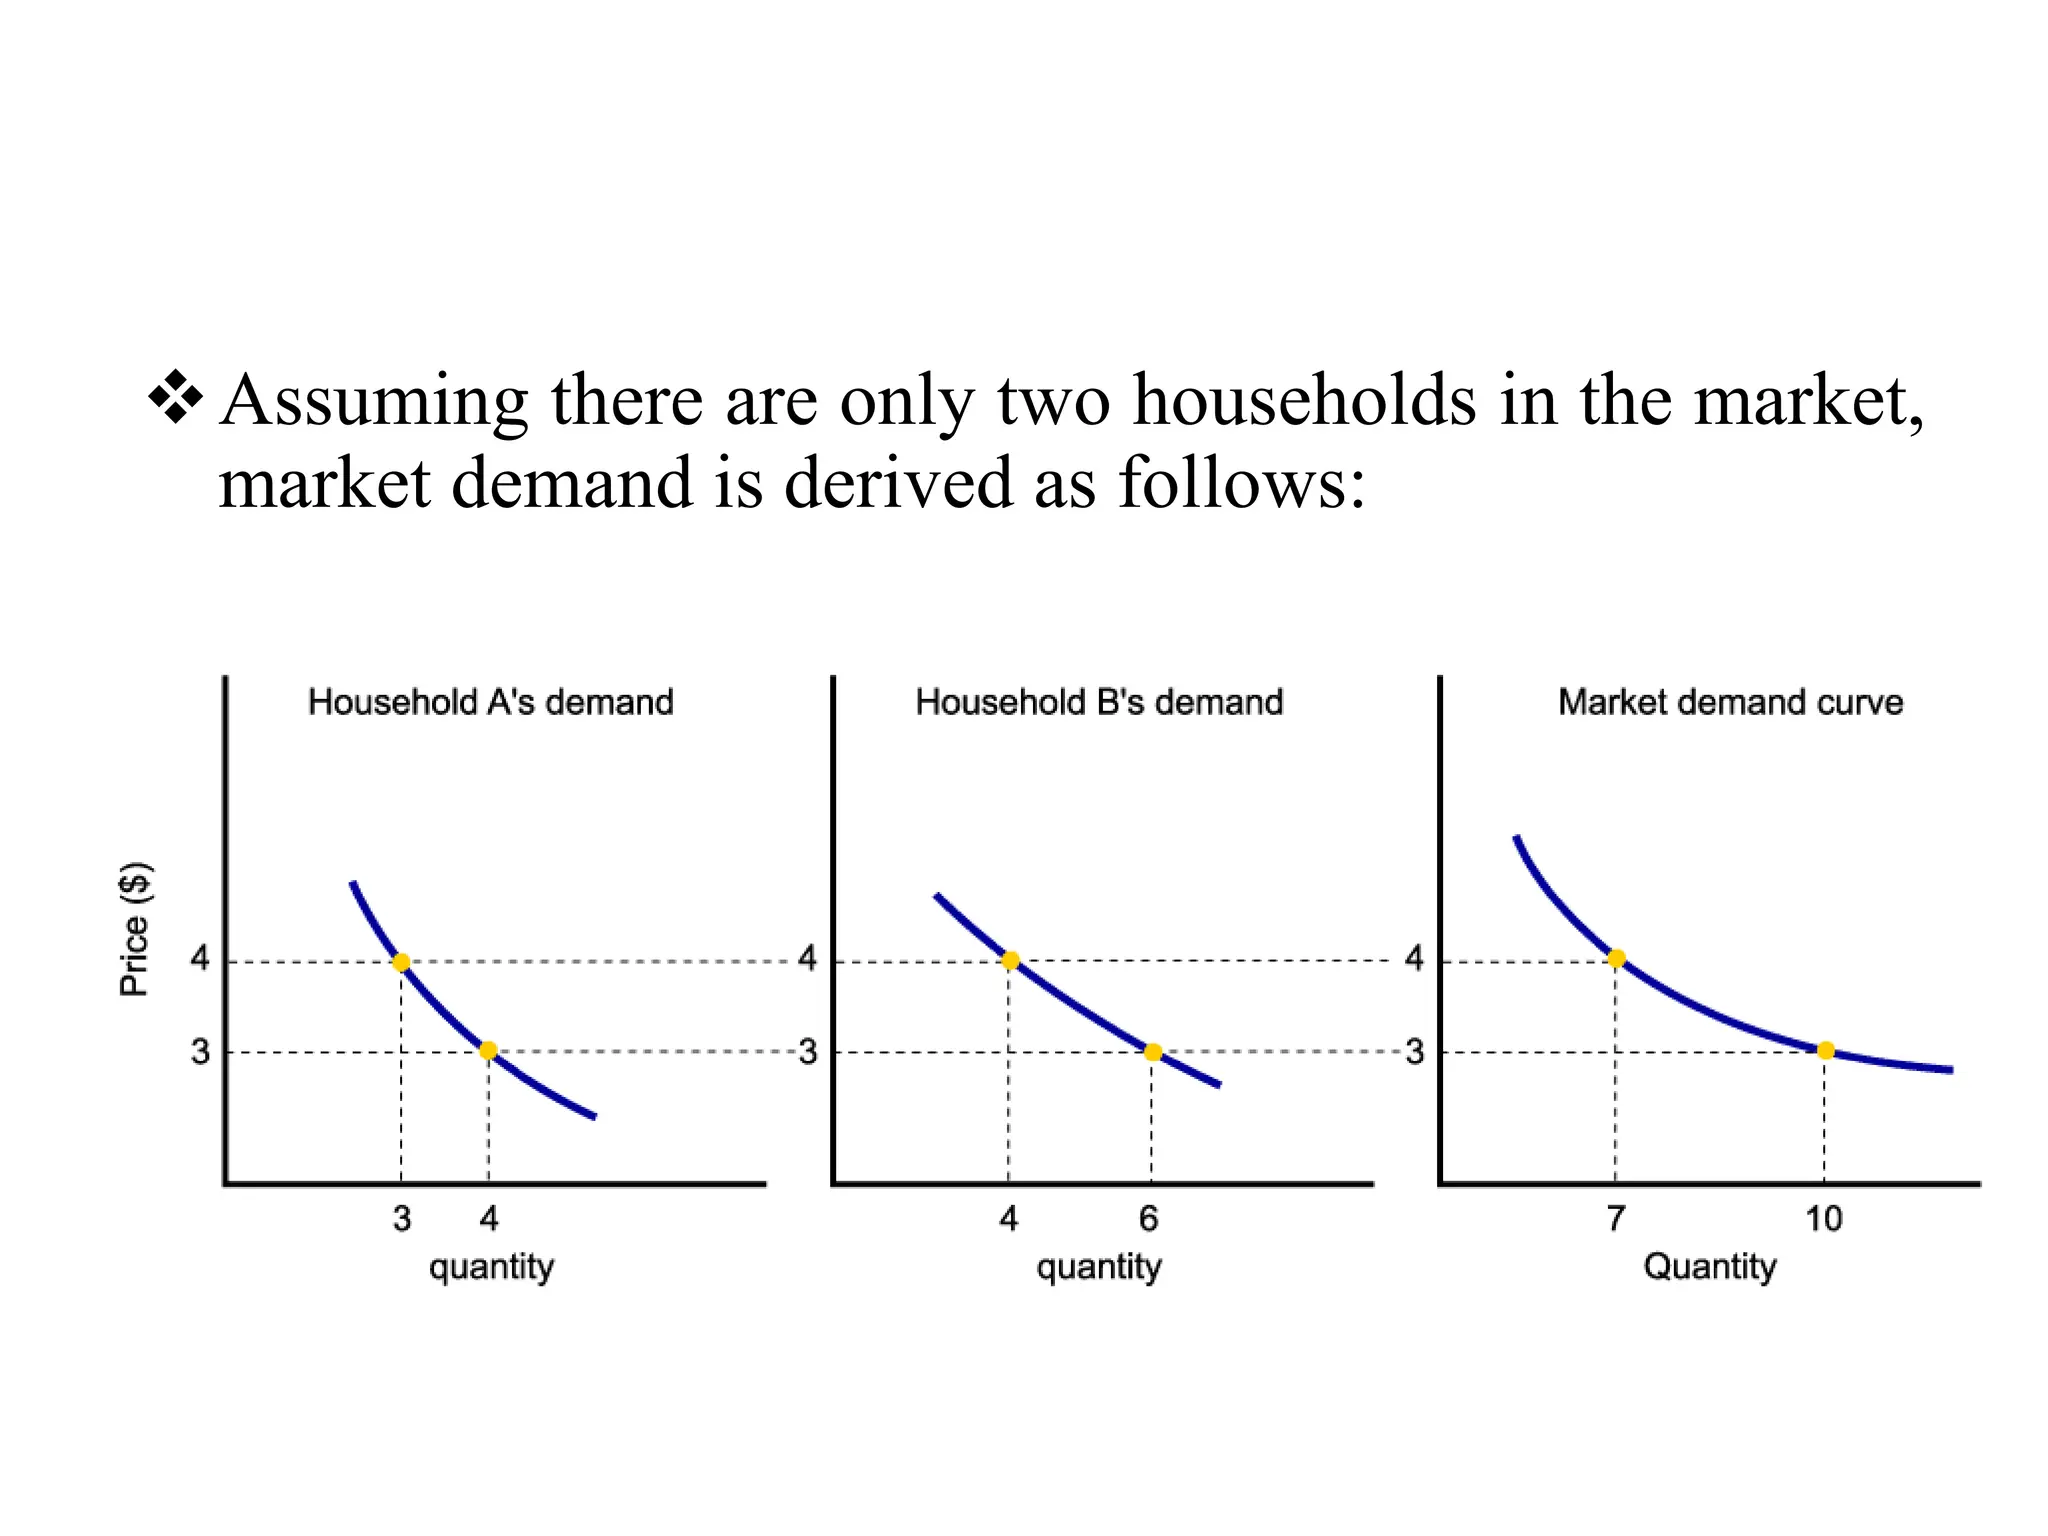
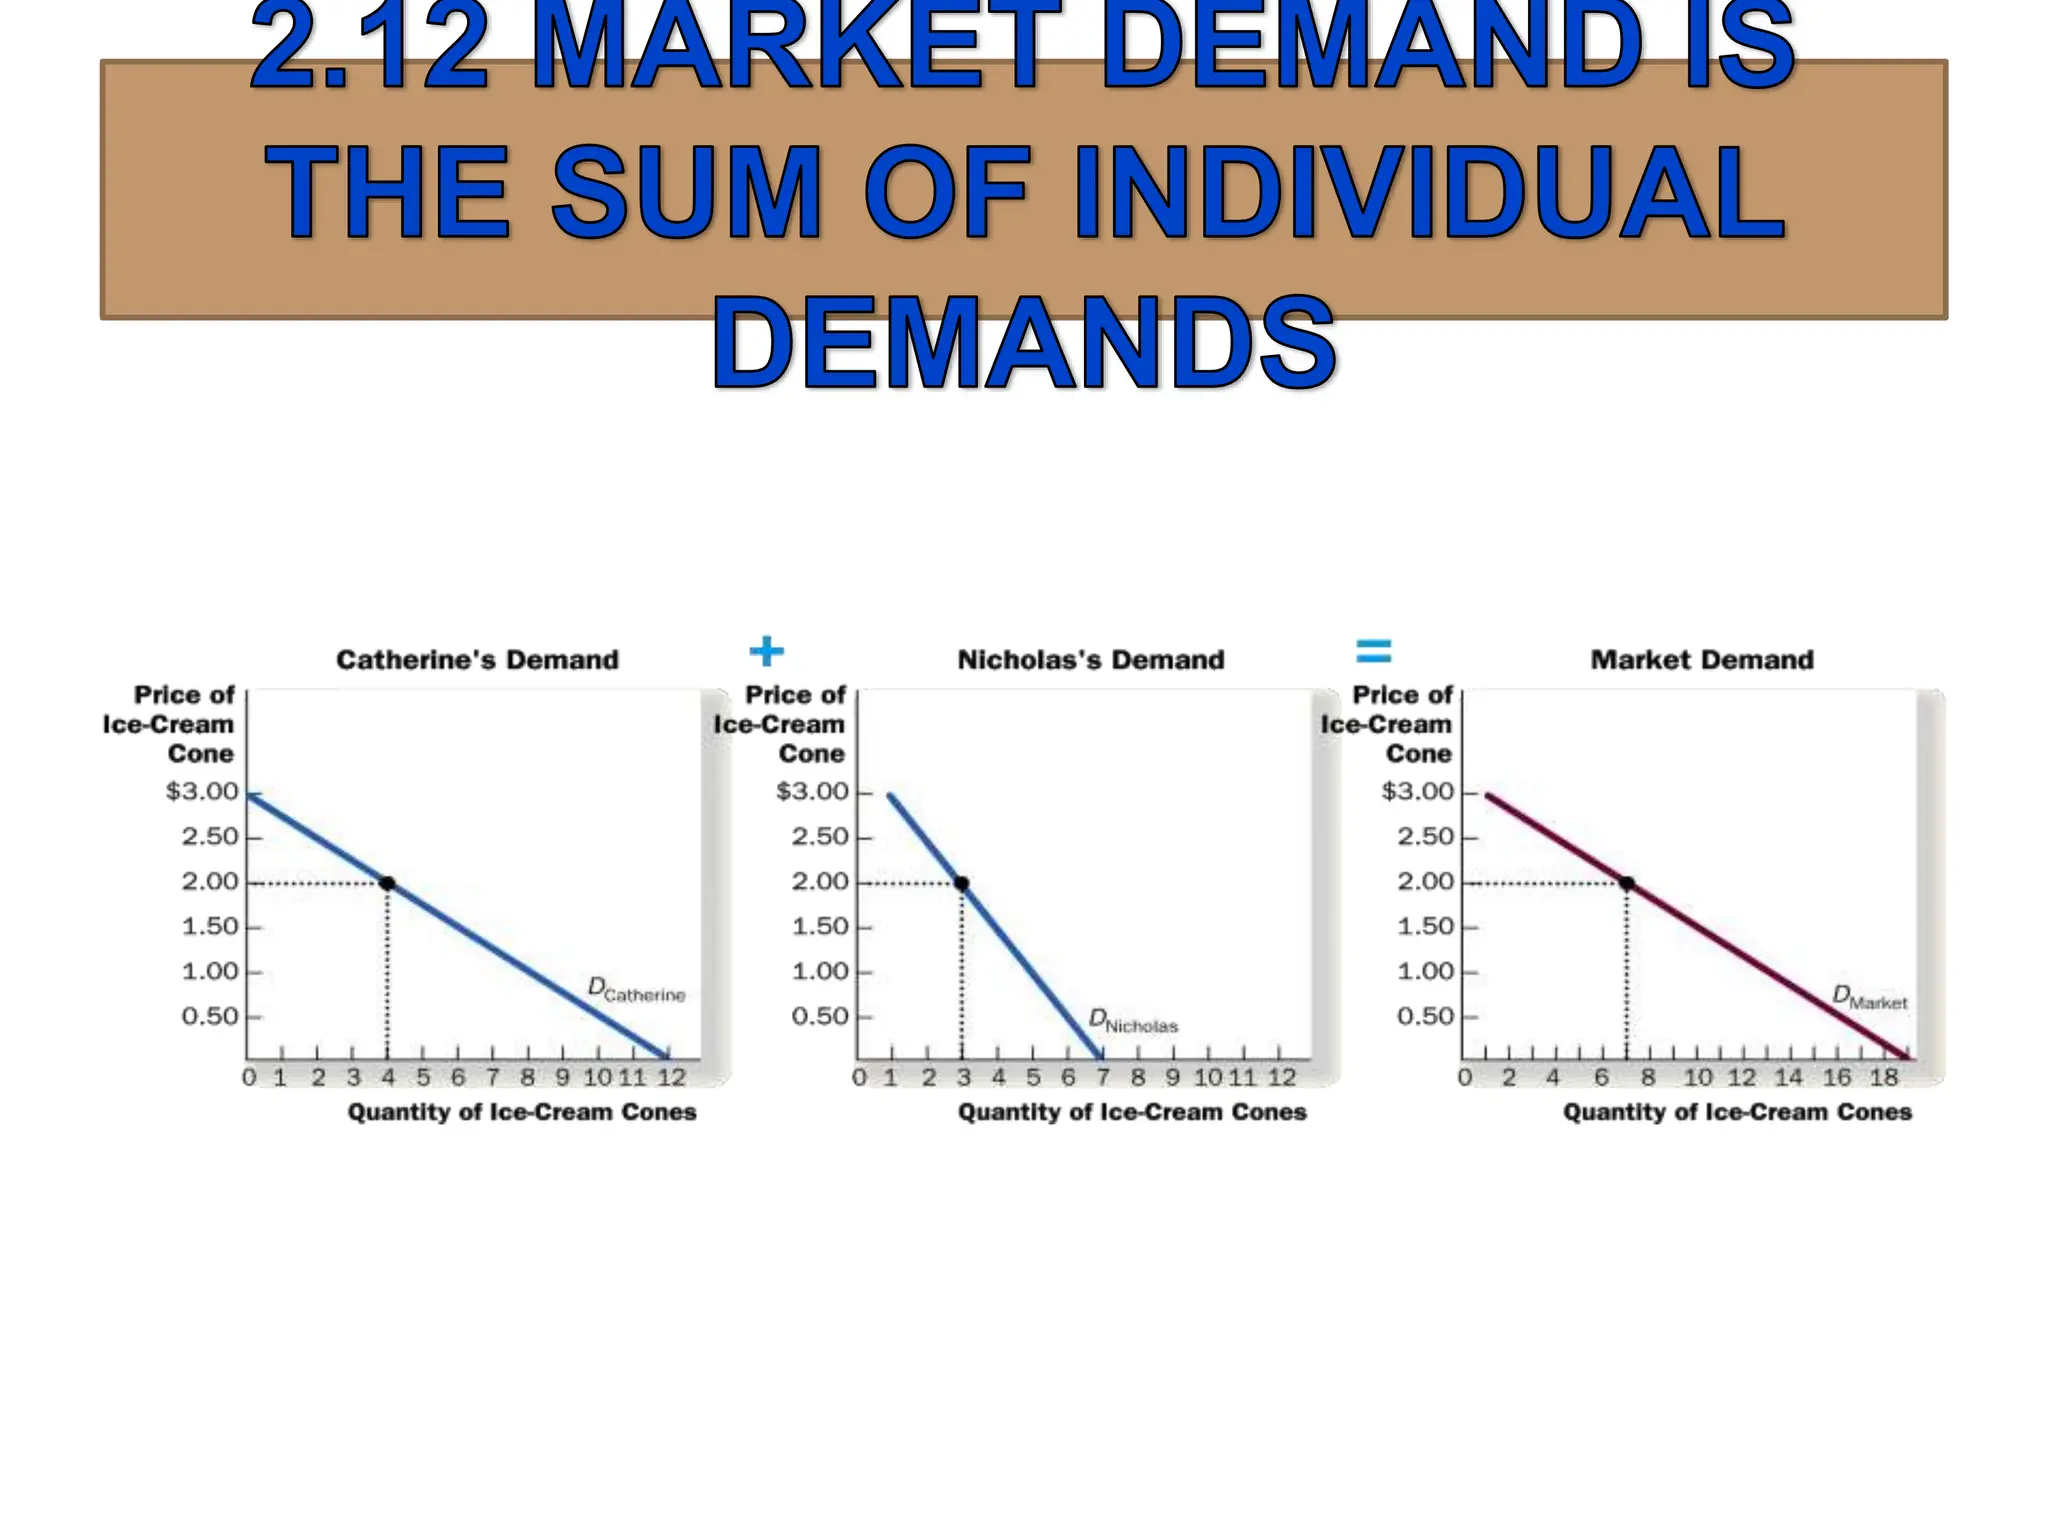
MICROECONOMICS
CHAPTER 2:
DEMAND THEORY
MUHAMMAD NAZMI NAWI
At the end of the lesson, students should be able to:
– Understand the concept of demand
– Explain the circular flow of economic activity
– Describe factors that affect demand and the
demand curve.
– Explain the shift of demand versus movement
along the a demand curve
A firm is an organization that transforms
resources (inputs) into products (outputs). Firms
are the primary producing units in a market
economy.
An entrepreneur is a person who organizes,
manages, and assumes the risks of a firm, taking
a new idea or a new product and turning it into a
successful business.
Households are the consuming units in an
economy.
A market is any institutional structure, or mechanism,
that brings together buyers and sellers of particular
goods and services
They determine the price and quantity of a good or
service transacted
The circular flow of
economic activity shows
the connections between
firms and households in
input and output markets.
Output, or product, markets
are the markets in which
goods and services are
exchanged.
Input markets are the
markets in which
resources—labor, capital,
and land—used to produce
products, are exchanged.
• Payments flow in the opposite
direction as the physical flow of
resources, goods, and services
(counterclockwise).
Input markets include:
The labor market, in which households supply work
for wages to firms that demand labor.
The capital market, in which households supply their
savings, for interest or for claims to future profits, to
firms that demand funds to buy capital goods.
The land market, in which households supply land or
other real property in exchange for rent.
The various amounts
of a product that
consumers are willing
and able to purchase at
various prices during
some specific period
Demand is the amount of a product that people
are willing and able to purchase at each possible
price during a given period of time.
The quantity demand is the amount of a
product that people are willing and able to
purchase at one, specific price.
Change in the price of product affect the quantity
demanded per period.
Changes in any other factor, such as income or
preferences, affect demand.
– Eg: Increase in price of Coca-Cola is likely to cause a
decrease in quantity demanded. However, if there is
increase in income is likely to cause an increase in the
demand for most goods.
The price of the production question.
The income available to the household.
The household’s amount of accumulated
wealth.
The prices of related products available to the
household.
The household’s tastes and preferences.
The household’s expectations about future
income, wealth, and prices.
Diminishing Marginal Utility
A household’s decision about the quantity of a particular output to demand
depends on:
Normal Goods are goods for which demand
goes up when income is higher and for which
demand goes down when income is lower.
Inferior Goods are goods for which demand
falls when income rises.
Substitutes are goods that can serve as
replacements for one another; when the price of
one increases, demand for the other goes up.
Perfect substitutes are identical products.
Complements are goods that “go together”; a
decrease in the price of one results in an
increase in demand for the other, and vice
versa.
• Higher income decreases the demand
for an inferior good
• Higher income increases the
demand for a normal good
• Price of hamburger rises
• Demand for complement good
(ketchup) shifts left
• Demand for substitute good (chicken)
shifts right
• Quantity of hamburger
demanded falls
The inverse relationship between the price and the
quantity demanded of a good or service during some
period of time
A demand schedule is a
table showing how
much of a given product
a household would be
willing to buy at
different prices.
Demand curves are
usually derived from
demand schedules.
PRICE
(PER
CALL)
QUANTITY
DEMANDED
(CALLS PER
MONTH)
$ 0 30
0.50 25
3.50 7
7.00 3
10.00 1
15.00 0
ANNA'S DEMAND
SCHEDULE FOR
TELEPHONE CALLS
The demand curve is a
graph illustrating how
much of a given product
a household would be
willing to buy at
different prices.
PRICE
(PER
CALL)
QUANTITY
DEMANDED
(CALLS PER
MONTH)
$ 0 30
0.50 25
3.50 7
7.00 3
10.00 1
15.00 0
ANNA'S DEMAND
SCHEDULE FOR
TELEPHONE CALLS
The law of demand
states that there is a
negative, or inverse,
relationship between
price and the quantity of
a good demanded and its
price.
This means that demand
curves slope downward.
SHIFT OF DEMAND VERSUS MOVEMENT ALONG A
DEMAND CURVE
• A change in demand is not the
same as a change in quantity
demanded.
• In this example, a higher price
causes lower quantity demanded.
• Changes in determinants of
demand, other than price, cause a
change in demand, or a shift of the
entire demand curve, from DA to
DB.
 When demand shifts to the right,
demand increases. This causes
quantity demanded to be greater
than it was prior to the shift, for
each and every price level.
A CHANGE IN DEMAND VERSUS A CHANGE IN
QUANTITY DEMANDED
A CHANGE IN DEMAND VERSUS A CHANGE IN
QUANTITY DEMANDED
To summarize:
Change in price of a good or service
leads to
Change in quantity demanded
(Movement along the curve).
Change in income, preferences, or
prices of other goods or services
leads to
Change in demand
(Shift of curve).
INCREASE IN DEMAND
P
Q
0
5
4
3
2
1
10 20 30 40 50 60 70 80
D1
Quantity demanded
D1
Increase in
Demand
D2
D2
Price
($
per
unit)
D1
D1 Decrease in
Demand
DECREASE IN DEMAND
P
Q
0
5
4
3
2
1
10 20 30 40 50 60 70 80
Quantity demanded
D3
D3
Price
($
per
unit)
SHIFTS IN THE DEMAND CURVE
Price of
Ice-Cream
Cone
Quantity of
Ice-Cream Cones
Increase
in demand
Decrease
in demand
Demand curve, D3
Demand
curve, D1
Demand
curve, D2
0
26
Demand for a good or service can be defined for
an individual household, or for a group of
households that make up a market.
Market demand is the sum of all the quantities of
a good or service demanded per period by all the
households buying in the market for that good or
service.
Assuming there are only two households in the market,
market demand is derived as follows:
Microeconomics - Demand Theory for International.pptx

Microeconomics - Demand Theory for International.pptx

  • 1.
  • 2.
    At the endof the lesson, students should be able to: – Understand the concept of demand – Explain the circular flow of economic activity – Describe factors that affect demand and the demand curve. – Explain the shift of demand versus movement along the a demand curve
  • 3.
    A firm isan organization that transforms resources (inputs) into products (outputs). Firms are the primary producing units in a market economy. An entrepreneur is a person who organizes, manages, and assumes the risks of a firm, taking a new idea or a new product and turning it into a successful business. Households are the consuming units in an economy.
  • 4.
    A market isany institutional structure, or mechanism, that brings together buyers and sellers of particular goods and services They determine the price and quantity of a good or service transacted
  • 5.
    The circular flowof economic activity shows the connections between firms and households in input and output markets.
  • 7.
    Output, or product,markets are the markets in which goods and services are exchanged. Input markets are the markets in which resources—labor, capital, and land—used to produce products, are exchanged. • Payments flow in the opposite direction as the physical flow of resources, goods, and services (counterclockwise).
  • 8.
    Input markets include: Thelabor market, in which households supply work for wages to firms that demand labor. The capital market, in which households supply their savings, for interest or for claims to future profits, to firms that demand funds to buy capital goods. The land market, in which households supply land or other real property in exchange for rent.
  • 9.
    The various amounts ofa product that consumers are willing and able to purchase at various prices during some specific period
  • 10.
    Demand is theamount of a product that people are willing and able to purchase at each possible price during a given period of time. The quantity demand is the amount of a product that people are willing and able to purchase at one, specific price.
  • 11.
    Change in theprice of product affect the quantity demanded per period. Changes in any other factor, such as income or preferences, affect demand. – Eg: Increase in price of Coca-Cola is likely to cause a decrease in quantity demanded. However, if there is increase in income is likely to cause an increase in the demand for most goods.
  • 12.
    The price ofthe production question. The income available to the household. The household’s amount of accumulated wealth. The prices of related products available to the household. The household’s tastes and preferences. The household’s expectations about future income, wealth, and prices. Diminishing Marginal Utility A household’s decision about the quantity of a particular output to demand depends on:
  • 13.
    Normal Goods aregoods for which demand goes up when income is higher and for which demand goes down when income is lower. Inferior Goods are goods for which demand falls when income rises.
  • 14.
    Substitutes are goodsthat can serve as replacements for one another; when the price of one increases, demand for the other goes up. Perfect substitutes are identical products. Complements are goods that “go together”; a decrease in the price of one results in an increase in demand for the other, and vice versa.
  • 15.
    • Higher incomedecreases the demand for an inferior good • Higher income increases the demand for a normal good
  • 16.
    • Price ofhamburger rises • Demand for complement good (ketchup) shifts left • Demand for substitute good (chicken) shifts right • Quantity of hamburger demanded falls
  • 17.
    The inverse relationshipbetween the price and the quantity demanded of a good or service during some period of time
  • 18.
    A demand scheduleis a table showing how much of a given product a household would be willing to buy at different prices. Demand curves are usually derived from demand schedules. PRICE (PER CALL) QUANTITY DEMANDED (CALLS PER MONTH) $ 0 30 0.50 25 3.50 7 7.00 3 10.00 1 15.00 0 ANNA'S DEMAND SCHEDULE FOR TELEPHONE CALLS
  • 19.
    The demand curveis a graph illustrating how much of a given product a household would be willing to buy at different prices. PRICE (PER CALL) QUANTITY DEMANDED (CALLS PER MONTH) $ 0 30 0.50 25 3.50 7 7.00 3 10.00 1 15.00 0 ANNA'S DEMAND SCHEDULE FOR TELEPHONE CALLS
  • 20.
    The law ofdemand states that there is a negative, or inverse, relationship between price and the quantity of a good demanded and its price. This means that demand curves slope downward.
  • 21.
    SHIFT OF DEMANDVERSUS MOVEMENT ALONG A DEMAND CURVE • A change in demand is not the same as a change in quantity demanded. • In this example, a higher price causes lower quantity demanded. • Changes in determinants of demand, other than price, cause a change in demand, or a shift of the entire demand curve, from DA to DB.
  • 22.
     When demandshifts to the right, demand increases. This causes quantity demanded to be greater than it was prior to the shift, for each and every price level. A CHANGE IN DEMAND VERSUS A CHANGE IN QUANTITY DEMANDED
  • 23.
    A CHANGE INDEMAND VERSUS A CHANGE IN QUANTITY DEMANDED To summarize: Change in price of a good or service leads to Change in quantity demanded (Movement along the curve). Change in income, preferences, or prices of other goods or services leads to Change in demand (Shift of curve).
  • 24.
    INCREASE IN DEMAND P Q 0 5 4 3 2 1 1020 30 40 50 60 70 80 D1 Quantity demanded D1 Increase in Demand D2 D2 Price ($ per unit)
  • 25.
    D1 D1 Decrease in Demand DECREASEIN DEMAND P Q 0 5 4 3 2 1 10 20 30 40 50 60 70 80 Quantity demanded D3 D3 Price ($ per unit)
  • 26.
    SHIFTS IN THEDEMAND CURVE Price of Ice-Cream Cone Quantity of Ice-Cream Cones Increase in demand Decrease in demand Demand curve, D3 Demand curve, D1 Demand curve, D2 0 26
  • 27.
    Demand for agood or service can be defined for an individual household, or for a group of households that make up a market. Market demand is the sum of all the quantities of a good or service demanded per period by all the households buying in the market for that good or service.
  • 28.
    Assuming there areonly two households in the market, market demand is derived as follows: