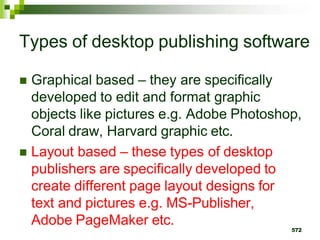
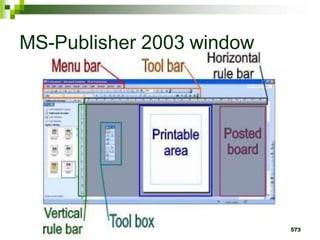
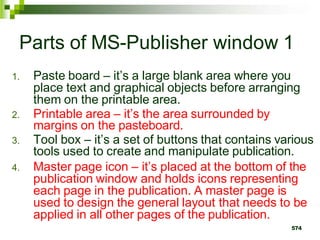
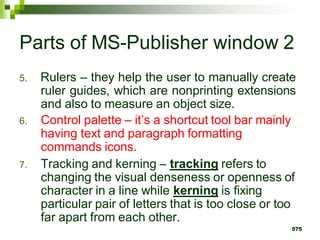
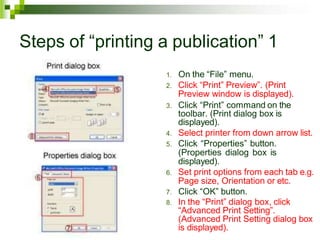
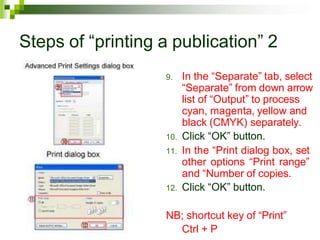
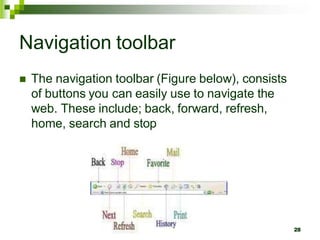
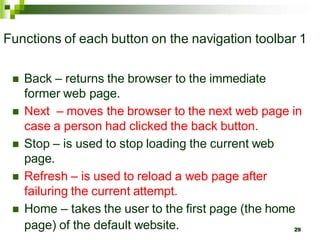
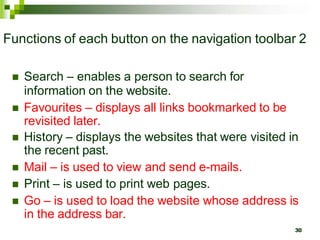
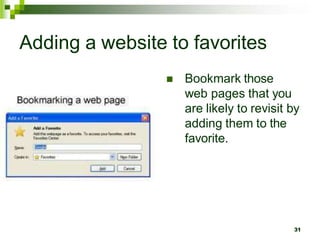
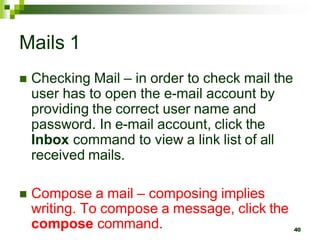
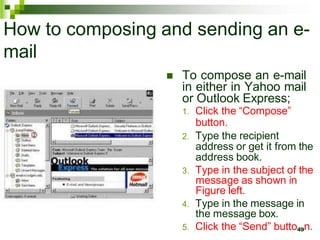
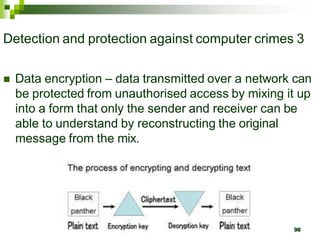
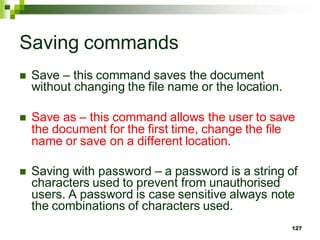
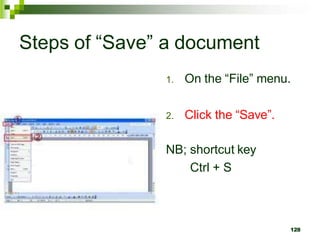
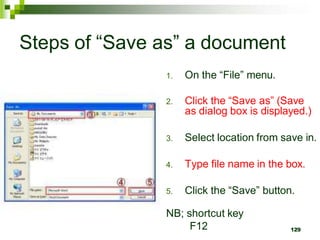
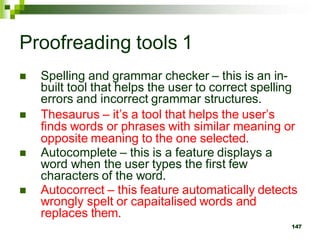
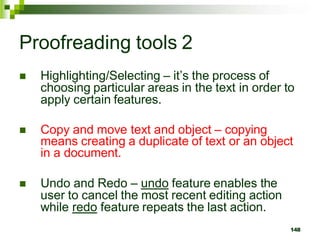
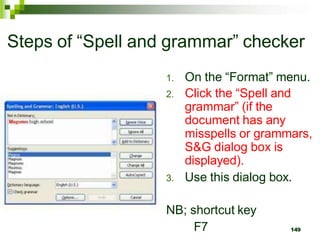
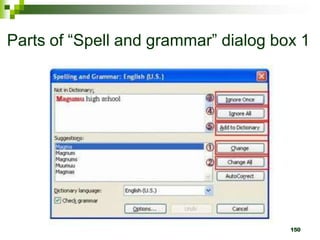
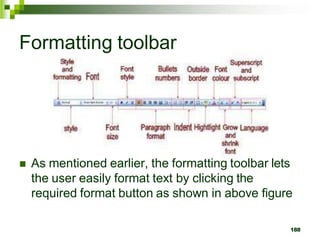
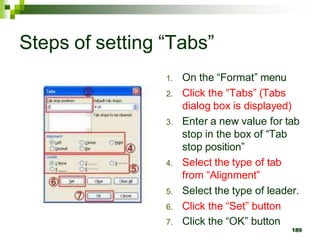
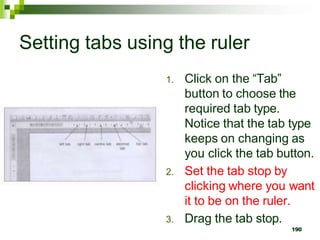
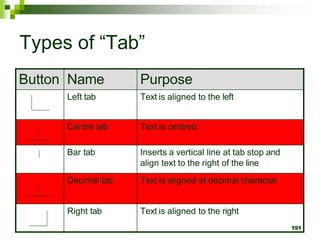
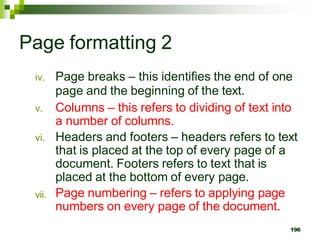
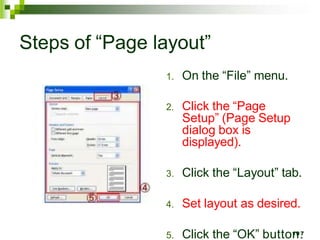
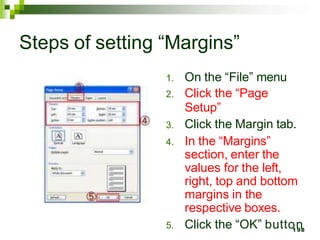
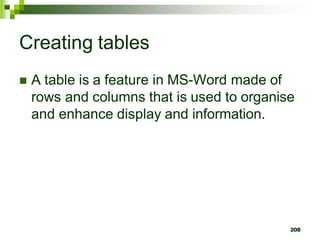
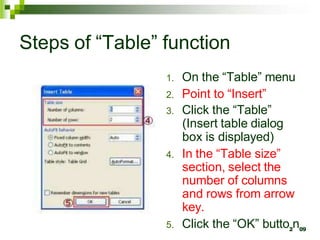
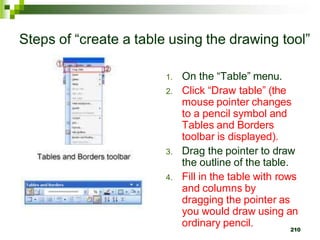
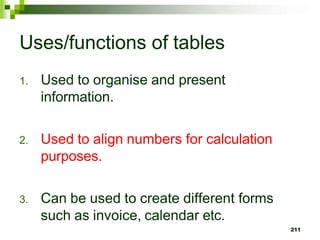
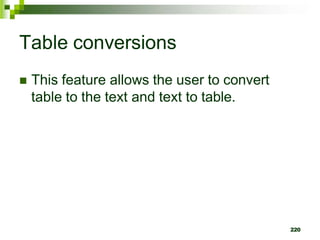
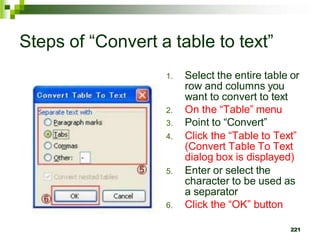
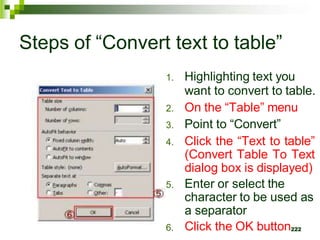
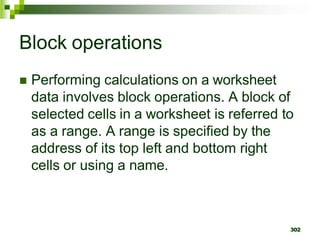
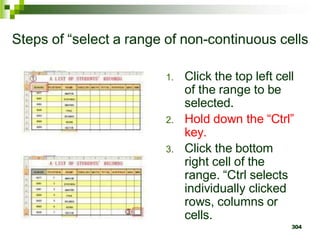
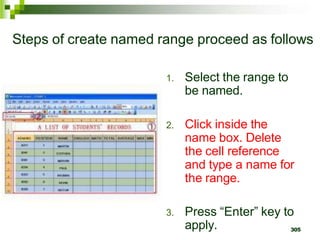
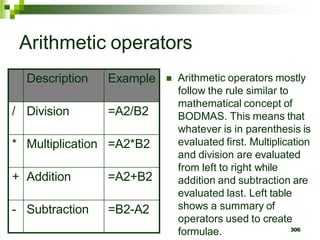
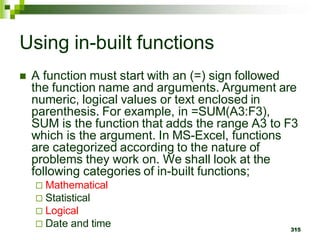
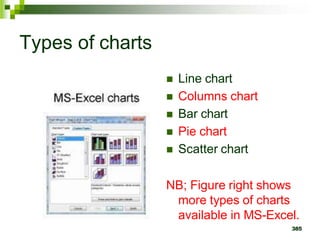
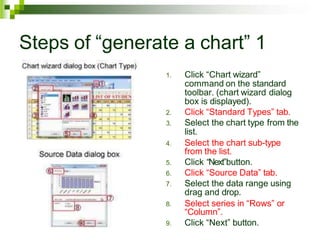
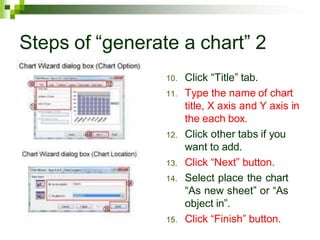
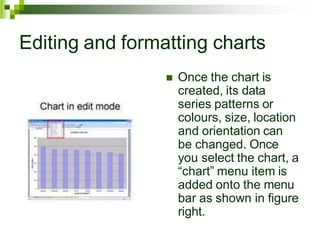
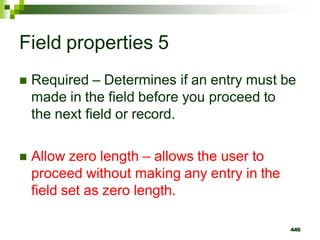
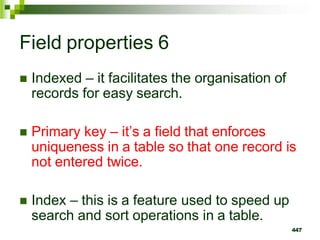
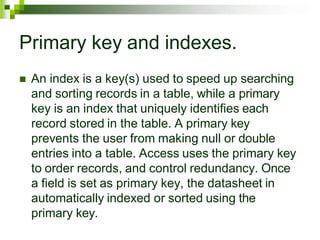
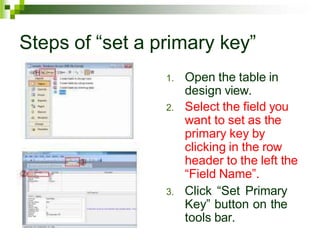
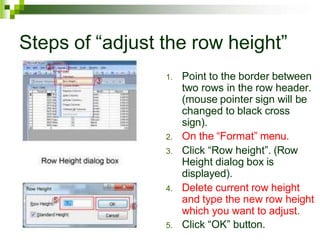
The document provides information about the internet and email. It discusses:
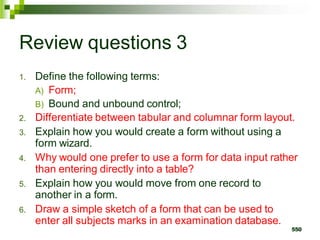
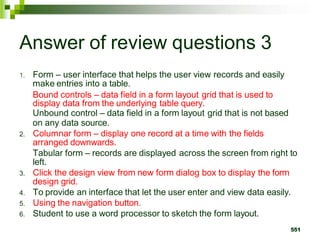
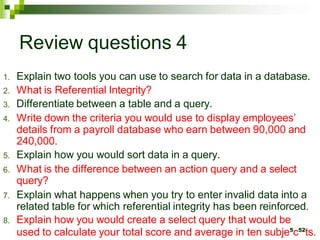
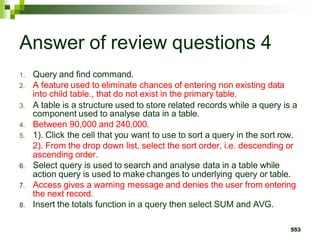
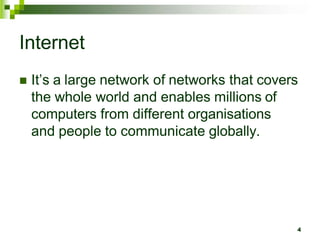
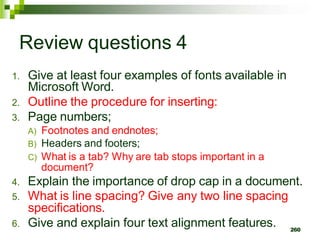
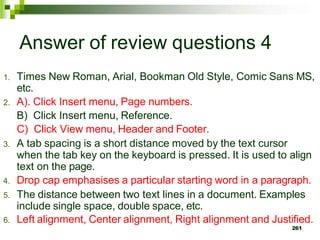
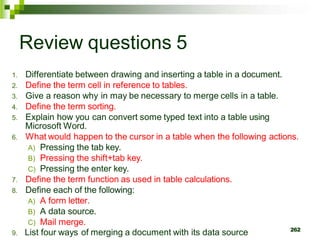
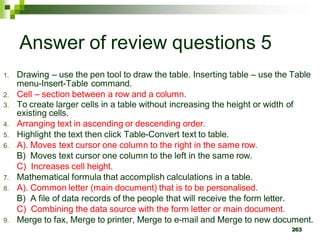
- The history and development of the internet from its origins as ARPANET in 1969 to the present day global network.
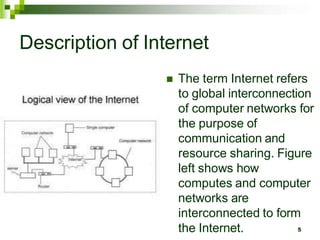
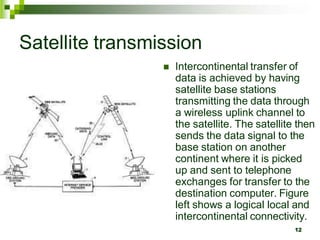
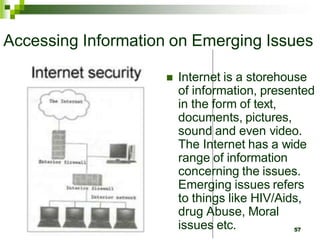
- How the internet connects computers worldwide through various technologies like telephone lines, satellites, modems and wireless networks.
- The roles of internet service providers and internet protocols in enabling connectivity and communication.
- Popular internet applications like email, instant messaging, web browsing and how they allow users to access information, communicate and conduct business online.

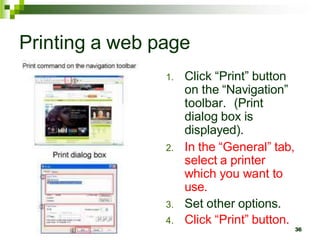


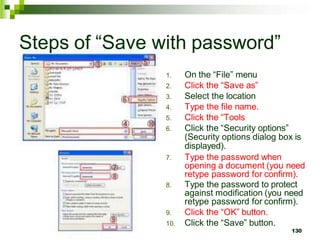
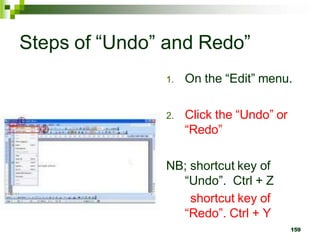

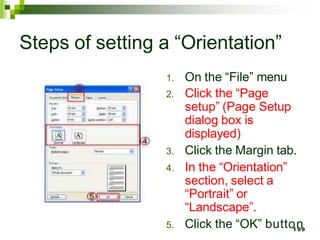
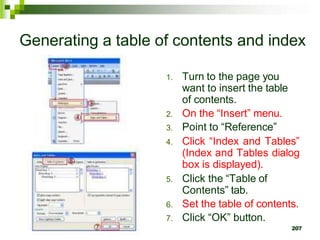
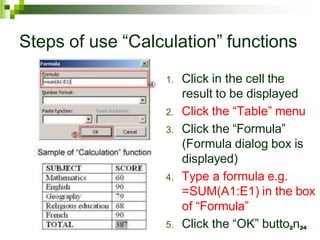


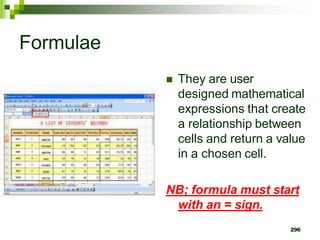

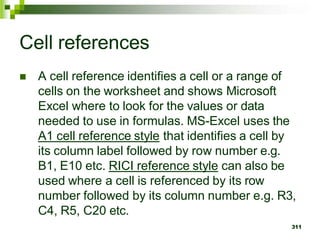
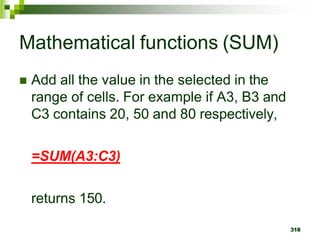
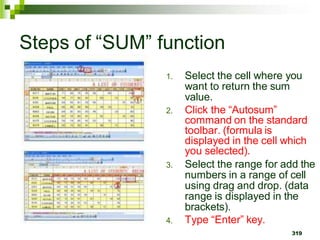
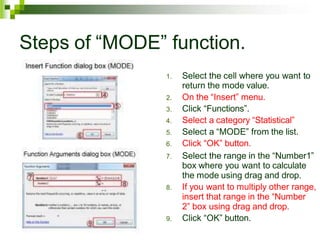

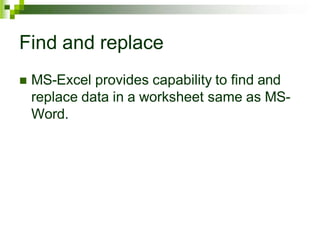
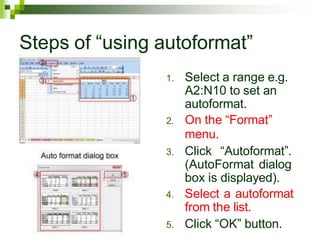

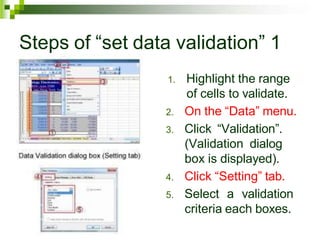

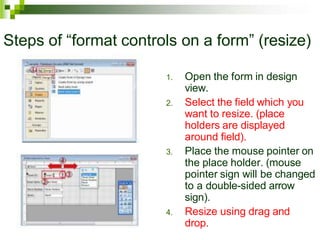
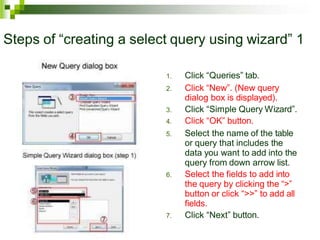
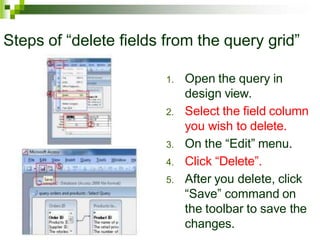
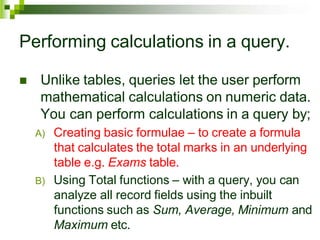
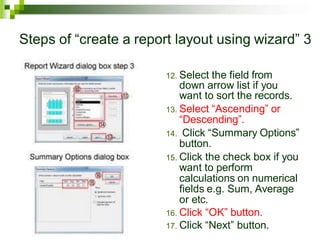
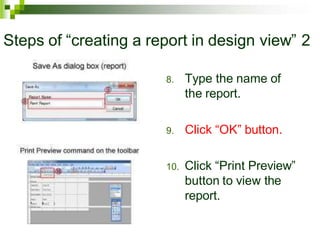
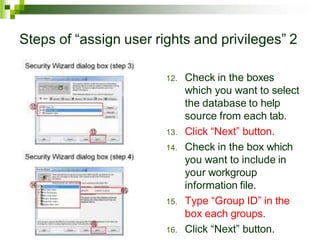
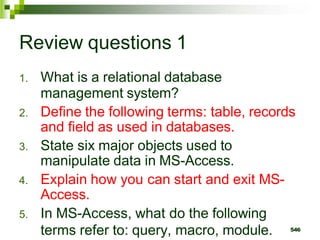
![Steps of “creating basic formulae”
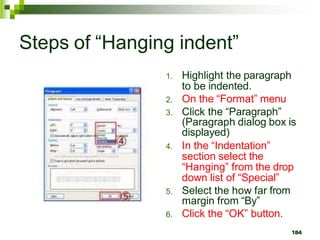
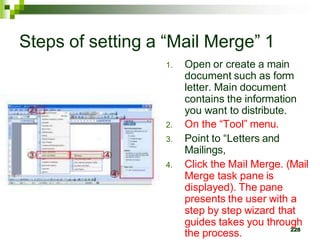
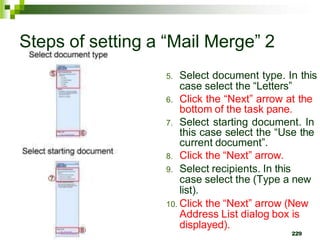
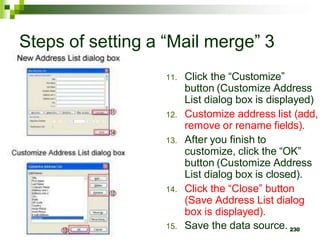
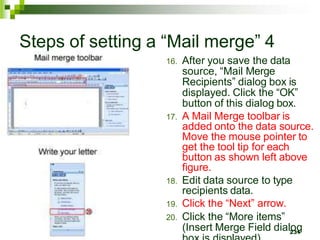
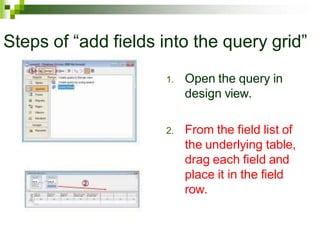
1. Open the query in
design view.
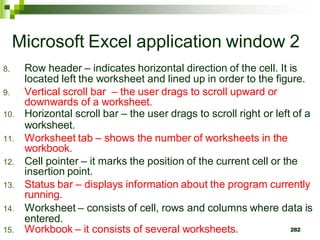
2. In an empty cell, type an
expression that includes
a field name of each as
“Amount: [Quantity] *
[Unit Price] as shown in
figure right above.
3. Click “Save” command
on the toolbar.
4. Click “Run” command
on the toolbar. (the
results of the
calculations is
displayed).](https://image.slidesharecdn.com/computer-form-2-notes-240207154609-4cead546/85/COMPUTER-FORM-2-NOTES-pptx-501-320.jpg)