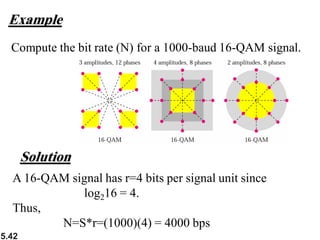
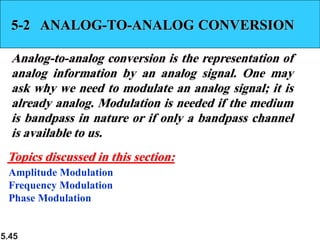
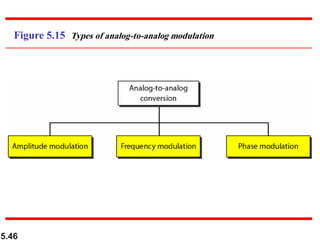
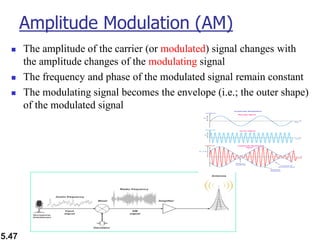
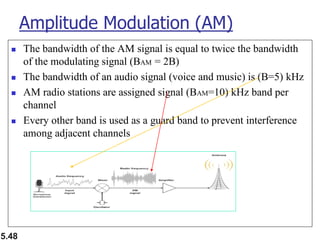
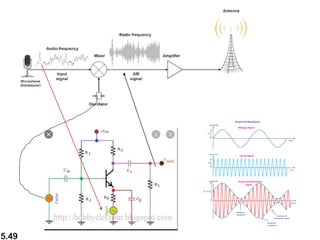
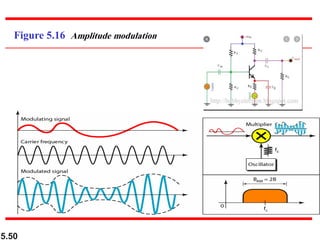
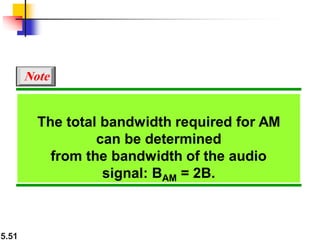
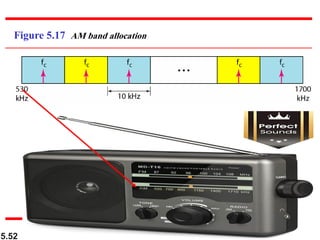
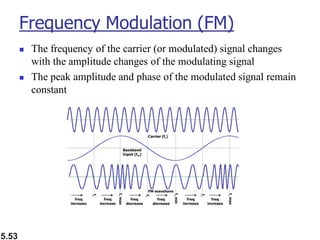
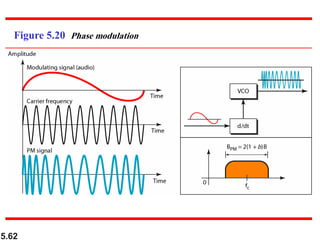
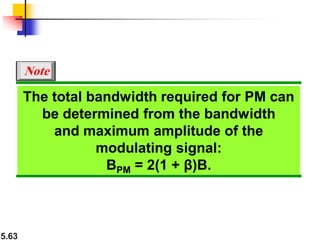
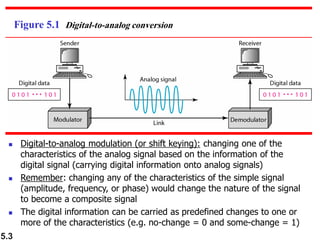
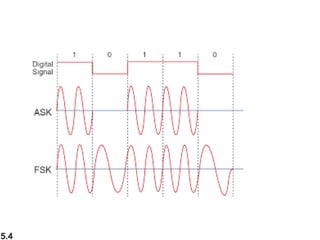
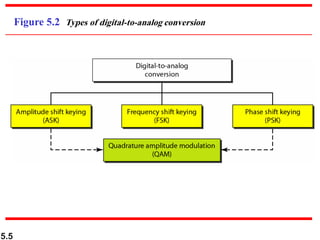
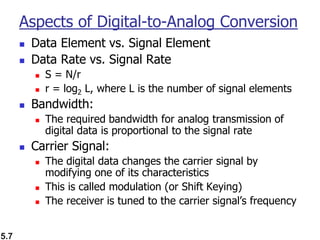
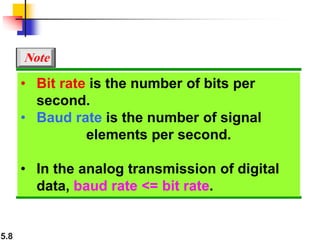
This document discusses various analog modulation techniques used to transmit analog and digital signals. It begins by explaining digital-to-analog conversion which involves modulating an analog carrier signal by changing aspects like amplitude, frequency or phase based on digital data. Then it describes different digital modulation techniques like amplitude shift keying (ASK), frequency shift keying (FSK) and phase shift keying (PSK). It also discusses more advanced modulations like quadrature amplitude modulation (QAM). The document then covers analog-to-analog conversion, explaining modulation techniques used when the medium is bandpass, like amplitude modulation (AM) and frequency modulation (FM). Key aspects like bandwidth requirements are also summarized.

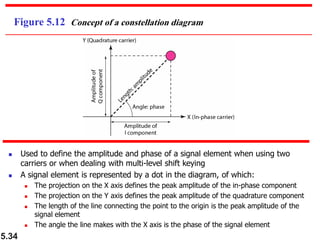
![5.12
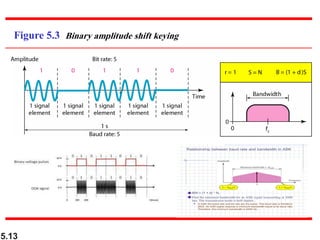
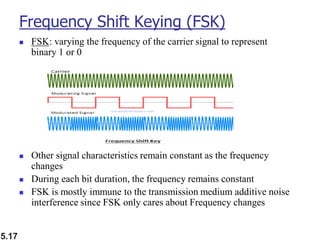
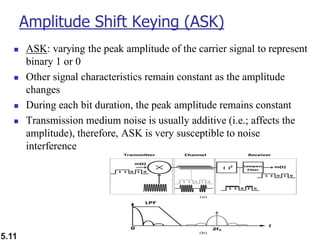
Amplitude Shift Keying (ASK)
◼ E.g of ASK is BASK (simplest form)
◼ Binary ASK (BASK) or On/Off Keying (OOK) modulation technique:
◼ One of the binary bits is represented by no voltage
◼ Advantage: requires less transmission energy compared to two-level techniques
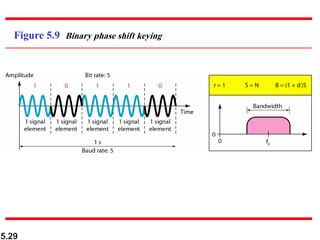
◼ BASK spectrum is most significantly between [fc - S/2, fc + S/2], where fc is
frequency of the carrier signal and S is the baud rate
◼ The ASK bandwidth is BBASK = (1+d) S , where d is a factor related to the
modulation process (channel Condition), d is between 0 and 1
◼ The minimum bandwidth required to transmit an ASK is equal to the baud rate
◼ The baud rate is the same as the bit rate ➔ N = S](https://image.slidesharecdn.com/chapter5-240101232628-e9b43414/85/Computer-Networks-Computer-Engineering-pdf-12-320.jpg)