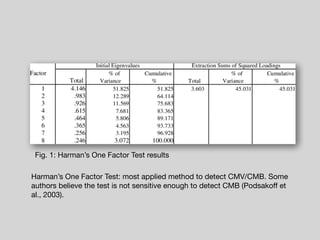
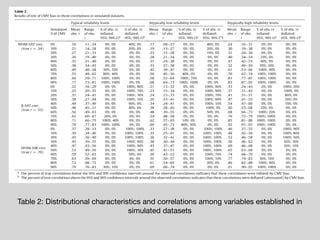
Common Methods Variance
Detection in Business
Research
presented by Renzo Del Giudice (洛洛⼦子謙)

DA71G204
Advanced Business Research Methods - PhD Program in Business and Management - STUST
Article citation:

• Fuller, C.M., et al. (2015). Common Method Variance
Detection in Business Research. Journal of Business
Research. DOI: 10.1016/j.jbusres.2015.12.008
!2Common Methods Variance Detection in Business Research - Renzo Del Giudice
Agenda
1. Introduction

2. Simulation

3. Results

4. Discussion
!3Common Methods Variance Detection in Business Research - Renzo Del Giudice
CMV and CMB in Business Research
• Common Method Variance (CMV) occurs when responses systematically vary
because of a common scaling approach on measures derived from a single
data source.

• CMV Bias (CMB): method (casual factor) distorts substantively-driven casual
effects.

• CMV: no changes on effect sizes, significance levels. It may either inflate or
deflate correlations (Conway & Lance, 2010).
!4Common Methods Variance Detection in Business Research - Renzo Del Giudice
1. Introduction 2. Simulation 3. Results 4. Discussion
CMV/CMB Post-hoc Tests
i) Harman’s One Factor Test (EFA producing eigenvalues suggesting first
factor accounts more than 50% of variance among variables (Podsakoff &
Organ, 1986)).

ii) Correlational Marker Technique (correction factor using a marker variable –
one unrelated to other items in survey – of a same scale type (Lindell &
Whitney, 2001)).

iii) CFA Marker Technique (marker variable in the CFA model to detect CMV
(Williams et al., 2010)).

iv) Unmeasured Latent Method Control Test - UCLM (specifies latent construct
with no uniquely observed constructs to represent shared variance between
method and substantive constructs (Williams, Cote & Buckley, 1989)).
!5Common Methods Variance Detection in Business Research - Renzo Del Giudice
1. Introduction 2. Simulation 3. Results 4. Discussion
Results of a Review
• 137 single-source, cross-sectional survey-based studies.

• 42 articles applying some post-hoc statistical CMV detection.

• 32 times Harman’s One Factor Test employed, 7 times ULCM, 5 times
Correlational Marker Technique, 1 time CFA Marker Technique.

• Possible explanations: i) CMV present, CMB not present, ii) CMB present, but
the tests don’t detect the bias, iii) Publications with CMB are not submitted or
rejected (Simmering et al., 2015).
!6Common Methods Variance Detection in Business Research - Renzo Del Giudice
1. Introduction 2. Simulation 3. Results 4. Discussion
Research Questions:
i) How much CMV must be presented to create bias sufficient to distort
interpretations materially? 

ii) ii) Is the Harman’s one factor test capable to detect CMV at biasing levels?

!7Common Methods Variance Detection in Business Research - Renzo Del Giudice
1. Introduction 2. Simulation 3. Results 4. Discussion
• At what level does CMV create bias? Not often (Crampton & Wagner, 1994).
Often (Cote & Buckley, 1987).

• Simulated data provide a better alternative (rather than real data) in assessing
how much CMV exist in a sample, the precise point at which bias occurs,
and the precise point at which tests can detect bias (Richardson et al., 2009).

• Study data: provided by Monte Carlo simulation - establish a pseudo-
population resembling real world data (Mooney, 1997).

• Table 1: Seven-variable model of satisfaction: Distributive Justice, Procedural
Justice, Interactional Justice, Satisfaction, Word of Mouth, Return Intention,
Satisfaction with Service Recovering.
!8Common Methods Variance Detection in Business Research - Renzo Del Giudice
1. Introduction 2. Simulation 3. Results 4. Discussion
• Simulation: constructs datasets that vary in simulated scale reliability and
CMV amounts in order to determine the amount of CMV to cause CMB: i)
Typical reliability (.87-.90 𝛼), ii) Low reliability (.77-.80 𝛼), iii) High reliability (.
97-.99 𝛼).

• Simulation: sets the amount of CMV shared at equal levels among variables,
from 0% to 90% (10% increments).

• The study simulates 10 datasets of each combination = 300 datasets to
analyze.

• Confidence Intervals: 95-99%. If CI contains true correlation = no bias, CI
exceeds = biased downward (deflated), CI below = biased upward (inflated).

• Next, Harman’s One Factor test application to each dataset.
!9Common Methods Variance Detection in Business Research - Renzo Del Giudice
1. Introduction 2. Simulation 3. Results 4. Discussion
• Table 2: Correlations don’t exhibit inflating CMB until certain amounts of
CMV: typical = 60%, low = 70%, high = 40%.

• Low levels of CMV are related to deflated correlations. CMV levels from 30%
to 60% is present on 95-99% correlations = little concern of CMB.

• CMV in real-life surveys: typically 10 or 20%, no inflated correlation appears
(Malhotra et al, 2006).

• Table 3: Harman’s One Factor Test indicates CMB with CMV > 70%.
!10Common Methods Variance Detection in Business Research - Renzo Del Giudice
1. Introduction 2. Simulation 3. Results 4. Discussion
• Table 4: Harman’s One Factor Test producing false negatives (indicating no
CMB when CMB is present) and false positives (indicating CMB when it is no
evident in data).

• Typical range reliability: FP exists at higher levels of CMV.

• Low range reliability: FP exists at 70%< CMV.

• High range reliability: FP exists at each level of correlation.

• Typical rage reliability with low correlations and CMV = 70%: Harman’s One
Factor Test doesn’t detect CMB when it exists. 

• Harman’s One Factor Test: concludes falsely that CMB exists, depending of
true correlation size, scale reliability’ and number of variables analyzed.
!11Common Methods Variance Detection in Business Research - Renzo Del Giudice
1. Introduction 2. Simulation 3. Results 4. Discussion
• Lower to moderate levels of CMV don’t inflate correlations (results from
simulations). CMV might upward bias only when it’s very high (>70%), which
is not present in most studies.

• Typical scale unreliability deflate relationships and balance out CMB. Very
high scale reliabilities suggesting low CMV are associated with CMB in
relationships.

• Harman’s One Factor Test fails to detect upward CMB only when CMV =
70%.

• CMV doesn’t often occur at biasing levels. Only when CMV percentage is
surprisingly high is necessary to bias relationships across all sample sizes.
!12Common Methods Variance Detection in Business Research - Renzo Del Giudice
1. Introduction 2. Simulation 3. Results 4. Discussion
!13Common Methods Variance Detection in Business Research - Renzo Del Giudice
1. Introduction 2. Simulation 3. Results 4. Discussion
Limitations and future research:
• Simulation focused on Harman’s One
Test only.

• Simulated data only encompass a small
range of conditions (e.g., magnitude of
correlation).

• Limited scope of reviews.

• Data produced by the simulation may
not correspond to intricacies of real
world.
Recommendations and Conclusions:
• CMV doesn’t generates bias just
because the data originates from same
respondents. CMB is an exception.

• Harman’s One Factor Test cannot
produce a conclusion about biasing
levels of CMV, but it can detect it.

• Empirical evidence concerning CMV are
likely overstated.

• Harman’s One Factor Test can detect
CMB under typical conditions of a
survey-based market research. CMV
≧70% to concern about inflated
relationships.
!14
Thanks for your
attention!
Common Methods Variance Detection in Business Research - Renzo Del Giudice
Fig. 1: Harman’s One Factor Test results
Harman’s One Factor Test: most applied method to detect CMV/CMB. Some
authors believe the test is not sensitive enough to detect CMB (Podsakoff et
al., 2003).
Table 1: Distributional characteristics and correlations among variables established in
simulated datasets
Table 2: Distributional characteristics and correlations among variables established in
simulated datasets
Table 3: Results of Harman’s One Factor Test on simulated datasets
The only instance CMV presents inflated correlation is between 60 and 70% (Table 2).
Table 4: Conclusions drawn using Harman’s one-factor test when detecting biasing levels
of CMV.

Common Method Variance Detection in Business Research

  • 1.
    Common Methods Variance Detectionin Business Research presented by Renzo Del Giudice (洛洛⼦子謙) DA71G204 Advanced Business Research Methods - PhD Program in Business and Management - STUST
  • 2.
    Article citation: • Fuller,C.M., et al. (2015). Common Method Variance Detection in Business Research. Journal of Business Research. DOI: 10.1016/j.jbusres.2015.12.008 !2Common Methods Variance Detection in Business Research - Renzo Del Giudice
  • 3.
    Agenda 1. Introduction 2. Simulation 3.Results 4. Discussion !3Common Methods Variance Detection in Business Research - Renzo Del Giudice
  • 4.
    CMV and CMBin Business Research • Common Method Variance (CMV) occurs when responses systematically vary because of a common scaling approach on measures derived from a single data source. • CMV Bias (CMB): method (casual factor) distorts substantively-driven casual effects. • CMV: no changes on effect sizes, significance levels. It may either inflate or deflate correlations (Conway & Lance, 2010). !4Common Methods Variance Detection in Business Research - Renzo Del Giudice 1. Introduction 2. Simulation 3. Results 4. Discussion
  • 5.
    CMV/CMB Post-hoc Tests i)Harman’s One Factor Test (EFA producing eigenvalues suggesting first factor accounts more than 50% of variance among variables (Podsakoff & Organ, 1986)). ii) Correlational Marker Technique (correction factor using a marker variable – one unrelated to other items in survey – of a same scale type (Lindell & Whitney, 2001)). iii) CFA Marker Technique (marker variable in the CFA model to detect CMV (Williams et al., 2010)). iv) Unmeasured Latent Method Control Test - UCLM (specifies latent construct with no uniquely observed constructs to represent shared variance between method and substantive constructs (Williams, Cote & Buckley, 1989)). !5Common Methods Variance Detection in Business Research - Renzo Del Giudice 1. Introduction 2. Simulation 3. Results 4. Discussion
  • 6.
    Results of aReview • 137 single-source, cross-sectional survey-based studies. • 42 articles applying some post-hoc statistical CMV detection. • 32 times Harman’s One Factor Test employed, 7 times ULCM, 5 times Correlational Marker Technique, 1 time CFA Marker Technique. • Possible explanations: i) CMV present, CMB not present, ii) CMB present, but the tests don’t detect the bias, iii) Publications with CMB are not submitted or rejected (Simmering et al., 2015). !6Common Methods Variance Detection in Business Research - Renzo Del Giudice 1. Introduction 2. Simulation 3. Results 4. Discussion
  • 7.
    Research Questions: i) Howmuch CMV must be presented to create bias sufficient to distort interpretations materially? ii) ii) Is the Harman’s one factor test capable to detect CMV at biasing levels? !7Common Methods Variance Detection in Business Research - Renzo Del Giudice 1. Introduction 2. Simulation 3. Results 4. Discussion
  • 8.
    • At whatlevel does CMV create bias? Not often (Crampton & Wagner, 1994). Often (Cote & Buckley, 1987). • Simulated data provide a better alternative (rather than real data) in assessing how much CMV exist in a sample, the precise point at which bias occurs, and the precise point at which tests can detect bias (Richardson et al., 2009). • Study data: provided by Monte Carlo simulation - establish a pseudo- population resembling real world data (Mooney, 1997). • Table 1: Seven-variable model of satisfaction: Distributive Justice, Procedural Justice, Interactional Justice, Satisfaction, Word of Mouth, Return Intention, Satisfaction with Service Recovering. !8Common Methods Variance Detection in Business Research - Renzo Del Giudice 1. Introduction 2. Simulation 3. Results 4. Discussion
  • 9.
    • Simulation: constructsdatasets that vary in simulated scale reliability and CMV amounts in order to determine the amount of CMV to cause CMB: i) Typical reliability (.87-.90 𝛼), ii) Low reliability (.77-.80 𝛼), iii) High reliability (. 97-.99 𝛼). • Simulation: sets the amount of CMV shared at equal levels among variables, from 0% to 90% (10% increments). • The study simulates 10 datasets of each combination = 300 datasets to analyze. • Confidence Intervals: 95-99%. If CI contains true correlation = no bias, CI exceeds = biased downward (deflated), CI below = biased upward (inflated). • Next, Harman’s One Factor test application to each dataset. !9Common Methods Variance Detection in Business Research - Renzo Del Giudice 1. Introduction 2. Simulation 3. Results 4. Discussion
  • 10.
    • Table 2:Correlations don’t exhibit inflating CMB until certain amounts of CMV: typical = 60%, low = 70%, high = 40%. • Low levels of CMV are related to deflated correlations. CMV levels from 30% to 60% is present on 95-99% correlations = little concern of CMB. • CMV in real-life surveys: typically 10 or 20%, no inflated correlation appears (Malhotra et al, 2006). • Table 3: Harman’s One Factor Test indicates CMB with CMV > 70%. !10Common Methods Variance Detection in Business Research - Renzo Del Giudice 1. Introduction 2. Simulation 3. Results 4. Discussion
  • 11.
    • Table 4:Harman’s One Factor Test producing false negatives (indicating no CMB when CMB is present) and false positives (indicating CMB when it is no evident in data). • Typical range reliability: FP exists at higher levels of CMV. • Low range reliability: FP exists at 70%< CMV. • High range reliability: FP exists at each level of correlation. • Typical rage reliability with low correlations and CMV = 70%: Harman’s One Factor Test doesn’t detect CMB when it exists. • Harman’s One Factor Test: concludes falsely that CMB exists, depending of true correlation size, scale reliability’ and number of variables analyzed. !11Common Methods Variance Detection in Business Research - Renzo Del Giudice 1. Introduction 2. Simulation 3. Results 4. Discussion
  • 12.
    • Lower tomoderate levels of CMV don’t inflate correlations (results from simulations). CMV might upward bias only when it’s very high (>70%), which is not present in most studies. • Typical scale unreliability deflate relationships and balance out CMB. Very high scale reliabilities suggesting low CMV are associated with CMB in relationships. • Harman’s One Factor Test fails to detect upward CMB only when CMV = 70%. • CMV doesn’t often occur at biasing levels. Only when CMV percentage is surprisingly high is necessary to bias relationships across all sample sizes. !12Common Methods Variance Detection in Business Research - Renzo Del Giudice 1. Introduction 2. Simulation 3. Results 4. Discussion
  • 13.
    !13Common Methods VarianceDetection in Business Research - Renzo Del Giudice 1. Introduction 2. Simulation 3. Results 4. Discussion Limitations and future research: • Simulation focused on Harman’s One Test only. • Simulated data only encompass a small range of conditions (e.g., magnitude of correlation). • Limited scope of reviews. • Data produced by the simulation may not correspond to intricacies of real world. Recommendations and Conclusions: • CMV doesn’t generates bias just because the data originates from same respondents. CMB is an exception. • Harman’s One Factor Test cannot produce a conclusion about biasing levels of CMV, but it can detect it. • Empirical evidence concerning CMV are likely overstated. • Harman’s One Factor Test can detect CMB under typical conditions of a survey-based market research. CMV ≧70% to concern about inflated relationships.
  • 14.
    !14 Thanks for your attention! CommonMethods Variance Detection in Business Research - Renzo Del Giudice
  • 15.
    Fig. 1: Harman’sOne Factor Test results Harman’s One Factor Test: most applied method to detect CMV/CMB. Some authors believe the test is not sensitive enough to detect CMB (Podsakoff et al., 2003).
  • 16.
    Table 1: Distributionalcharacteristics and correlations among variables established in simulated datasets
  • 17.
    Table 2: Distributionalcharacteristics and correlations among variables established in simulated datasets
  • 18.
    Table 3: Resultsof Harman’s One Factor Test on simulated datasets The only instance CMV presents inflated correlation is between 60 and 70% (Table 2).
  • 19.
    Table 4: Conclusionsdrawn using Harman’s one-factor test when detecting biasing levels of CMV.