Downloaded 46 times

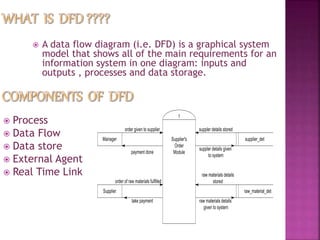
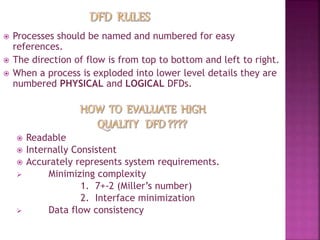
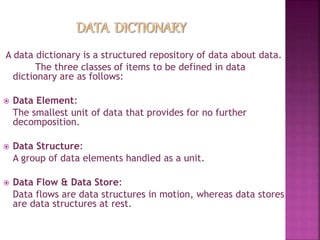
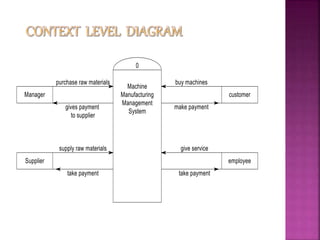
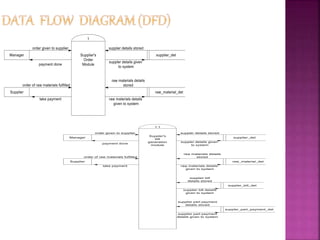
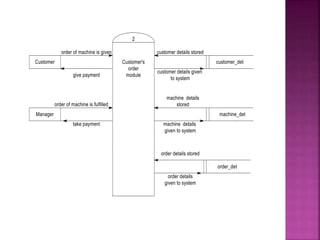
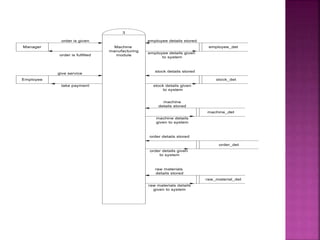

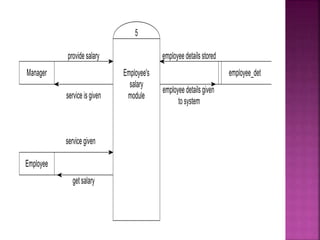
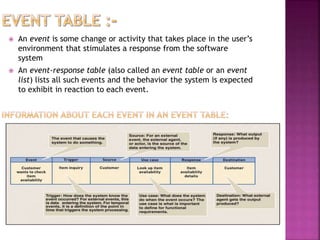
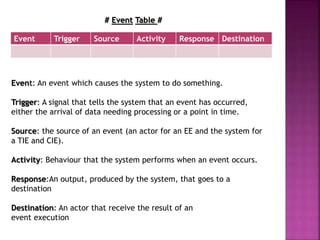
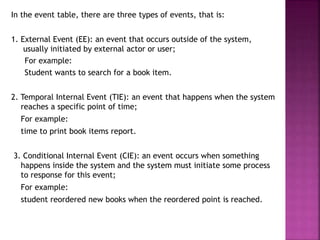
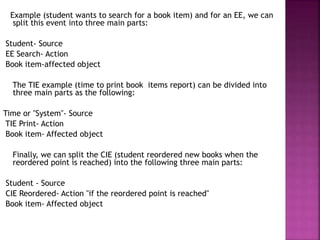
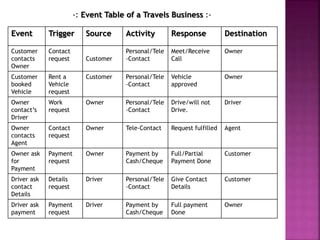
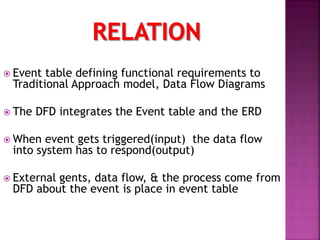
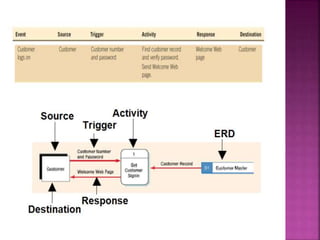
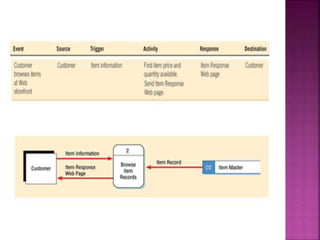

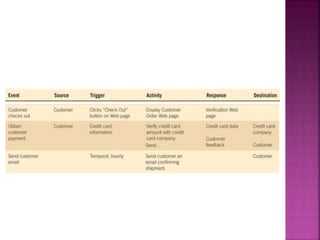


A data flow diagram (DFD) visually shows the requirements of an information system through inputs, outputs, processes, data storage, and external entities. It uses standard symbols like processes, data flow, data stores, and external agents. The direction of data flow is top to bottom and left to right. Lower level DFDs expand processes into more detail. An event table lists events that trigger system responses. It includes the event, trigger, source, activity, response, and destination. Event tables define functional requirements and integrate with DFDs by showing how data flows when events are triggered. Each event table row represents a DFD fragment used to create a single process.


![[[Srs]] online shopping website for TYBSC IT](https://cdn.slidesharecdn.com/ss_thumbnails/srsonlineshoppingwebsite-180419114654-thumbnail.jpg?width=640&height=640&fit=bounds)