Software Engineering - Modelling Concepts + Class Modelling + Building the An...
Answer key for pattern recognition and machine learning
1. SRI RAMAKRISHNA ENGINEERING COLLEGE
[Educational Service: SNR Sons Charitable Trust]
[Autonomous Institution, Reaccredited by NAAC with ‘A+’ Grade]
[Approved by AICTE and Permanently Affiliated to Anna University, Chennai]
[ISO 9001:2015 Certified and all eligible programmes Accredited by NBA]
VATTAMALAIPALAYAM, N.G.G.O. COLONY POST, COIMBATORE – 641 022.
Department of Electronics and Communication Engineering
Internal Test – I
Date 12.3.2024 Department ECE
Semester VI Class/section III ECE
Duration 2:00 Hours Maximum marks 50
Course Code &Title: 20EC2E08 & PATTERN RECOGNITION AND MACHINE LEARNING
Course Outcomes Addressed:
CO1: Outline the basic concepts of linear algebra, probability, statistics and pattern Recognition
CO2: Interpret various clustering techniques for 1D and 2D signal.
Questions Cognitive
Level/CO
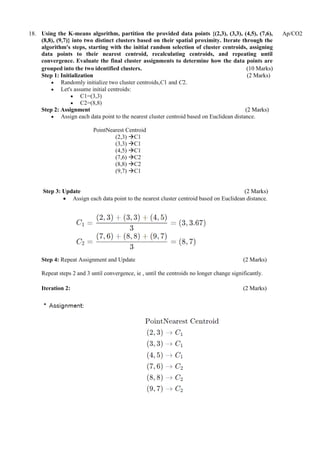
PART – A (Answer All Questions) (10*1 =10 Marks)
1. Identify the type of learning in which labeled training data is used.
R/ CO2
a) Semi
unsupervised
learning
b) Supervised
learning
c) Reinforcement
learning
d) Unsupervised learning
2. Machine Learning is a subset of _______________
U/ CO2
a) Deep Learning b) Artificial
Intelligence.
c) Deep Learning d) Neural Networks
3. In image processing, which technique is commonly used for edge detection?
U/ CO2
a) Gaussian blur b) Sobel operator c) Fourier transform d) Haar wavelet transform
4. Probability theory deals with _______________
R/CO1
a) Deterministic
outcomes
b) Uncertain
outcomes
c) Singular outcomes d) Continuous outcomes
5. Which of the following matrices is not invertible?
U/ CO1
a) Identity matrix b) Zero matrix c) Diagonal matrix
with non-zero
elements on the
diagonal
d) Symmetric matrix
6. Which of the following is not a measure of central tendency in statistics?
R/ CO1
a) Mean b) Median c) Mode d) Variance
7. Identify the method that primarily focuses on validating control algorithms within a simulated
environment. U/ CO1
a) Regression
analysis
b) Time series
analysis
c) Factor analysis d) Hypothesis testing
8. ________ is the process of recognizing patterns by using machine learning algorithm. Pattern
Recognition.
U/CO1
2. 9. In K-medoids clustering, each cluster is represented by one of the data points called __________
medoid R/ CO2
10. In pattern recognition, ______________ is the process of finding a mathematical function that best
approximates the mapping from input to output variables. modeling
U/ CO2
PART – B (Answer All Questions) (5*2 =10 Marks) Cognitive
Level/CO
11. Differentiate between clustering and classification in pattern recognition. (2 Marks)
Clustering in pattern recognition involves grouping similar data points together based on certain
criteria without any predefined labels, whereas classification assigns labels to data points based
on their features.
Example scenario: Clustering could be used to group customers based on their purchasing
behavior without any prior knowledge of customer segments. Classification, on the other hand,
could be employed to classify emails as spam or non-spam based on their content and features.
U/CO1
12. A sample of scores from a mathematics test, consisting of 50 students, has been collected. The
mean score of this sample is calculated to be 75, with a standard deviation of 8. Determine
the point estimate for the population mean score and compute the confidence interval for the
population mean score whose margin of error is 2.23. (2 Marks)
1. Point Estimate for Population Mean Score: (1 Mark)
2. Population Mean Estimate=Sample Mean=75
3. Confidence Interval: (1 Mark)
Confidence Interval = Sample Mean ± (Margin of Error)
= 75 ± 2.23
Population mean score lies within the interval (72.77, 77.23).
4.
Ap/CO2
13. Discuss the concept of point estimation in statistics with a simple example. (2 Marks)
Point estimation in statistics involves using a single value, typically a statistic derived from a
sample, to estimate an unknown parameter in a population. For instance, estimating the
population mean from the sample mean is a form of point estimation. In this case, the sample
mean serves as the point estimate for the population mean. Point estimation provides a specific
value as an estimate, aiming to capture the most likely value of the parameter.
For example, if we want to estimate the average height of students in a school, we might take a
sample of 100 students and calculate their average height. This average height serves as our point
estimate for the average height of all students in the school.
In contrast, interval estimation provides a range of values within which the true parameter value
is believed to lie, along with a level of confidence. This allows for a more nuanced understanding
of uncertainty compared to point estimation.
U/CO1
14. Compare DBSCAN clustering with OPTICS clustering. (Any 2 differences) (2 Marks)
Clustering Approach:
• DBSCAN identifies clusters based on density connectivity, categorizing points as core,
border, and noise points.
• OPTICS also relies on density, but creates an ordered list of points based on their density
reachability, enabling hierarchical cluster detection without predefined parameters.
U/CO2
3. Parameter Sensitivity:
• DBSCAN requires the specification of epsilon (ε) and minPts, making it sensitive to
parameter choice.
• OPTICS is less sensitive to parameter settings, as it constructs a reachability plot,
reducing the need for manual parameter tuning.
Performance:
• DBSCAN can be more efficient for high-dimensional data or varying density clusters,
but may struggle with noise and significantly different cluster sizes.
• OPTICS may be computationally more expensive due to constructing reachability plots,
but excels in handling varying density clusters and hierarchical structures.
Noise Handling:
• DBSCAN explicitly identifies noise points as outliers, aiding in noise removal from the
dataset.
• OPTICS does not explicitly classify noise points, but provides a reachability plot for
users to interpret noise based on reachability distances..
15. List the advantages of Hierarchical clustering. (Any 4 advantages)
• Hierarchical clustering doesn't require specifying the number of clusters beforehand,
offering flexibility in analysis.
• It generates a dendrogram, providing a visual representation of cluster relationships for
easy interpretation.
• Hierarchical clustering is robust to outliers, ensuring they have minimal impact on the
clustering outcome.
• It can accommodate clusters of varying shapes and sizes, making it suitable for diverse
datasets.
• The method supports both agglomerative (bottom-up) and divisive (top-down)
approaches, catering to different data structures.
• Hierarchical clustering preserves data relationships, capturing the underlying structure of
the dataset.
U/CO2
PART – C (3*10 = 30 Marks)
16. Compulsory Question:
Elaborate on the significance of minimizing within-cluster distance in pattern recognition,
highlighting its impact on cluster cohesion and separation. (10 Marks)
The minimum within-cluster distance criterion is a concept used in pattern recognition and
clustering algorithms to evaluate the quality of cluster assignments. It measures how tightly
grouped the data points (or objects) within each cluster are. The criterion aims to minimize the
distance between data points within the same cluster, indicating that the members of a cluster are
more similar to each other than to data points in other clusters.
Here's a detailed explanation of the minimum within-cluster distance criterion:
1. Definition : (2 Marks)
• Within-cluster distance, also known as intra-cluster distance or intra-cluster
variance, refers to the average distance between all pairs of points within the
same cluster.
• The minimum within-cluster distance criterion seeks to minimize this distance,
indicating that the objects within a cluster are tightly packed together and exhibit
high similarity.
2. Mathematical Formulation : (2 Marks)
• Let Ck represent the kth cluster.
• The within-cluster distance for cluster Ck, denoted as W(Ck), can be calculated
using a distance metric such as Euclidean distance, Manhattan distance, or
Mahalanobis distance.
U/CO1
4. • The minimum within-cluster distance criterion seeks to minimize the sum of
within-cluster distances across all clusters, often expressed as:
• Here, K represents the total number of clusters.
3. Algorithmic Implications : (2 Marks)
• In clustering algorithms such as K-means, hierarchical clustering, or DBSCAN,
the objective is to partition the data into clusters such that the within-cluster
distance is minimized.
• K-means, for example, iteratively assigns data points to clusters and updates the
cluster centroids to minimize the sum of squared distances from each point to its
assigned centroid.
• Hierarchical clustering methods recursively merge or split clusters based on a
linkage criterion (e.g., single-linkage, complete-linkage) to optimize the within-
cluster distance.
• DBSCAN (Density-Based Spatial Clustering of Applications with Noise) forms
clusters based on regions of high density, aiming to maximize the number of data
points within a cluster while minimizing thithin-cluster distance.
4. Evaluation: (2 Marks)
• The minimum within-cluster distance criterion serves as an evaluation measure
to assess the quality of clustering results.
• Lower values of within-cluster distance indicate tighter, more cohesive clusters,
suggesting better separation between different groups of data points.
• However, it's important to balance within-cluster cohesion with between-cluster
separation to avoid overfitting or underfitting the data.
5. Limitations : (2 Marks)
• While minimizing within-cluster distance is essential for clustering, it may not
always lead to meaningful or interpretable clusters.
• The choice of distance metric, cluster initialization method, and the number of
clusters (K) can significantly impact the clustering results.
• The minimum within-cluster distance criterion does not consider the global
structure of the data or the potential presence of outliers.
the minimum within-cluster distance criterion is a fundamental concept in pattern recognition and
clustering, guiding the formation of compact, well-separated clusters. By minimizing the distance
between data points within the same cluster, this criterion helps identify meaningful patterns and
structure within the data
Any Two Questions
17. Construct the design cycle of pattern recognition system for sorting incoming fish on a
conveyor in any one of the following category namely superclass Agnatha (jawless fishes),
class Chondrichthyes (cartilaginous fishes), and superclass Osteichthyes (bony fishes) using
optical sensing. (10 Marks)
Problem Definition and Requirement Analysis: (1 Mark)
• Define the objective of developing a pattern recognition system to sort incoming fish based
on taxonomic categories, namely superclass Agnatha (jawless fishes), class
Chondrichthyes (cartilaginous fishes), and superclass Osteichthyes (bony fishes), using
optical sensing technology.
• Identify the specific requirements for the system, such as accuracy in classifying fish into
their respective categories, speed of processing, scalability to handle varying loads of fish,
and the capability to differentiate between different fish categories based on optical
characteristics.
Ap/CO1
5. Data Collection: (1 Mark)
• Gather a diverse dataset of fish images or optical signatures representing each taxonomic
category (superclass Agnatha, class Chondrichthyes, and superclass Osteichthyes).
• Collect images or optical data of various fish species belonging to each category, ensuring
representation of different sizes, colors, textures, and orientations to enhance the
robustness of the pattern recognition system.
Preprocessing: (1 Mark)
• Clean the collected data by removing noise, artifacts, and any irrelevant information that
may hinder classification accuracy.
• Enhance fish images or optical signatures through techniques such as contrast adjustment,
brightness normalization, and resizing to ensure consistency and improve feature
extraction.
Feature Extraction: ( 1 Mark)
• Extract relevant features from preprocessed fish images or optical data that are indicative
of each taxonomic category (Agnatha, Chondrichthyes, Osteichthyes).
• Identify key features such as shape, color, texture, and optical characteristics unique to
each category, which will serve as discriminative factors for classification.
Algorithm Selection: ( 1 Mark)
• Choose appropriate pattern recognition algorithms capable of effectively classifying fish
into their respective taxonomic categories based on the extracted features.
• Consider algorithms such as Convolutional Neural Networks (CNNs), Support Vector
Machines (SVMs), or decision trees, which have demonstrated effectiveness in image
classification tasks.
Training Data Split: ( 1 Mark)
• Split the collected dataset into training, validation, and test sets, ensuring representative
distribution of fish samples across superclass Agnatha, class Chondrichthyes, and
superclass Osteichthyes.
• Allocate a sufficient portion of the dataset for training to enable the model to learn the
distinguishing features of each fish category.
Model Training: ( 1 Mark)
• Train the selected pattern recognition model using the training dataset, focusing on
superclass Agnatha, class Chondrichthyes, and superclass Osteichthyes.
• Optimize model parameters and architecture to improve classification accuracy,
leveraging techniques such as data augmentation, regularization, and hyperparameter
tuning.
Testing and Evaluation: ( 1 Mark)
• Evaluate the trained model's performance using the separate test dataset, assessing its
ability to accurately classify incoming fish into the specified taxonomic categories.
• Measure metrics such as accuracy, precision, recall, and F1-score to quantitatively assess
the model's classification performance across superclass Agnatha, class Chondrichthyes,
and superclass Osteichthyes.
Integration and Deployment: ( 1 Mark)
• Integrate the trained model into the fish sorting system along the conveyor belt, ensuring
seamless operation and compatibility with optical sensing technology.
• Implement necessary hardware components for image acquisition and processing to enable
real-time classification of incoming fish based on their taxonomic categories.
Maintenance and Optimization: ( 1 Mark)
• Continuously monitor the system's performance and gather feedback from operators
regarding classification accuracy and efficiency.
• Regularly update the model with new data to adapt to changes in fish species
characteristics or environmental conditions, ensuring continued effectiveness in sorting
superclass Agnatha, class Chondrichthyes, and superclass Osteichthyes.
• Optimize system parameters and algorithms based on performance metrics and feedback
to enhance sorting accuracy and overall system efficiency.
6. 18. Using the K-means algorithm, partition the provided data points {(2,3), (3,3), (4,5), (7,6),
(8,8), (9,7)} into two distinct clusters based on their spatial proximity. Iterate through the
algorithm's steps, starting with the initial random selection of cluster centroids, assigning
data points to their nearest centroid, recalculating centroids, and repeating until
convergence. Evaluate the final cluster assignments to determine how the data points are
grouped into the two identified clusters. (10 Marks)
Step 1: Initialization (2 Marks)
• Randomly initialize two cluster centroids,C1 and C2.
• Let's assume initial centroids:
• C1=(3,3)
• C2=(8,8)
Step 2: Assignment (2 Marks)
• Assign each data point to the nearest cluster centroid based on Euclidean distance.
PointNearest Centroid
(2,3) →C1
(3,3) →C1
(4,5) →C1
(7,6) →C2
(8,8) →C2
(9,7) →C1
Step 3: Update (2 Marks)
• Assign each data point to the nearest cluster centroid based on Euclidean distance.
Step 4: Repeat Assignment and Update (2 Marks)
Repeat steps 2 and 3 until convergence, ie , until the centroids no longer change significantly.
Iteration 2: (2 Marks)
Ap/CO2
7. Since the centroids didn't change, the algorithm converges.
Visualization :
Here's a visualization of the dataset and the resulting clusters after convergence:
• Cluster 1 (centroid: (3,3.67): Points (2, 3), (3, 3), (4, 5)
• Cluster 2 (centroid: (8,7): Points (7, 6), (8, 8), (9, 7)
Explanation :
• The K-means algorithm minimizes the within-cluster distance by iteratively updating the
centroids to the mean of the data points assigned to each cluster.
• The algorithm converges when the centroids no longer change significantly between
iterations.
• The resulting clusters are compact and exhibit low within-cluster distances, indicating
high similarity among the data points within each cluster.
.
19. Solve :
(i) A=(5,-2,4), B=(2,-3,5),C=(4,5,-7) are given vectors , Check whether vectors are linearly
dependent vectors (4 Marks)
(2 Marks)
(2 Marks)
Ap/CO2
8. (ii) For given set of vectors A=(3,4),B=(-4,3), Identify whether the vectors are orthogonal
vectors (3)
( 1 Mark)
( 2 Marks)
(iii) If U=(1,2,3) and ,V=(4,5,6) , find the Euclidean distance for the given vectors (3 Marks)
Solution:
( 1 Mark)
( 2 Marks)