
Recommended
More Related Content
What's hot
What's hot (20)
Similar to Cost accounting: a project on cost analysis & budgeting
Similar to Cost accounting: a project on cost analysis & budgeting (20)
Recently uploaded
Recently uploaded (20)
Cost accounting: a project on cost analysis & budgeting
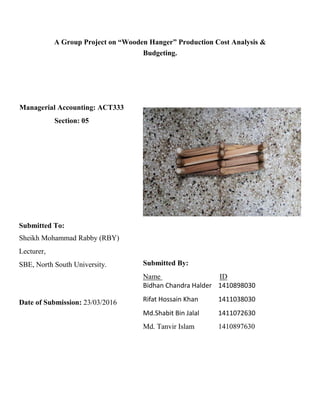
- 1. A Group Project on “Wooden Hanger” Production Cost Analysis & Budgeting. Managerial Accounting: ACT333 Section: 05 Submitted To: Sheikh Mohammad Rabby (RBY) Lecturer, SBE, North South University. Date of Submission: 23/03/2016 Submitted By: Name ID Bidhan Chandra Halder 1410898030 Rifat Hossain Khan 1411038030 Md.Shabit Bin Jalal 1411072630 Md. Tanvir Islam 1410897630
- 2. 1 Letter of Transmittal 23rd , March, 2016 Sheikh Mohammad Rabby (RBY) Lecturer, SBE, North South University Subject: Submission of Group Project on “Wooden Hanger” production cost analysis & budgeting. Dear Sir, Here, we are presenting to you the project report on “Wooden Hanger” that we manufacture. We have found out its cost, operating income, breakeven point, selling price and other required information by analyzing all the factors. It has been done according to your project guidelines. We pray and hope that you will accept and like our project. Thank you. Yours sincerely, Name ID Bidhan Chandra Halder 1410898030 Rifat Hossain Khan 1411038030 Md.Shabit Bin Jalal 1411072630 Md. Tanvir Islam 1410897630
- 3. 2 Abstract This project deals with the analysis of costs of manufacturing, pricing, budgeting. The product that we have chosen is Wooden Hanger. This product actually belongs to home decor industry. Initially, this is a too much necessary product. A unique design that more or less catch the eyes of the customer’s and will derive the intention to buy this for their purposes. In this project, we have discus estimation of all related costs like Direct & indirect materials costs, Direct & indirect labor costs, etc. Then we have categorized all the cost under direct or indirect & Fixed or variable cost categories. Using the simple costing system, we have determined the unit product cost of our product, we have also determined the prime cost, conversion cost & full cost. In addition, we have determined per unit product cost using Activity Based Costing system. Product-line profitability report is also done using simple costing & Activity Based Costing. The pricing strategy of our product is also discussed here. All types of budgets that are required are prepared in this report as well. Moreover, a budgeted income statement is discussed using both traditional and contribution margin format. We have also determined the break-even point, break-even revenue & margin of safety.
- 4. 3 Table of Contents Topic Page No. Introduction 4 Manufacturing process 4 Production capacity 5 Cost analysis 6 Prime cost, conversion cost and full cost 11 Simple costing 11 ABC costing 13 Pricing strategy 15 Budgets 16 Break-even and Margin of Safety 21 Sensitivity analysis 22
- 5. 4 Introduction We started our journey from our own experience and inspired from New-Market; where sellers sell many lifestyle products and they grabs many customers. Therefore, we came up with this idea of making wooden hanger to satisfy the customers. We want to do something out of the box and therefore we finalized this. Our company name is Wood Kingdom. This is basically a product of wood industry and it is more attractive for the customers. The product is very necessary and customers are much responsive towards buying these sorts of products. We basically want to make a product which is affordable and people will love to gain interest when they get any product with a low price. Hopefully, we would stand out because of our low prices. Our target market is to sell in Dhaka and Rajshahi. So in these cities we have many competitors. The competitors are Aarong, New-Market shops and the other shops in the local market. As they are in the business for a long time so we have to use a very different but effective strategy to stand against these competitors and established our company and product in the market. They sell this product at more than 300tk. The Manufacturing Process Collect bundle of wood and screw from shop Cut these wood into different size Process by saw and sand paper Drill those wood Adjust different wood with screw
- 6. 5 Estimations Determination of the maximum production possible in a month (Production Capacity) We have decided to work 24 days per month. We will be working for 9 hours. Each hour 1 stages (Assembling) of production, will be divided among the 4 workers. In this stage requires 4 hours of labor, therefore each individual worker shall be devoting 1 direct labor hours behind each unit. As each unit requires 1 hours to be produced. So, the number of units produced each day stands up to be 9 units. Hence our maximum production capacity will ultimately be 216 units (24days*9 units). So, Total Labor = 4 employees. Total wage hour on a day = 9 hr. Total working day on a month = 24 days. Total Labor hours needed for a product = 4 hr. Total working hours in a day = 4 employee × 9 hrs = 36 hr. Total working hours in a month = 36 × 24 = 864 hr. Total Monthly Production = 864 hr ÷ 4 hr = 216 units.
- 7. 6 Cost analysis Direct Materials Direct Materials Unit Cost Quantity (Q) Cost Source Wood (Bundle) 100 tk. 1 100 tk. Badda Timber Screw 10 tk. 1 10 tk. Hardware Shop Total 110 tk. Direct Labor Direct Labor Wage Rate Labor Hour Per Unit Total Wage Rate Labor 10 tk. 4 hrs 40 tk. Manufacturing Overhead Manufacturing Overhead Total Cost Source Depreciation of Table (4000 ÷ 60) 67 tk. Straight Line Method Depreciation of Chair (2500 ÷ 60) 42 tk. Straight Line Method Sand Paper 200 tk. ------- Utility 1,500 tk. ------- Rent 6,000 tk. ------- Transportation Cost 500 tk. ------- Total Cost 8,308 tk. ------- Fixed Assets Fixed Assets Unit cost Quantity Total cost Source Depreciation Chair 500 tk. 5 2,500 tk. RFL 4,000/60 = 67 tk. Table 2,000 tk. 2 4,000 tk. OTOBI 2500/60 = 42 tk. Total 6,500 tk.
- 8. 7 Manufacturing overhead rate = (Manufacturing overhead total cost / Total number of units) = 8,308 tk. / 216 unit = 38.46 tk. per unit Support and selling cost Cost names Cost in total units Source Marketing cost: Telephone cost 300 Airtel Leaflet Cost 300 S.R Products Packaging Cost: Carton 120 S.R Products Total cost 720 Cost Classifications The costs are classified below according to their nature: Cost Items Assignment of Cost Cost Behavior Direct Material Direct Variable Direct Labor Direct Variable Depreciation of Table Indirect Fixed Depreciation of Chair Indirect Fixed Rent Indirect Fixed Utility Indirect Fixed Transport Indirect Fixed Marketing cost Indirect Fixed Packaging cost Indirect Fixed
- 9. 8 Allocation of Support Cost We have one operating department (Production department) and three support department (telephone cost, leaflet cost and packaging cost). For this reason we are using the direct method to allocate these three costs to the Production department. Costs Support department Operating department Telephone cost Leaflet cost Packaging cost Production department Cost to be allocated 300 300 120 Allocation of telephone cost (300) 300 Allocation of leaflet cost (300) 300 Allocation of packaging cost (120) 120 Total cost allocated 0 0 0 720 Step down method Costs Support department Operating department Telephone cost Leaflet cost Packaging cost Production department Cost to be allocated 300 300 120 Allocation of telephone cost (1/3) (300) 100 100 100 Allocation of leaflet cost (1/2) (400) 200 200 Allocation of packaging cost 100% (420) 420 Total cost allocated 0 0 0 720
- 10. 9 Reciprocal method Costs Support department Operating department Telephone cost Leaflet cost Packaging cost Production department Cost to be allocated 300 300 120 1st Allocation of telephone cost (1/3) (300) 100 100 100 1st Allocation of leaflet cost (1/3) 133 (400) 133 134 1st Allocation of packaging cost (1/3) 118 118 (353) 117 2nd Allocation of telephone cost (1/3) (251) 84 84 83 2nd Allocation of leaflet cost (1/3) 67 (202) 68 68 2nd Allocation of packaging cost (1/3) 51 51 (152) 50 3rd Allocation of telephone cost (1/3) (118) 39 40 39 3rd Allocation of leaflet cost (1/3) 30 (90) 30 30 3rd Allocation of packaging cost (1/3) 23 23 (70) 24 4th Allocation of telephone cost (1/3) (53) 18 18 17 4th Allocation of leaflet cost (1/3) 14 (41) 14 13
- 11. 10 4th Allocation of packaging cost (1/3) 11 11 (32) 10 5th Allocation of telephone cost (1/3) (25) 8 8 9 5th Allocation of leaflet cost (1/3) 6 (19) 6 7 5th Allocation of packaging cost (1/3) 5 5 (14) 4 6th Allocation of telephone cost (1/3) (11) 4 4 3 6th Allocation of leaflet cost (1/3) 3 (9) 3 3 6th Allocation of packaging cost (1/3) 2 2 (7) 3 7th Allocation of telephone cost (1/3) (5) 2 2 1 7th Allocation of leaflet cost (1/3) 2 (4) 1 1 7th Allocation of packaging cost (1/3) 1 1 (3) 1 8th Allocation of telephone cost (1/3) (3) 1 1 1 8th Allocation of leaflet cost (1/3) 0 (2) 1 1 8th Allocation of packaging cost (1/3 0 1 (2) 1 9th Allocation of telephone cost (1/3) 0 (1) 0 1
- 12. 11 Prime cost, conversion cost and full cost Prime Cost= Direct Material + Direct labor = (110 tk. x 216 units) + (40 tk. x 216 units) = 32,400 tk. Conversion cost = Direct Material + Manufacturing overhead cost = (40 tk. x 216 units) + 8,309 tk. = 16,949 tk. Full cost = Variable Cost + Fixed Cost = (110tk.x 216unit) + (40tk. x 216unit) + 10,600 tk. + 8,309 tk. = 51309 tk. Simple Costing Total no. of employees = 4 employees Hours needed per unit = 1 hrs. Direct labor hours/unit (1hrs x 4 employees) = 4hrs Total Direct labor Hours (216 units x 4hrs) = 864 labor hours MOH allocation (8308 total MOH cost / 864 labor hours) = 9.62 tk. per total direct labor hour
- 13. 12 Profitability Report Revenues (195 units x 250 tk) 48,750 Less: Cost of goods sold Opening inventory finished goods 0 Direct Material (110 tk × 216 unit) 23,760 Direct Labor (40 tk total wage rate x 216 units) 8,640 Manufacturing Overhead Cost ( 9.62 tk per unit Manufacturing overate rate x 216 unit ) 2,077 Less: Closing Inventory Finished Goods (21 unit x 160 tk) (3,360) Total cost of goods sold (31,117) Gross profit 17,633 Less: Selling expenses Marketing costs ( Telephone cost + leaflet cost) (600) Packaging cost (120) Operating income 16,913
- 14. 13 Activity Based Costing We chose appropriate cost drivers for the items under manufacturing overhead and support costs in and the explanations are given below: Activity Cost Driver Explanation Depreciation of Table No. of Units Sold The higher the amount of direct material used, the more often a table is needed. Depreciation of Chair No. of Units Sold Utility of the chairs is proportional to the number of units sold. Sand Paper No. of Units Produced The more numbers of unit produced, the more need of a sand paper is needed. Rent Floor Area in sq. ft Depending on the area of the production facility being used, the rent of the workplace will vary. Utility No. of Units Produced Depending on the number of units produced, consumption of electricity, water and etc. will vary. Transport Cost No. of Delivery The transport cost will occur only on the number of times workers travel to go for the delivery. Marketing Cost No. of Units Sold Marketing cost is determined on the basis of the no. of Units Sold. Packaging Cost No. of Units Sold The number of carton will depend on the number of units sold.
- 15. 14 Manufacturing Overhead allocation Activity Total Budgeted Cost Cost Driver Units of Cost Driver Activity Rate Depreciation of Table 67 No. of Unit 216 0.31 Depreciation of Chair 42 No. of Units sold 195 0.21 Sand Paper 200 No. of Unit 216 0.93 Rent 6,000 Floor area in s.ft 400 15.00 Utility 1,500 No. of Units produced 216 6.94 Transport cost 500 No. of delivery 10 50.00 Marketing cost 600 No. of Units sold 195 3.08 Packaging cost 120 No. of Units sold 195 0.62 Profitability report (ABC costing) Revenues (195 units x 250 tk) 48,750.00 Less: Cost of goods sold Opening inventory finished goods 0.00 Direct Material (110 tk × 216 unit) 23,760.00 Direct Labor (40 tk total wage rate x 216 units) 8,640.00 Less: Manufacturing Overhead: Sand Paper 200 Rent 6,000 Utility 1,500 Transport 500 Depreciation of Table 67 Depreciation of Chair 42
- 16. 15 Less : Closing inventory of finished goods (3360) Total Cost of goods sold (37,348) Gross Profit 11,402 Less: selling expense Marketing cost (600) Packaging cost (120) Operating income 10,682 Pricing strategy We are using cost based pricing and determine and select the strategy based on some factors: Customers demand for the product, Competitors prices and Cost of the product. We priced our product according to market demands and it can fluctuate based on market conditions. Currently, the selling price of our product is 250 taka as competitors are charging more than 300 taka for this. Our competitors are Aarong, New-Market shops and the other shops in the local market. So we want to keep that price lower to be competitive in the market and for that we have to maintain lower price from competitors to attract more customers and gain more profits by selling large amount of hangers to customers.
- 17. 16 Budgets Schedule 1: Revenue budget Product name Units to be sold Selling price per unit Total revenue Wooden Hanger 195 250 48,750 Schedule 2: Production Budget Wooden Hanger Budgeted units to be produce 216 Add: Target ending inventory of finished goods(10% sales) 22 Total required units 238 Less: Beginning finished goods inventory 0 Units of finished goods to be produced 238 Schedule 3A: Direct materials usage budget Materials Wood Screw Total Physical units budget: Direct material requirement Wood (216 units x 1 bundle) 216 Screw (216 unit x 1 bundle) 216 Total quantity of direct material to be produced 216 216
- 18. 17 Cost Budget: BDT BDT Available from beginning direct material inventory Wood 0 Screw 0 To be purchased and used this period: Wood 21,600 Screw 2,160 Direct materials to be used to this period 21,600 2,160 23,760 Schedule 3B: Direct materials purchase budget Physical units budget: Wood Screw To be used in production from schedule 3A 216 216 Add: Target ending inventory (15% of direct materials to be used) 32 32 Total requirement 248 248 Less: Beginning inventory direct materials 0 0 Purchase to be made 248 248
- 19. 18 Cost budget: BDT BDT Wood (248 unit x 100 tk.) 24,800 Screw (248 unit x 10 tk.) 2480 Direct materials to be purchased 24,800 2,480 Schedule 4: Direct labor budget Product Name Output units to be produced (Schedule 2) Direct manufacturing labor hours per unit Total hours Hourly wage rate Total Wooden Hanger 238 4 950 10 9,504 Total labor cost needed to be produced 216 units = 9,504 tk x 216 unit = 2,052,864 tk. Schedule 5: Manufacturing overhead budget Manufacturing overhead Budget Fixed manufacturing overhead Costs (BDT) Depreciation of Table 67 Depreciation of Chair 42 Rent 6000 Utility 1500 Transportation cost 500 Sand paper 200 Total manufacturing overhead cost 8309
- 20. 19 Units of input Cost per Unit of input (BDT) Total cost Direct material: Wood 1 bundle 100 tk. 100 Screw 1 bundle 10 tk. 10 Direct labor 4 hr/ DLHS 10tk. 40 Manufacturing Overhead (8309/216) 38 Total manufacturing cost per unit 188 Schedule 6: Ending inventory budget Quantity Cost per unit Total cost Direct Materials Wood 32 100 3,240 Screw 32 10 324 Finished goods 22 188 4,071 Total ending inventory 7,635 Schedule 7 : Cost of goods sold budget Beginning Finished inventory 0 Add: Cost of goods manufactured Direct materials used 3A 23,760 Direct manufacturing labor 4 9,504 Manufacturing overhead 5 8309 Cost of goods available for sale 41,573 Less: Ending finished goods inventory 4,071 Cost of goods sold 37,502
- 21. 20 Preparing a budgeted income statement in both traditional and contribution format: Schedule 8: Budgeted Income statement (Traditional Format) Per unit (BDT) Total (BDT) Revenue 250 48,750 (-) Cost of goods sold (188) (37,502) Gross profit 62 11,248 (-) Operating Cost Marketing cost (3) (600) Packaging cost (0.56) (120) Net Income 58.20 10,528 Schedule 9: Budgeted income statement (Contribution format) Per unit (BDT) Total (BDT) Revenue 250 48,750 Less: Variable cost Direct material (121) (23,760) Direct labor (48.62) (9,504) Packaging cost (0.62) (120) Contribution margin 78.92 15,366 Less: Fixed costs Marketing cost (600) Manufacturing overhead cost (8309) Net operating income 6,457
- 22. 21 Break Even and Margin of safety Break-even point = Fixed cost/ CM per unit = (600 + 8,309) tk. / 78.92 tk. per unit = 112 unit CM ratio = CM per unit/ Selling price = 78.92 tk. per unit / 250 tk. = 31.58% Break even revenue = Fixed cost/ CM ratio = 8,909 tk. / .3158 = 28,211 tk. Margin of safety units = Budgeted sales -Break even sales = 216 unit - 112 unit = 104 unit Margin of safety (%) =Margin of safety in tk. / budgeted revenue = 28,211 tk. / 48,750 tk. = 57.87%
- 23. 22 Sensitivity analysis Key Assumptions What if Scenario Units Sold Selling Price Direct Material Cost Budgeted Operating Income Master Budget 195 250 tk. 110 tk. 6,457 tk Scenario - 1 195 250 tk. 123 tk. 6,232 tk 12% Increase in the price of direct materials Scenario - 2 176 250 tk. 110 tk. 1,707 tk. 10% decrease in demand of the product Scenario - 3 224 250 tk. 110 tk. 13,707 tk. 15% Increase in demand of the product