Download to read offline
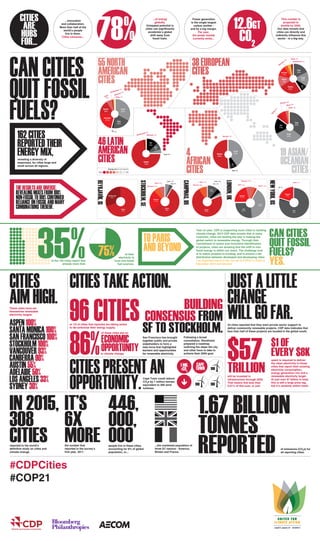

308 cities from around the world reported their emissions and energy mix to CDP's climate change study. These cities are home to over 446 million people, accounting for 6% of the global population. The data reveals diverse energy mixes among cities, from some relying 100% on non-fossil fuels to others relying 100% on fossil fuels. Many cities see opportunities to transition to renewable energy and have set targets to increase their share of electricity from non-fossil fuel sources. Cities can significantly influence the energy sector and accelerate the global shift away from fossil fuels through innovation and collaboration.


![Planning for low carbon development in cities [compatibility mode]](https://cdn.slidesharecdn.com/ss_thumbnails/planningforlowcarbondevelopmentincitiescompatibilitymode-141227114250-conversion-gate01-thumbnail.jpg?width=640&height=640&fit=bounds)


