Download to read offline


![124
RENEWABLE POWER GENERATION COSTS
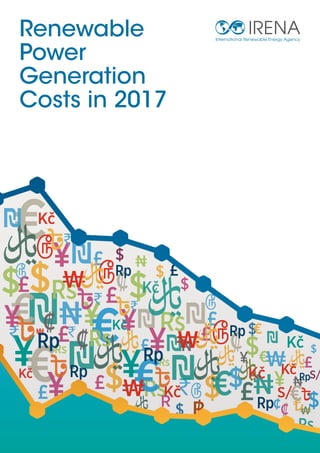
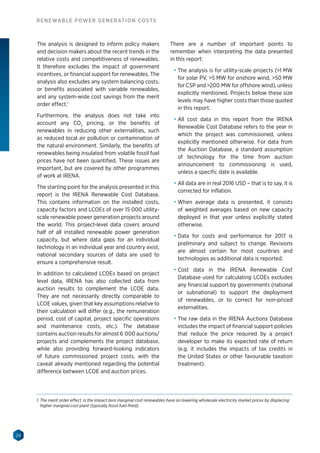
other ancillary grid services. The latter strategy
would involve higher installed costs and lower
capacity factors, but where the electricity system
needs these services, hydropower can often be
the cheapest and most effective solution to these
needs.
Deciding which strategy to pursue for any given
hydropower scheme is highly dependent on the
local market, the structure of the power generation
pool, grid capacity and constraints, the value of
providing water management and grid services,
etc. Perhaps more than with any other renewable
energy, the true economics of a given hydropower
scheme are driven by these factors, not just by
the number of kWhs generated relative to the
investment. The value of peak generation and
the provision of ancillary grid services can thus
have a significant impact on the economics of a
hydropower project.5
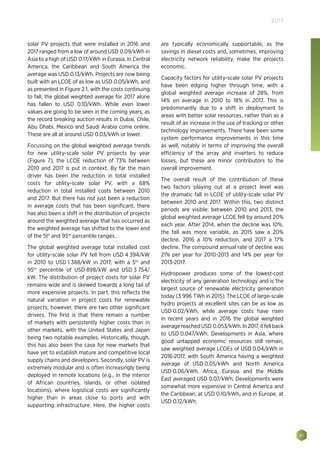
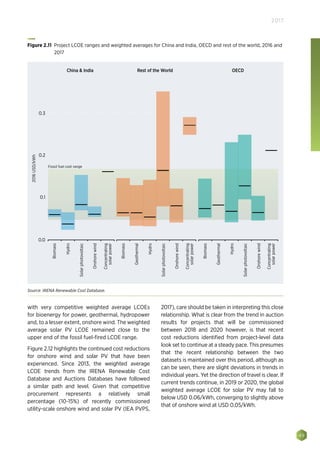
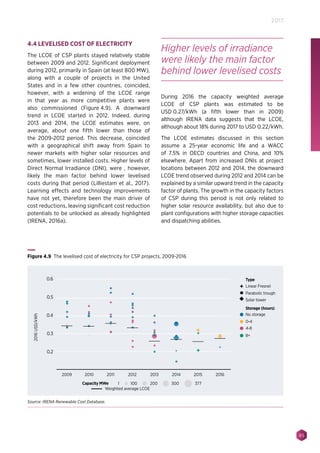
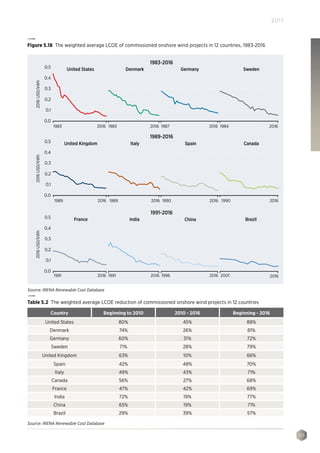
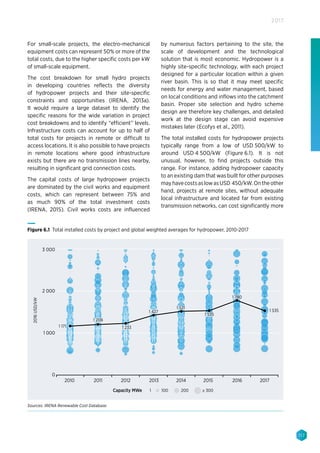
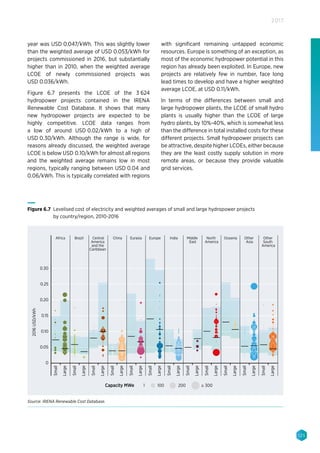
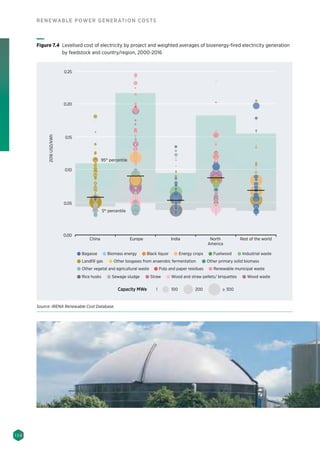
The weighted average country/regional LCOE
of all projects, large and small, in the IRENA
Renewable Cost Database ranged from a low of
USD 0.04/kWh in Brazil for all of the projects in
the IRENA Renewable Cost Database to a high of
USD 0.11/kWh in Europe. Focusing in on the global
weighted average LCOE trend by year, in 2017,
the global weighted average cost of electricity
from hydropower projects commissioned in that
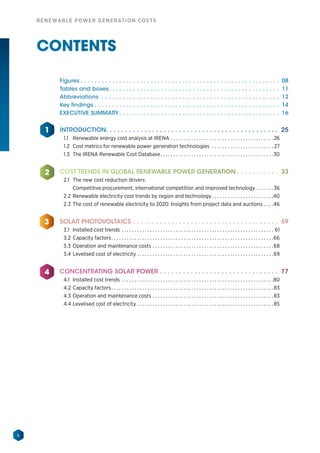
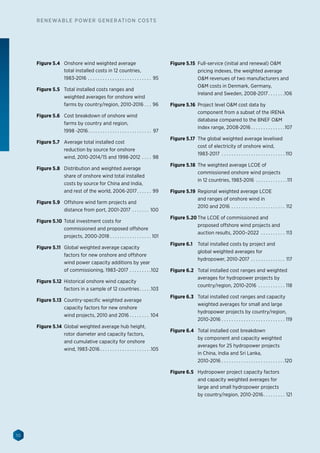
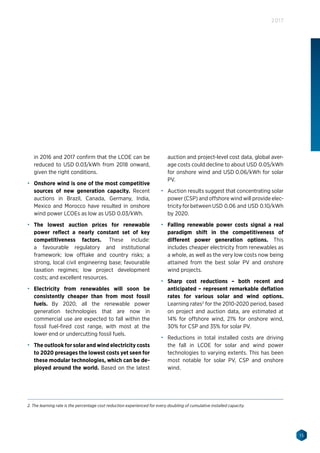
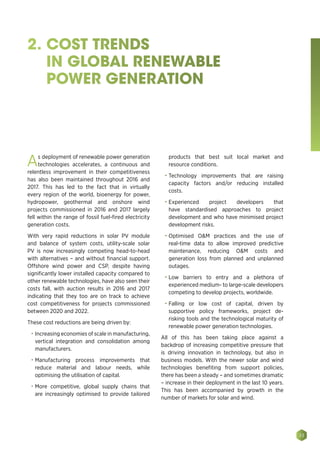
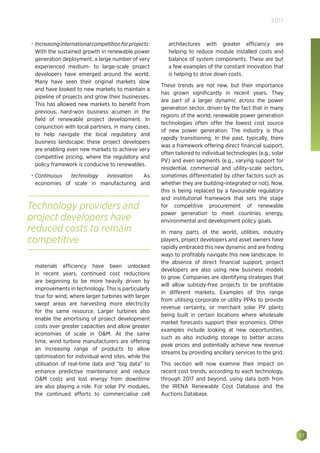
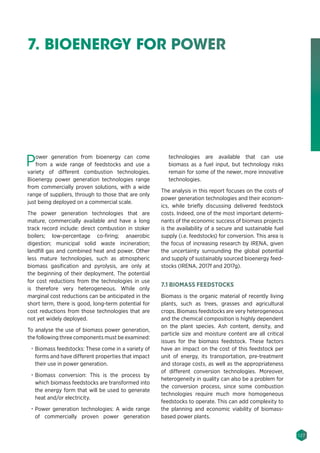
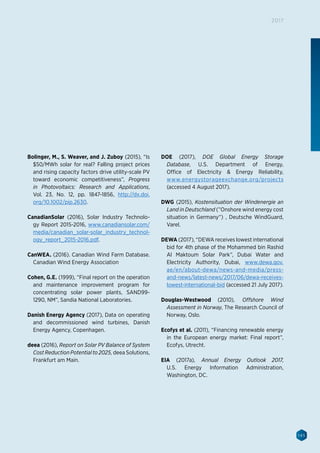
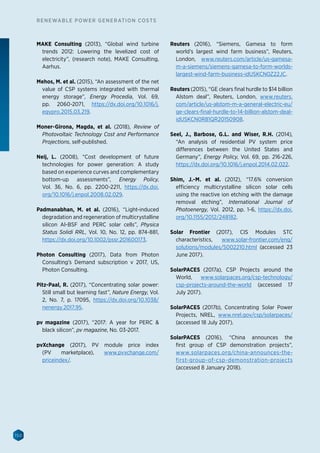
Energy storage is becoming an increasingly flexible and cost-effective tool for grid operators to help manage
instability on their networks. This is especially so, given with the growing amount of variable renewable energy
generation being deployed in major markets worldwide, such as that from solar PV and wind.
Energy storage has gained prominence in recent years, and plays a key role in the design of modern electricity
grids. According to the Global Energy Storage Database [DOE, 2017], the rated power of operational stationary
energy storage reached a total of more than 170 GW, globally, by October 2016. More than 96% was provided by
pumped hydro storage, followed by thermal storage (1.9%), electro-chemical batteries (1.0%) and electro-mechan-
ical storage (0.9%). Three quarters of all energy storage was installed in the top 10 countries, led by China (18.8 %),
Japan (16.7 %) and the United States (14.1 %).
Pumped hydro storage is a well-understood and proven technology, with decades of operating experience. Due to
this maturity, only slight improvements in cost structure or transformation efficiency can be expected in the next
few years. There are, however, many new ideas on how to expand worldwide pumped hydro storage capacities.
These include the use of wind turbine structures as upper reservoirs [GE Reports, 2016], existing underground for-
mations such as abandoned mines [ESA, n.d. – a], or added weight through rock formations [Heindl Energy, 2016].
These approaches may offer lower-cost pumped hydro storage and/or greatly expand their potential, but given
the early stage of development of these approaches significant uncertainty remains as to their likely deployment.
Another type of unconventional Pumped Hydroelectric Storage (PHS) that has already been commercialised in a
mid-sized storage asset is seawater storage [Fujihara, 1998]. This type of PHS utilises the sea as the lower water res-
ervoir, instead of an artificial lake. These storage systems promise to offer comparably lower installation costs due
to their single reservoir construction. Yet, the maintenance costs of these storage systems are significantly higher,
due to the highly corrosive salt water environment and marine growth on hydraulic structures [ESA, n.d. – b], and
suitable geological structures next to seas or lakes are not always available.
Promising developments in other energy storage technologies may one day challenge pumped hdyro storage's
near monopoly on low-cost electricity storage (IRENA, 2017c), but for now, pumped hydro is still the only technol-
ogy offering economically viable large-scale storage. The importance of pumped hydro storage, and indeed reser-
voir hydropower, is likely to grow over time as the shift to a truly sustainable electricity sector accelerates, not just
for the low-cost storage it provides, but for the flexibility it brings to integrate high levels of variable renewables
at minimal cost.
Box 4 Pumped hydro storage
5. This is without considering the other services being provided by the dam (e.g. flood control) that are not typically remunerated, but are
an integral part of a project’s purpose.](https://image.slidesharecdn.com/irena2017powercosts2018-180117142133/85/Irena-2017-power_costs_2018-124-320.jpg)


![144
RENEWABLE POWER GENERATION COSTS
REFERENCES
Adam, A., Josephson, P.-E. B. and Lindahl, G.
(2017), ‘Aggregation of factors causing cost
overruns and time delays in large public
construction projects: Trends and implications’,
Engineering, Construction and Architectural
Management, vol. 24, no. 3, pp. 393–406
[Online]. DOI: 10.1108/ECAM-09-2015 (Accessed
8 January 2018).
Argus Biomass Markets (2014), “Weekly Biomass
Markets News and Analysis”, Argus, No. 14-30.
Bernreuter Research (2017), “Silicon consumption
to drop to 3.6 grams per watt by 2020”, www.
bernreuter.com/en/news/press-releases/
polysilicon-consumption-for-solar-cells.html
(accessed 4 July 2017).
Blanco, M.I. (2009), “The economics of wind
energy”, Renewable and Sustainable Energy
Reviews, Vol. 13, No. 6-7, Elsevier, pp. 1372-1382.
BNEF (2017a), 2H 2017 Wind Turbine Price Index,
Bloomberg New Energy Finance, London.
BNEF (2017b), 3Q 2017 Wind Turbine Contract
Order Dataset, Bloomberg New Energy Finance,
London.
BNEF (2017c), Vestas reclaims top spot in annual
ranking of wind turbine makers, Bloomberg New
Energy Finance, London. https://about.bnef.
com/blog/vestas-reclaims-top-spot-annual-
ranking-wind-turbine-makers/
BNEF (2017d), H2 2016 Wind OM Index Report,
Bloomberg New Energy Finance, London.
Bolinger, M., J. Seel, and K.H. LaCommare (2017),
Utility-Scale Solar 2016: An Empirical Analysis of
Project Cost, Performance, and Pricing Trends in
the United States, Lawrence Berkeley National
Laboratory (LBNL), https://utilityscalesolar.lbl.
gov/.
Bolinger, M. and J. Seel (2016), Utility-Scale Solar
2015: An Empirical Analysis of Project Cost,
Performance, and Pricing Trends in the United
States, Lawrence Berkeley National Laboratory
(LBNL), https://emp.lbl.gov/publications/utility-
scale-solar-2015-empirical.
Bolinger, M. and J. Seel (2015), Utility-Scale Solar
2014: An Empirical Analysis of Project Cost,
Performance, and Pricing Trends in the United
States, Lawrence Berkeley National Laboratory
(LBNL), https://emp.lbl.gov/publications/utility-
scale-solar-2015-empirical.
Bolinger, M. and S. Weaver (2014), Utility-Scale
Solar 2013: An Empirical Analysis of Project Cost,
Performance, and Pricing Trends in the United
States, Lawrence Berkeley National Laboratory
(LBNL), https://emp.lbl.gov/publications/utility-
scale-solar-2013-empirical.](https://image.slidesharecdn.com/irena2017powercosts2018-180117142133/85/Irena-2017-power_costs_2018-144-320.jpg)
![146
RENEWABLE POWER GENERATION COSTS
EIA (2017b), Form EIA-923 detailed data,
U.S. Energy Information Administration,
www.eia.gov/electricity/data/eia923/.
Energy Storage Association (n.d. – a), Sub-
Surface Pumped Hydroelectric Storage,
http://energystorage.org/energy-storage/
t e c h n o l o g i e s /s u b - s u r f a c e - p u m p e d -
hydroelectric-storage (accessed 8 January
2018).
Energy Storage Association (n.d. – b), Surface
Reservoir Pumped Hydroelectric Storage,
http://energystorage.org/energy-storage/
technologies/surface-reservoir-pumped-
hydroelectric-storage, (accessed 8 January
2018).
EnergyTrend (2017), “Multi-Si to challenge Mono-
Si’s market share as black silicon technology
matures”, http://pv.energytrend.com/news/
Multi_Si_to_Challenge_Mono_Sis_Market_
Share_as_Black_Silicon_Technology_Matures.
html (accessed 3 July 2017).
EREC (European Renewable Energy Council) and
Greenpeace (2010), Energy [R]evolution, EREC/
Greenpeace, Brussels.
EWEA (2012), Wind in Power: 2011 European
Statistics, European Wind Energy Association,
Brussels.
EWEA (2009), The Economics of Wind Energy,
European Wind Energy Association, Brussels.
Exawatt (2017), Personal communication with S.
Price, 12 December 2017.
Fichtner (2010), “Technology assessment of
CSP technologies for a site-specific project in
South Africa: Final report”, The World Bank and
ESMAP, Washington, DC.
Fiorelli, J. and M. Zuercher-Martinson (2013),
“How oversizing your array-to-inverter ratio
can improve solar-power system performance”,
Solar Power World, Vol. 7, pp. 42-48.
First Solar (2017) “First Solar investor overview,
June 2017”, http://files.shareholder.com/
downloads/FSLR/4693351233x0x947312/38
0F6F6B-A645-456C-8FBF-FC2582FFA057/
First_Solar_Investor_Overview_June_2017.pdf
(accessed 23 June 2017).
Fraunhofer ISE (2017), “Photovoltaics report”,
Fraunhofer Institute for Solar Energy Systems
ISE, Freiburg, www.ise.fraunhofer.de/content/
dam/ise/de/documents/publications/studies/
Photovoltaics-Report.pdf (accessed 8 January
2018).
Fraunhofer ISE (2016), “Photovoltaics report”,
Fraunhofer Institute for Solar Energy Systems
ISE, Freiburg, www.ise.fraunhofer.de/content/
dam/ise/de/documents/publications/studies/
Photovoltaics-Report.pdf.
FraunhoferISE (2013), “Levelized cost of electricity
renewable energy technologies”, www.ise.
fraunhofer.de/content/dam/ise/en/documents/
publications/studies/Fraunhofer-ISE_LCOE_
Renewable_Energy_technologies.pdf (accessed
19 July 2017).
Friedman, B., R. Margolis and J. Seel (2014),
“Comparing Photovoltaic (PV) Costs and
Deployment Drivers in the Japanese and US
Residential and Commercial Markets”, NREL,
Golden, Colorado.
Fu, R. et al. (2015), Economic Competitiveness of
US Utility-Scale Photovoltaics Systems in 2015:
Regional Cost Modeling of Installed Cost ($/W)
and LCOE. ($/kWh), Photovoltaic Specialist
Conference (PVSC), 2015 IEEE 42nd, New
Orleans.](https://image.slidesharecdn.com/irena2017powercosts2018-180117142133/85/Irena-2017-power_costs_2018-146-320.jpg)


The document discusses the significant decline in renewable power generation costs as of 2017, highlighting major cost reductions in solar photovoltaic and wind energy technologies. It emphasizes that these technologies are increasingly economically viable and competitive with fossil fuels, particularly in light of technological advancements and improved procurement processes. The International Renewable Energy Agency (IRENA) supports this transition by providing comprehensive cost data, aiding policymakers and investors in making informed decisions about renewable energy deployment.


