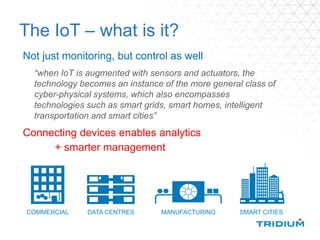
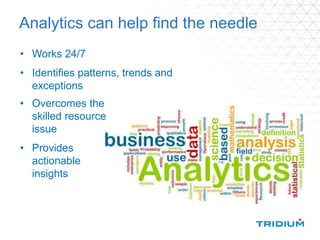
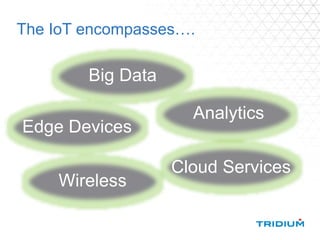
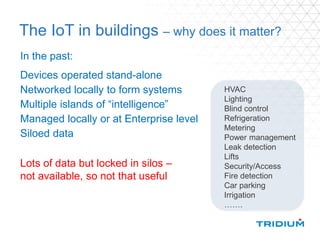
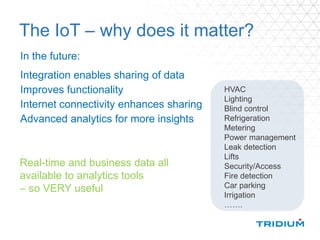
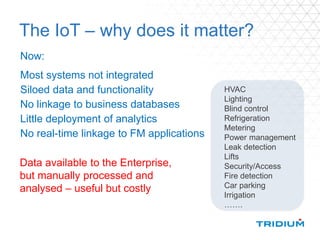
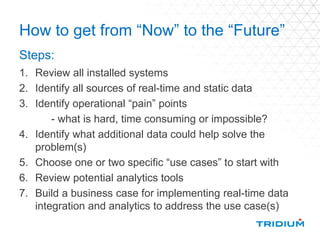
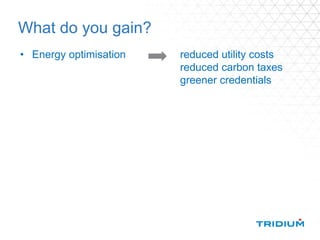
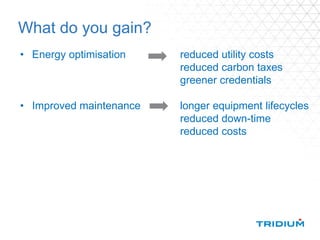
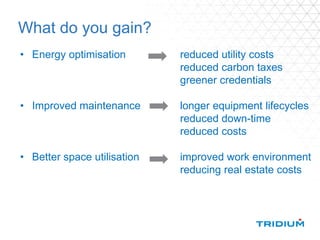
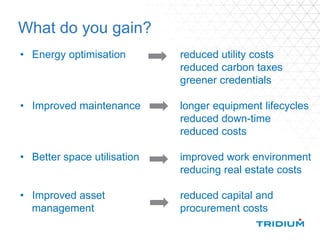
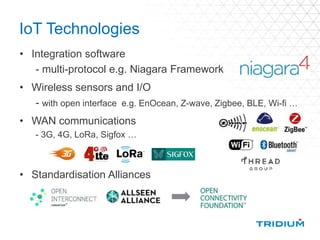
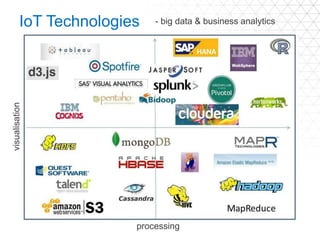
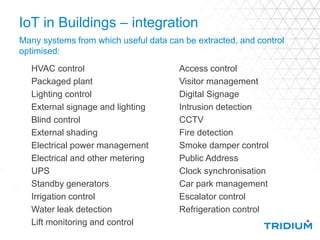
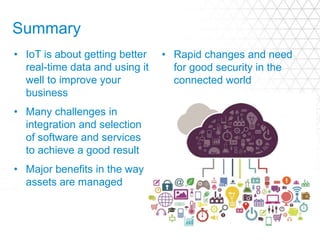
De-mystifying the IoT
Chris Irwin April 2016
The IOT – what is it?
The “Internet of Things”
– term first used by Kevin Ashton in 1999
“is the network of physical objects—devices, vehicles, buildings and
other items—embedded with electronics, software, sensors, and
network connectivity that enables these objects to collect and
exchange data”
- Wikipedia
The IoT – what is it?
Not just monitoring, but control as well
Connecting devices enables analytics
+ smarter management
COMMERCIAL DATA CENTRES MANUFACTURING SMART CITIES
“when IoT is augmented with sensors and actuators, the
technology becomes an instance of the more general class of
cyber-physical systems, which also encompasses
technologies such as smart grids, smart homes, intelligent
transportation and smart cities”
Connecting “things” results in LOTS of data
There are lots of other sources of data to combine
The IoT and Big Data
Finding what you need can be difficult …
… so we need Analytics – 24/7
Analytics can help find the needle
• Works 24/7
• Identifies patterns, trends and
exceptions
• Overcomes the
skilled resource
issue
• Provides
actionable
insights
The IoT encompasses….
Cloud Services
Analytics
Big Data
Wireless
Edge Devices
The IoT in buildings – why does it matter?
In the past:
Devices operated stand-alone
Networked locally to form systems
Multiple islands of “intelligence”
Managed locally or at Enterprise level
Siloed data
HVAC
Lighting
Blind control
Refrigeration
Metering
Power management
Leak detection
Lifts
Security/Access
Fire detection
Car parking
Irrigation
…….
Lots of data but locked in silos –
not available, so not that useful
The IoT – why does it matter?
In the future:
Integration enables sharing of data
Improves functionality
Internet connectivity enhances sharing
Advanced analytics for more insights
HVAC
Lighting
Blind control
Refrigeration
Metering
Power management
Leak detection
Lifts
Security/Access
Fire detection
Car parking
Irrigation
…….
Real-time and business data all
available to analytics tools
– so VERY useful
The IoT – why does it matter?
Now:
Most systems not integrated
Siloed data and functionality
No linkage to business databases
Little deployment of analytics
No real-time linkage to FM applications
HVAC
Lighting
Blind control
Refrigeration
Metering
Power management
Leak detection
Lifts
Security/Access
Fire detection
Car parking
Irrigation
…….
Data available to the Enterprise,
but manually processed and
analysed – useful but costly
How to get from “Now” to the “Future”
1. Review all installed systems
2. Identify all sources of real-time and static data
3. Identify operational “pain” points
- what is hard, time consuming or impossible?
4. Identify what additional data could help solve the
problem(s)
5. Choose one or two specific “use cases” to start with
6. Review potential analytics tools
7. Build a business case for implementing real-time data
integration and analytics to address the use case(s)
Steps:
What do you gain?
• Energy optimisation reduced utility costs
reduced carbon taxes
greener credentials
What do you gain?
• Energy optimisation reduced utility costs
reduced carbon taxes
greener credentials
• Improved maintenance longer equipment lifecycles
reduced down-time
reduced costs
What do you gain?
• Energy optimisation reduced utility costs
reduced carbon taxes
greener credentials
• Improved maintenance longer equipment lifecycles
reduced down-time
reduced costs
• Better space utilisation improved work environment
reducing real estate costs
What do you gain?
• Energy optimisation reduced utility costs
reduced carbon taxes
greener credentials
• Improved maintenance longer equipment lifecycles
reduced down-time
reduced costs
• Better space utilisation improved work environment
reducing real estate costs
• Improved asset reduced capital and
management procurement costs
Energy Management &
Analytics
Energy Management Applications
… and many more
Energy Management Applications
• Energy analysis
• Energy reporting
• Carbon reporting
• Tariff analysis
• Bill validation
• Tenant/departmental billing
• Forecasting
• Energy dashboards
• Energy analytics
Business Analytics Applications
…and many more
Building Analytics Applications
Real-time automated 24/7 fault diagnostics and energy
optimisaton
analytics
Analytics vs Alarms
Alarms
• Have to set-up thresholds
and alarm definitions in
advance
• No intelligence; operator
has to interpret
Analytics
• Enables you to find
patterns and exceptions
• Can configure rules to
make “smart alarms”
• Provides results that
show how building is
REALLY operating
Analytics vs Alarms - example
An alarm only evaluates
a single item against a
pre-set limit at a single
point in time
e.g. an alarm can tell you if
energy use is above a
specific KW limit right now
Analytics can tell you:
how many hours in the last 6
months the electrical demand
target was exceeded
how long each of those periods
were when they occurred
what items of equipment were
operating
when the demand went above the
limit
how those events were related to
the weather or building usage
patterns
Analytics vs Graphs
Graphs
• Require a skilled engineer
to interpret and decide on
actions
• Only able to identify
problems when graph is
being viewed
Analytics
• Sophisticated analysis rules
can be configured once and
applied 24/7
• Corrective actions can be
implemented automatically
Facilities & Asset
Management
FM Applications
Acronyms:
FMCS - Facilities management Control System
CMMS - Computerised Maintenance Management
System
CAFM - Computer Aided Facilities Management
EAM - Enterprise Asset Management
FM Applications
… and many more
Predictive Maintenance applications
Key features:
Business
Intelligence
Real-time
capabilities
Quick and Accurate
Decisioning
Big Data, Predictive and
Advanced Analytics
Open Architecture
Accelerated
Time-to-Value
Example: IBM’s PMQ software
Rethink and Reinvent Business services,
processes and relationships…
Courtesy of
Speeding service
delivery from 45 days to
20 minutes
Recognising & repairing
over 50% of issues before
operations impact
Increasing sales with
new promotions from
15% to 75%
Reducing the time it
takes to backup critical
data by 80%
Optimise
with Cloud
Deploy Smarter
Physical Infrastructure
Extend to
Mobile Devices
Protect &
Manage Data
Enterprise Asset Management - Maturity Model
Courtesy of
Enterprise Asset Management – Maturity Model
• Mostly reactive
work, no planning
• Highly centralised
workforce
• Little or no systems
in place
• Focus is on cost,
primarily supply
chain
• Little cross team
collaboration
• Little performance
measures in place
• PM program,
some planning
• Partially
centralised
• System in place,
scheduling
• Some storeroom
controls, lack
measurements
• Some teamwork
in place
• Maintenance cost
records available
• Long term
planning in place
• Some level of
multi-skilled staff
• EAM linked to
financials / SC
• Strategic
sourcing /
computerised
• Self directed
collaborative
• Metrics in place,
reliability and
cost
• Asset portfolio
strategy
• Independent
trades, multi-skill
• Open standards
based integration
• SLAs, vendor
performance
indicators
• Business focus,
high collaboration
• Benchmarking,
strong detail on
reliability / cost
EAM is
Cost Focused
EAM is
An Investment
Courtesy of
Extend useful
life of capital
assets and
manage aging
infrastructure
and
workforce
Supply Chain
Management
Manage the
indirect MRO
supply chain
for asset
intensive
industry
coverage area
Health, Safety and
Environment
Reduce risk
and meet
compliance
Service Management
Improve
Quality of
Service
Maximo Asset Management Capabilities
• Work
Management
• Corrective,
Preventive
Maintenance
• Condition Based
Maintenance
• GIS/Mapping
• Analytics &
reporting
• Planning &
scheduling
• Workflow driven
Best Practices
• Knowledge
Capture
Asset Management
• Incident Management
• Risk Assessment
• Regulatory Compliance
• Non-Conformance mgmt
• Management of Change
• Inventory Management
• Contract Management
• Procurement
• Spare Parts Management
• Service Desk
• Competency & Skills
Management
• Payment & Billing
• SLAs
• Contracted Service
Courtesy of
Benefits from implementing an EAM application
Business Scenarios
Key ROI
Data Points
Customer Examples
Labour Utilisation Up 10-20%
• A major US Pipeline company saved US £3M by
better tracking labor to specific work
Asset Availability Up 3-5%
• A large refinery reduced unplanned downtime,
estimated £300M annual revenue improvement
Equipment purchases Down 3-5%
• A upstream company saved US £8M by improving
supply chain management during construction
Warranty recoveries Up 10-50%
• An upstream production company with a medium
size fleet increased warranty recovery 50%
Inventory needs Down 20-30%
• A chemical company was able to identify US £12M
in excess or obsolete inventory
Inventory carrying costs Down 5-20%
• A petrochemical company reduced saved US £1.2M
impacting financing, insurance, handling,
overhead, etc.
Material Costs Reduced 10-50%
• A refining company reduced costs 20% by
optimising material purchases
Purchasing Costs Reduced 10-50%
• A large integrated NOC company reduced
purchasing costs by over 50%
Courtesy of
IOT technologies
IoT Technologies
• Integration software
- multi-protocol e.g. Niagara Framework
• Wireless sensors and I/O
- with open interface e.g. EnOcean, Z-wave, Zigbee, BLE, Wi-fi …
• WAN communications
- 3G, 4G, LoRa, Sigfox …
• Standardisation Alliances
IoT Technologies - big data & business analytics
visualisation
processing
IoT in Buildings – integration
Many systems from which useful data can be extracted, and control
optimised:
Access control
Visitor management
Digital Signage
Intrusion detection
CCTV
Fire detection
Smoke damper control
Public Address
Clock synchronisation
Car park management
Escalator control
Refrigeration control
HVAC control
Packaged plant
Lighting control
External signage and lighting
Blind control
External shading
Electrical power management
Electrical and other metering
UPS
Standby generators
Irrigation control
Water leak detection
Lift monitoring and control
Many protocols required to achieve integration
• Bacnet IP
• Bacnet MSTP
• Modbus IP
• Modbus RTU
• KNX
• LON
• EnOcean
• DALI
• SNMP
• oBIX
• SQL
• + many more
Open protocols make system integration MUCH easier, but there are
also many proprietary protocols…..
Open protocols used in buildings:
N to N
Lots of Connections, Complexity and Cost
Creates a Barrier to Deployment of Solutions
Niagara Framework solves integration problem
N to 1
Information representation is
normalised
The IoT adds more…
• New protocols
• New sensor types
- air quality, traffic flow, people movement etc.
• New interactions
- smartphone apps, iBeacons etc.
• New priorities
- well-being, environmental concerns, home working,
cyber security ….
Cyber security is a priority
Security of any facilities management system
depends on:
Built-in capabilities
(software supplier)
Configuration
(Integrators and administrators)
Security of surrounding network
(IT departments)
“Secure by Default” principle
1. Make security easier: default to the most secure configurations
• All transmissions encrypted
• Users forced to have strong password strengths
• Users set up with the strongest authentication mechanism
• User lockouts upon consecutive bad log-ins
2. Force administrators to do the right thing
• Factory default password must be changed after commissioning
3. Do the right thing, regardless of configuration
• Encrypt sensitive information at rest
• Digitally Signed Code: validated at run-time
• Secure Boot: trusted software validated at boot-time
4. Provide stronger configuration options based on best practices
• Articles, documentation, webinars to provide detailed guidance
Software vendors can provide strong security capabilities – but it is
important for partners and customers to configure and manage the
software correctly!
Best practices:
• Use latest products with the best security capabilities
• It is important to update older products
• Do not expose connected devices to the Internet
• Most secure posture is for BMS/facilities management software to be managed
in an isolated, internal network
• If remote access is needed, use a VPN solution
• Important: Use a defense-in-depth network security strategy
• Further enhance protection to BMS/FM s/w and other systems with Intrusion
Detection Systems (IDS), firewalls and other network security solutions
• Isolate control systems from other internal networks
• Follow best practice guides for configuration
• Refer to resources on next page
• Keep up with technical bulletins, patches
• The most secure system has the latest security patches
Summary
• IoT is about getting better
real-time data and using it
well to improve your
business
• Many challenges in
integration and selection
of software and services
to achieve a good result
• Major benefits in the way
assets are managed
• Rapid changes and need
for good security in the
connected world
Any questions?
Best practices: resources
• Technical bulletins
http://www.tridium.com/en/resources/library
• TridiumTalks: presentations and recordings
http://www.tridium.com/en/resources/events
• “Cyber security: Why it matters”
• “Best practices for securing Niagara”
• White papers
http://www.tridium.com/en/resources/library
• Niagara AX Hardening Guide
• Using a VPN with Niagara
• Niagara 4 documentation
• Station Security Guide (ships with Niagara 4)
• LinkedIn articles
• "Cyber security begins, but does not end
with security controls on your digital assets”
• “Securing the IOT – 10 Best practices for securing Niagara devices”

Demystifying internet of things

  • 1.
  • 2.
    The IOT –what is it? The “Internet of Things” – term first used by Kevin Ashton in 1999 “is the network of physical objects—devices, vehicles, buildings and other items—embedded with electronics, software, sensors, and network connectivity that enables these objects to collect and exchange data” - Wikipedia
  • 3.
    The IoT –what is it? Not just monitoring, but control as well Connecting devices enables analytics + smarter management COMMERCIAL DATA CENTRES MANUFACTURING SMART CITIES “when IoT is augmented with sensors and actuators, the technology becomes an instance of the more general class of cyber-physical systems, which also encompasses technologies such as smart grids, smart homes, intelligent transportation and smart cities”
  • 4.
  • 5.
    There are lotsof other sources of data to combine The IoT and Big Data
  • 6.
    Finding what youneed can be difficult … … so we need Analytics – 24/7
  • 7.
    Analytics can helpfind the needle • Works 24/7 • Identifies patterns, trends and exceptions • Overcomes the skilled resource issue • Provides actionable insights
  • 8.
    The IoT encompasses…. CloudServices Analytics Big Data Wireless Edge Devices
  • 9.
    The IoT inbuildings – why does it matter? In the past: Devices operated stand-alone Networked locally to form systems Multiple islands of “intelligence” Managed locally or at Enterprise level Siloed data HVAC Lighting Blind control Refrigeration Metering Power management Leak detection Lifts Security/Access Fire detection Car parking Irrigation ……. Lots of data but locked in silos – not available, so not that useful
  • 10.
    The IoT –why does it matter? In the future: Integration enables sharing of data Improves functionality Internet connectivity enhances sharing Advanced analytics for more insights HVAC Lighting Blind control Refrigeration Metering Power management Leak detection Lifts Security/Access Fire detection Car parking Irrigation ……. Real-time and business data all available to analytics tools – so VERY useful
  • 11.
    The IoT –why does it matter? Now: Most systems not integrated Siloed data and functionality No linkage to business databases Little deployment of analytics No real-time linkage to FM applications HVAC Lighting Blind control Refrigeration Metering Power management Leak detection Lifts Security/Access Fire detection Car parking Irrigation ……. Data available to the Enterprise, but manually processed and analysed – useful but costly
  • 12.
    How to getfrom “Now” to the “Future” 1. Review all installed systems 2. Identify all sources of real-time and static data 3. Identify operational “pain” points - what is hard, time consuming or impossible? 4. Identify what additional data could help solve the problem(s) 5. Choose one or two specific “use cases” to start with 6. Review potential analytics tools 7. Build a business case for implementing real-time data integration and analytics to address the use case(s) Steps:
  • 13.
    What do yougain? • Energy optimisation reduced utility costs reduced carbon taxes greener credentials
  • 14.
    What do yougain? • Energy optimisation reduced utility costs reduced carbon taxes greener credentials • Improved maintenance longer equipment lifecycles reduced down-time reduced costs
  • 15.
    What do yougain? • Energy optimisation reduced utility costs reduced carbon taxes greener credentials • Improved maintenance longer equipment lifecycles reduced down-time reduced costs • Better space utilisation improved work environment reducing real estate costs
  • 16.
    What do yougain? • Energy optimisation reduced utility costs reduced carbon taxes greener credentials • Improved maintenance longer equipment lifecycles reduced down-time reduced costs • Better space utilisation improved work environment reducing real estate costs • Improved asset reduced capital and management procurement costs
  • 17.
  • 18.
  • 19.
    Energy Management Applications •Energy analysis • Energy reporting • Carbon reporting • Tariff analysis • Bill validation • Tenant/departmental billing • Forecasting • Energy dashboards • Energy analytics
  • 20.
  • 21.
    Building Analytics Applications Real-timeautomated 24/7 fault diagnostics and energy optimisaton analytics
  • 22.
    Analytics vs Alarms Alarms •Have to set-up thresholds and alarm definitions in advance • No intelligence; operator has to interpret Analytics • Enables you to find patterns and exceptions • Can configure rules to make “smart alarms” • Provides results that show how building is REALLY operating
  • 23.
    Analytics vs Alarms- example An alarm only evaluates a single item against a pre-set limit at a single point in time e.g. an alarm can tell you if energy use is above a specific KW limit right now Analytics can tell you: how many hours in the last 6 months the electrical demand target was exceeded how long each of those periods were when they occurred what items of equipment were operating when the demand went above the limit how those events were related to the weather or building usage patterns
  • 24.
    Analytics vs Graphs Graphs •Require a skilled engineer to interpret and decide on actions • Only able to identify problems when graph is being viewed Analytics • Sophisticated analysis rules can be configured once and applied 24/7 • Corrective actions can be implemented automatically
  • 25.
  • 26.
    FM Applications Acronyms: FMCS -Facilities management Control System CMMS - Computerised Maintenance Management System CAFM - Computer Aided Facilities Management EAM - Enterprise Asset Management
  • 27.
  • 28.
    Predictive Maintenance applications Keyfeatures: Business Intelligence Real-time capabilities Quick and Accurate Decisioning Big Data, Predictive and Advanced Analytics Open Architecture Accelerated Time-to-Value Example: IBM’s PMQ software
  • 29.
    Rethink and ReinventBusiness services, processes and relationships… Courtesy of Speeding service delivery from 45 days to 20 minutes Recognising & repairing over 50% of issues before operations impact Increasing sales with new promotions from 15% to 75% Reducing the time it takes to backup critical data by 80% Optimise with Cloud Deploy Smarter Physical Infrastructure Extend to Mobile Devices Protect & Manage Data
  • 30.
    Enterprise Asset Management- Maturity Model Courtesy of
  • 31.
    Enterprise Asset Management– Maturity Model • Mostly reactive work, no planning • Highly centralised workforce • Little or no systems in place • Focus is on cost, primarily supply chain • Little cross team collaboration • Little performance measures in place • PM program, some planning • Partially centralised • System in place, scheduling • Some storeroom controls, lack measurements • Some teamwork in place • Maintenance cost records available • Long term planning in place • Some level of multi-skilled staff • EAM linked to financials / SC • Strategic sourcing / computerised • Self directed collaborative • Metrics in place, reliability and cost • Asset portfolio strategy • Independent trades, multi-skill • Open standards based integration • SLAs, vendor performance indicators • Business focus, high collaboration • Benchmarking, strong detail on reliability / cost EAM is Cost Focused EAM is An Investment Courtesy of
  • 32.
    Extend useful life ofcapital assets and manage aging infrastructure and workforce Supply Chain Management Manage the indirect MRO supply chain for asset intensive industry coverage area Health, Safety and Environment Reduce risk and meet compliance Service Management Improve Quality of Service Maximo Asset Management Capabilities • Work Management • Corrective, Preventive Maintenance • Condition Based Maintenance • GIS/Mapping • Analytics & reporting • Planning & scheduling • Workflow driven Best Practices • Knowledge Capture Asset Management • Incident Management • Risk Assessment • Regulatory Compliance • Non-Conformance mgmt • Management of Change • Inventory Management • Contract Management • Procurement • Spare Parts Management • Service Desk • Competency & Skills Management • Payment & Billing • SLAs • Contracted Service Courtesy of
  • 33.
    Benefits from implementingan EAM application Business Scenarios Key ROI Data Points Customer Examples Labour Utilisation Up 10-20% • A major US Pipeline company saved US £3M by better tracking labor to specific work Asset Availability Up 3-5% • A large refinery reduced unplanned downtime, estimated £300M annual revenue improvement Equipment purchases Down 3-5% • A upstream company saved US £8M by improving supply chain management during construction Warranty recoveries Up 10-50% • An upstream production company with a medium size fleet increased warranty recovery 50% Inventory needs Down 20-30% • A chemical company was able to identify US £12M in excess or obsolete inventory Inventory carrying costs Down 5-20% • A petrochemical company reduced saved US £1.2M impacting financing, insurance, handling, overhead, etc. Material Costs Reduced 10-50% • A refining company reduced costs 20% by optimising material purchases Purchasing Costs Reduced 10-50% • A large integrated NOC company reduced purchasing costs by over 50% Courtesy of
  • 34.
  • 35.
    IoT Technologies • Integrationsoftware - multi-protocol e.g. Niagara Framework • Wireless sensors and I/O - with open interface e.g. EnOcean, Z-wave, Zigbee, BLE, Wi-fi … • WAN communications - 3G, 4G, LoRa, Sigfox … • Standardisation Alliances
  • 36.
    IoT Technologies -big data & business analytics visualisation processing
  • 37.
    IoT in Buildings– integration Many systems from which useful data can be extracted, and control optimised: Access control Visitor management Digital Signage Intrusion detection CCTV Fire detection Smoke damper control Public Address Clock synchronisation Car park management Escalator control Refrigeration control HVAC control Packaged plant Lighting control External signage and lighting Blind control External shading Electrical power management Electrical and other metering UPS Standby generators Irrigation control Water leak detection Lift monitoring and control
  • 38.
    Many protocols requiredto achieve integration • Bacnet IP • Bacnet MSTP • Modbus IP • Modbus RTU • KNX • LON • EnOcean • DALI • SNMP • oBIX • SQL • + many more Open protocols make system integration MUCH easier, but there are also many proprietary protocols….. Open protocols used in buildings:
  • 39.
    N to N Lotsof Connections, Complexity and Cost Creates a Barrier to Deployment of Solutions Niagara Framework solves integration problem N to 1 Information representation is normalised
  • 40.
    The IoT addsmore… • New protocols • New sensor types - air quality, traffic flow, people movement etc. • New interactions - smartphone apps, iBeacons etc. • New priorities - well-being, environmental concerns, home working, cyber security ….
  • 41.
    Cyber security isa priority Security of any facilities management system depends on: Built-in capabilities (software supplier) Configuration (Integrators and administrators) Security of surrounding network (IT departments)
  • 42.
    “Secure by Default”principle 1. Make security easier: default to the most secure configurations • All transmissions encrypted • Users forced to have strong password strengths • Users set up with the strongest authentication mechanism • User lockouts upon consecutive bad log-ins 2. Force administrators to do the right thing • Factory default password must be changed after commissioning 3. Do the right thing, regardless of configuration • Encrypt sensitive information at rest • Digitally Signed Code: validated at run-time • Secure Boot: trusted software validated at boot-time 4. Provide stronger configuration options based on best practices • Articles, documentation, webinars to provide detailed guidance Software vendors can provide strong security capabilities – but it is important for partners and customers to configure and manage the software correctly!
  • 43.
    Best practices: • Uselatest products with the best security capabilities • It is important to update older products • Do not expose connected devices to the Internet • Most secure posture is for BMS/facilities management software to be managed in an isolated, internal network • If remote access is needed, use a VPN solution • Important: Use a defense-in-depth network security strategy • Further enhance protection to BMS/FM s/w and other systems with Intrusion Detection Systems (IDS), firewalls and other network security solutions • Isolate control systems from other internal networks • Follow best practice guides for configuration • Refer to resources on next page • Keep up with technical bulletins, patches • The most secure system has the latest security patches
  • 44.
    Summary • IoT isabout getting better real-time data and using it well to improve your business • Many challenges in integration and selection of software and services to achieve a good result • Major benefits in the way assets are managed • Rapid changes and need for good security in the connected world
  • 45.
  • 46.
    Best practices: resources •Technical bulletins http://www.tridium.com/en/resources/library • TridiumTalks: presentations and recordings http://www.tridium.com/en/resources/events • “Cyber security: Why it matters” • “Best practices for securing Niagara” • White papers http://www.tridium.com/en/resources/library • Niagara AX Hardening Guide • Using a VPN with Niagara • Niagara 4 documentation • Station Security Guide (ships with Niagara 4) • LinkedIn articles • "Cyber security begins, but does not end with security controls on your digital assets” • “Securing the IOT – 10 Best practices for securing Niagara devices”

Editor's Notes

  • #18 So Niagara, and the thousands of applications built on top of it, connects devices and gives you the ability to visualize what’s happening in real time. Needless to say, the reason that’s important is that having and seeing the data allow you to develop cost savings and operational improvements to meet your business objectives, which typically means finding cost savings through various kinds of optimization—for instance, predictive tools that reduce downtime and enhance end-to-end efficiency. Optimizing performance drives operational excellence and generates not only a notable ROI, but also long-term savings and strategies that can improve performance throughout your enterprise.
  • #23 Alarming is the way building management systems have traditionally been managed, with the facilities manager or team responding to alarms by investigating the causes. The usual problem is that the alarm threshholds have to be set-up at commissioning and there are frequently too many alarms, so they get switched off. Alarms are pretty dumb – the human operator has to interpret the meaning. In contrast with analytics, one can configure formulae to analyse the alarms and deduce what the problem is. One can intelligently process multiple alarms to reduce the “clutter” that is the usual problem experienced by those trying to mange a BMS. Analytics makes alarming “smart”.
  • #24 Contrast a simple KW threshold alarm and a an analytics smart alarm
  • #25 I expect most of you are already familiar with dashboards and graphs that let you visualise the data from your building, but the limitation of a visual display is that someone with a high skill level needs to look at the graphs and interpret what is going on. As humans we get tired, and we cannot be reviewing the data all the time. In contrast an analytics program works 24/7, and applies the same analysis consistently.
  • #26 So Niagara, and the thousands of applications built on top of it, connects devices and gives you the ability to visualize what’s happening in real time. Needless to say, the reason that’s important is that having and seeing the data allow you to develop cost savings and operational improvements to meet your business objectives, which typically means finding cost savings through various kinds of optimization—for instance, predictive tools that reduce downtime and enhance end-to-end efficiency. Optimizing performance drives operational excellence and generates not only a notable ROI, but also long-term savings and strategies that can improve performance throughout your enterprise.
  • #32 As we get towards excellence, we have a portfolio strategy for managing assets – not all assets are the same, they operate under different conditions and should have different strategies for optimization. Companies with this level of maturity are characterized by standards based interoperability from process control systems through enterprise applications. Service level management principles are applied and measured. Highly collaborative teams and benchmarking activities are in place to support continuous improvement.
  • #35 So Niagara, and the thousands of applications built on top of it, connects devices and gives you the ability to visualize what’s happening in real time. Needless to say, the reason that’s important is that having and seeing the data allow you to develop cost savings and operational improvements to meet your business objectives, which typically means finding cost savings through various kinds of optimization—for instance, predictive tools that reduce downtime and enhance end-to-end efficiency. Optimizing performance drives operational excellence and generates not only a notable ROI, but also long-term savings and strategies that can improve performance throughout your enterprise.
  • #38 You’re familiar with many of the systems shown here. In fact, we hope there are opportunities to further integrate the systems at [NAME OF PROSPECT] and find significant energy savings for you.
  • #39 You’re familiar with many of the systems shown here. In fact, we hope there are opportunities to further integrate the systems at [NAME OF PROSPECT] and find significant energy savings for you.
  • #41 You’re familiar with many of the systems shown here. In fact, we hope there are opportunities to further integrate the systems at [NAME OF PROSPECT] and find significant energy savings for you.
  • #45 You’re familiar with many of the systems shown here. In fact, we hope there are opportunities to further integrate the systems at [NAME OF PROSPECT] and find significant energy savings for you.