
More Related Content
Similar to Characteristics and Resource Potentials of Nigerian Atlantic
Similar to Characteristics and Resource Potentials of Nigerian Atlantic (20)
More from Dr. Amarjeet Singh
More from Dr. Amarjeet Singh (20)
Recently uploaded
Recently uploaded (20)
Characteristics and Resource Potentials of Nigerian Atlantic
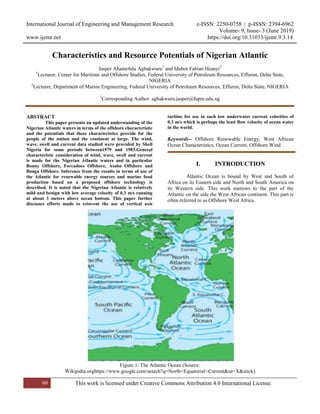
- 1. International Journal of Engineering and Management Research e-ISSN: 2250-0758 | p-ISSN: 2394-6962 Volume- 9, Issue- 3 (June 2019) www.ijemr.net https://doi.org/10.31033/ijemr.9.3.14 99 This work is licensed under Creative Commons Attribution 4.0 International License. Characteristics and Resource Potentials of Nigerian Atlantic Jasper Ahamefula Agbakwuru1 and Idubor Fabian Ifeanyi2 1 Lecturer, Center for Maritime and Offshore Studies, Federal University of Petroleum Resources, Effurun, Delta State, NIGERIA 2 Lecturer, Department of Marine Engineering, Federal University of Petroleum Resources, Effurun, Delta State, NIGERIA 1 Corresponding Author: agbakwuru.jasper@fupre.edu.ng ABSTRACT This paper presents an updated understanding of the Nigerian Atlantic waters in terms of the offshore characteristic and the potentials that these characteristics provide for the people of the nation and the continent at large. The wind, wave, swell and current data studied were provided by Shell Nigeria for some periods between1979 and 1983.General characteristic consideration of wind, wave, swell and current is made for the Nigerian Atlantic waters and in particular Bonny Offshore, Forcadoes Offshore, Asabo Offshore and Bonga Offshore. Inference from the results in terms of use of the Atlantic for renewable energy sources and marine food production based on a proposed offshore technology is described. It is noted that the Nigerian Atlantic is relatively mild and benign with low average velocity of 0.3 m/s running at about 3 meters above ocean bottom. This paper further discusses efforts made to reinvent the use of vertical axis turbine for use in such low underwater current velocities of 0.3 m/s which is perhaps the least flow velocity of ocean water in the world. Keywords-- Offshore Renewable Energy, West African Ocean Characteristics, Ocean Current, Offshore Wind I. INTRODUCTION Atlantic Ocean is bound by West and South of Africa on its Eastern side and North and South America on its Western side. This work narrows to the part of the Atlantic on the side the West African continent. This part is often referred to as Offshore West Africa. Figure 1: The Atlantic Ocean (Source: Wikipidia.orghttps://www.google.com/search?q=North+Equatorial+Current&sa=X&stick)
- 2. International Journal of Engineering and Management Research e-ISSN: 2250-0758 | p-ISSN: 2394-6962 Volume- 9, Issue- 3 (June 2019) www.ijemr.net https://doi.org/10.31033/ijemr.9.3.14 100 This work is licensed under Creative Commons Attribution 4.0 International License. Within the Offshore West Africa is part of the Ocean belonging to Nigeria as a country. We will refer to this part as Offshore Nigeria. This work studies the Atlantic Ocean characteristics of the Offshore Nigeria. Shell Nigeria has provided data of some Nigerian Offshore Stations, namely, Bonny, Forcados, Aasabo and Bonga offshores. The data is studied and very important inferences made. More details on the presentation can be provided on demand. West African Ocean Characteristic It is known that the Ocean environment Offshore West Africa is mild as local storms are just rare. It is dominated by swell waves, which are generated by high wind energies, far away from offshore West Africa, in the South Atlantic and North Atlantic during the austral winter and austral summer, respectively (Prevosto et al., 2013).High energies transferred by the wind to the sea results in the propagation of fast moving swell waves, covering enormous distance to West Africa coast. These swells, being generated from sources far from the West African ocean environment, are characterized as low long waves, having long wavelength, with reduced amplitude/wave height. However, these swells possess enormous amounts of energies transferred by the strong winds at the source(Prevosto et al., 2013). Based on National Aeronautical and Space Administration (NASA) satellite sensors, Quik SCAT scatter meters etc., (Chen et al.,2002) produced global maps of swell climate and based on the study of (Alves,2006) three well-defined swell-dominated zones in the tropical areas of Pacific ocean (South and North), Atlantic ocean (South and North), and the Indian ocean were identified, see Figure 1. FigureError! No text of specified style in document.: Swell Generation Areas-Storm Extra-tropical Storm Atlas (Alves, 2006) The persistent, strong winds over the Southern Ocean near the southern tip of South Africa generate high waves that travel thousands of kilometers to the North Indian Ocean as large swell component with the magnitude of swell height between 15.0 m (near the generation area) and around 6.0 m (near La Reunion island) (Alves, 2006). These swells, on entering the Indian Ocean region, contribute to the total wave height of the surface waves. (Ardhuin et al.,2009) provided an accurate estimation of the dissipation rate of swell energy across the oceans. Study by (Bhowmick et al.,2011) shows that the Indian Ocean is dominated by swells of considerable amplitudes. These swells arrive from the Southern Ocean during most part of the year and can grow significantly under the influence of strong winds such as storms. II. METHODOLOGY 2.1 Bonga Offshore Nigeria (water depth - 1018m) Based on the values of the significant wave height and period(Hs and Tp) for the swell wave components as shown in the Figure 2, it can be deduced that swell component-1 is the primary swell while swell component-2 is a secondary swell.
- 3. International Journal of Engineering and Management Research e-ISSN: 2250-0758 | p-ISSN: 2394-6962 Volume- 9, Issue- 3 (June 2019) www.ijemr.net https://doi.org/10.31033/ijemr.9.3.14 101 This work is licensed under Creative Commons Attribution 4.0 International License. Figure 2: Hs and Tp scatter Plot of swell components 1 & 2 (Adesanya et al., 2017) Table 1 and Figures 3 and 4 indicate the extreme waves and fitted distribution. Table Error! No text of specified style in document.: Plot Function Values of 3-parameter Weibull Distr. for Swell Components Hs for Different Return Periods (Adesanya et al., 2017) Return Period (years) n3h ln(-ln(1-F) Components 1 & 2 Swell 1 2920 2.07 10 29200 2.33 100 292000 2.53
- 4. International Journal of Engineering and Management Research e-ISSN: 2250-0758 | p-ISSN: 2394-6962 Volume- 9, Issue- 3 (June 2019) www.ijemr.net https://doi.org/10.31033/ijemr.9.3.14 102 This work is licensed under Creative Commons Attribution 4.0 International License. Figure 3: Empirical and fitted 3-parameter Weibull Distr. for the Component-1 Swell Hs(Adesanya et al., 2017) Figure 4: Empirical and fitted Log-normal distribution for the Component-1 Swell Hs(Adesanya et al., 2017) 2.2 Bonny Offshore (Water depth of 19.0m) Bonny offshore, unlike the Bonga is a shallow offshore. It is observed that there is consistent increase in wave height for mid years. There is a relatively strong difference between the measurements of Hs recorded in August of the three years. The spectral period of the Bonny wave study is about 7 seconds. See Figures 5 and 6. Figure 5: Bonny time history for 1980 to 1983 Figure 6: Hs and Tp Scatter Plot for 1979 and1983
- 5. International Journal of Engineering and Management Research e-ISSN: 2250-0758 | p-ISSN: 2394-6962 Volume- 9, Issue- 3 (June 2019) www.ijemr.net https://doi.org/10.31033/ijemr.9.3.14 103 This work is licensed under Creative Commons Attribution 4.0 International License. Figure 7 shows applicable distribution for Bonny wave system. Figure 7: Log Normal probability paper – Empirical and fitter distribution for Bonny 2.3 Asabo Offshore (Water depth - 47 m) Asabo offshore located at Qua-Ibo in AkwaIbom state in Figure 8 Figure 8: Asabo Offshore (Marked Red) Figure 9 and 10 indicate the spectral period and fitted distribution for Asabo data.
- 6. International Journal of Engineering and Management Research e-ISSN: 2250-0758 | p-ISSN: 2394-6962 Volume- 9, Issue- 3 (June 2019) www.ijemr.net https://doi.org/10.31033/ijemr.9.3.14 104 This work is licensed under Creative Commons Attribution 4.0 International License. Figure 10: Asabo offshore distribution fitted 2.4 Forcados Offshore (water depth - 22 m) Forcados Offshore is another shallow water offshore as seen in Figure 11. The spectral plot with wave height is given in Figure 12. Figure 11: Forcados Offshore
- 7. International Journal of Engineering and Management Research e-ISSN: 2250-0758 | p-ISSN: 2394-6962 Volume- 9, Issue- 3 (June 2019) www.ijemr.net https://doi.org/10.31033/ijemr.9.3.14 105 This work is licensed under Creative Commons Attribution 4.0 International License. Figure 12: Plot of Tp versus Hs of Forcados data 2.5 Offshore Wind Tables 2 to 5 show the data that indicate the monthly mean values of the wind speed at the different locations. These data descriptions were used in the computations of energy potentials of the sites and other related parameters as documented in the Tables. Table 2: Forcados field energy analysis using 1982 wind data. MONTHS Vm (m/s) K c (m/s) VF (m/s) VE (m/s) PD(W/m2 ) January 1.2 2.6 1.6 1.3 3.4 1.0584 February 4.2 5.7 5.7 4.4 7.5 45.3789 March 6.1 6.5 6.3 6 10 139.0258625 April 5.3 6 5.44 5.3 6.6 91.1871625 May 3.9 4.91 4.31 3.7 5.4 36.3328875 June 5.4 6.2 5.7 5.1 8 96.4467 July 5.1 6.1 5.9 5 6.4 81.2487375 August 2.5 3.6 2.8 3.1 4.8 9.5703125 September 2.1 3.3 2.4 4 5 5.6723625 October 4.1 5.1 4.5 4.1 5.3 42.2141125 November 1.8 2.5 1 2.3 3.88 3.5721 December 2.3 2.8 2.6 3.1 4.4 7.4522875 TOTAL 44 55.37 48.25 47.4 70.72 559.159825 Annual Mean 3.67 4.61 4.02 3.95 5.89 46.59665208 Mean wind speed (Vm); dimensionless Weibull shape parameter (k); Weibull scale parameter (c); most probable wind speed (VF); wind speed carrying maximum energy (VE); wind power density (PD); mean energy density (ED). (Source: Agbakwuru and Akawaase, 2018) Table 3: Bonny field energy analysis using 1980 wind data. MONTHS Vm (m/s) K c (m/s) VF (m/s) VE (m/s) PD(W/m2 ) January 3.6 3.2 3 2.9 5 28.5768 February 4.3 4.6 5.3 4.4 6 48.69804 March 3.8 4.2 6 6 8 33.6091
- 8. International Journal of Engineering and Management Research e-ISSN: 2250-0758 | p-ISSN: 2394-6962 Volume- 9, Issue- 3 (June 2019) www.ijemr.net https://doi.org/10.31033/ijemr.9.3.14 106 This work is licensed under Creative Commons Attribution 4.0 International License. April 3.2 4.5 5.98 5 7 20.0704 May 3.5 4.62 4.86 4.6 5.4 26.26094 June 4.7 4.2 5.2 5.3 8 63.59159 July 5.4 5.1 5.7 5 7 96.4467 August 4.5 4.3 3.8 5.3 6 55.81406 September 4.1 4.7 2.9 4 5 42.21411 October 3.5 3.8 4.6 4.2 5.6 26.26094 November 3.9 2.5 2.8 3.6 4 36.33289 December 4.7 2.8 3.4 3.9 3 63.59159 TOTAL 49.2 48.52 53.54 54.2 70 541.4672 Annual Mean 4.1 4.043333 4.46166 4.516667 5.83333 45.1222 Mean wind speed (Vm); dimensionless Weibull shape parameter (k); Weibull scale parameter (c); most probable wind speed (VF); wind speed carrying maximum energy (VE); wind power density (PD); mean energy density (ED).(Source: Agbakwuru and Akawaase, 2018) Table 4: Bonga platform energy analysis using 1980 wind data MONTHS Vm (m/s) K c (m/s) VF (m/s) VE (m/s) PD(W/m2 ) January 6.5268 4.05 4.4 4.31 8.01 170.297 February 6.8376 4.31 4.56 4.42 7.04 195.802 March 5.9052 3.76 4.03 4 10 126.1275 April 5.2836 3.31 3.78 3.65 9.68 90.34329 May 6.993 4.47 4.63 4.42 12 209.4579 June 7.9254 4.95 5.51 4.97 8.11 304.9086 July 7.6146 4.83 4.95 4.93 7.9 270.4253 August 6.216 3.96 4.35 4.26 6.3 147.109 September 5.7498 3.63 3.96 3.82 6.01 116.4298 October 6.6822 4.22 4.47 4.41 7.31 182.753 November 9.4794 5.72 8.01 7.07 15.01 521.7334 December 4.5066 3.13 4.08 3.83 4.4 56.06 TOTAL 79.7202 50.34 56.73 54.09 101.79 2391.447 Annual Mean 6.64335 4.195 4.73 4.51 8.48 199.2872 Mean wind speed (Vm); dimensionless Weibull shape parameter (k); Weibull scale parameter (c);most probable wind speed (VF); wind speed carrying maximum energy (VE); wind power density (PD); mean energy density (ED).(Source: Agbakwuru and Akawaase, 2018) Table 5: Asabo field energy analysis 1982 MONTHS Vm (m/s) K c (m/s) VF (m/s) VE (m/s) PD(W/m2 ) January 3.7 3.23 3.53 3.62 4.1 31.0249625 February 4.9 3.49 4.13 4.21 4.5 42.2141125 March 4.6 4.78 4.71 4.65 5.2 69.6183 April 4.5 4.24 3.99 4.32 4.8 45.3789 May 4.8 3.53 4.82 4.84 5.4 77.7376
- 9. International Journal of Engineering and Management Research e-ISSN: 2250-0758 | p-ISSN: 2394-6962 Volume- 9, Issue- 3 (June 2019) www.ijemr.net https://doi.org/10.31033/ijemr.9.3.14 107 This work is licensed under Creative Commons Attribution 4.0 International License. June 6.4 3.01 6.32 5.08 7.7 160.5632 July 5.7 4.52 5.62 5.82 6.5 113.4307125 August 7.1 3.07 7.04 6.89 8.2 219.2204875 September 5.8 4.93 5.43 5.72 6.4 107.5648 October 6.2 4.41 6.14 5.67 7.5 145.9759 November 4.4 3.65 4.39 4.53 5.8 52.1752 December 3.9 3.11 3.74 4 4.6 31.0249625 TOTAL 60.5 45.97 59.86 64.43 71.3 1075.929138 Annual Mean 5.14 3.83 4.99 5.37 5.94 95.66076146 Mean wind speed (Vm); dimensionless Weibull shape parameter (k); Weibull scale parameter (c); most probable wind speed (VF); wind speed carrying maximum energy (VE); wind power density (PD); mean energy density (ED).(Source: Agbakwuru and Akawaase, 2018) Figures 13 to 17 shows the wind direction of most of the stations under consideration. Figure 13: Weekly mean wind direction in 1982 at Asabo platform. The mean wind speed experienced at Asabo platform in 1982 reached a monthly mean speed of 7.1m/s in the month of August with a maximum wind speed of 12m/s at an instant during the month. Figure 14: Bonga monthly and weekly wind direction in 1980 and 1981
- 10. International Journal of Engineering and Management Research e-ISSN: 2250-0758 | p-ISSN: 2394-6962 Volume- 9, Issue- 3 (June 2019) www.ijemr.net https://doi.org/10.31033/ijemr.9.3.14 108 This work is licensed under Creative Commons Attribution 4.0 International License. Figure 15: Monthly and weekly wind direction at Forcados Figure 16: Bonny monthly and weekly wind direction measured in 2006 Examining the results with the Universal Classification of Table 6, the wind resource in these locations falls into class 3 or less. This is considered as marginal or unsuitable for wind power development. The wind source as found can be used for water pumping and small-scale electricity generation, providing intermittent power requirements for a variety of purposes that need low- energy capacity, slow-running high-torque. It is noted that energy can be enhanced to enter higher class by applying the current technology of wind tunneling. For a modern wind turbine, the cut-in wind speed required to start generating electricity is generally between 3m/s to 5 m/s. Depending on the size of the turbine, the peak power output can be attained when the wind speed is in the range of 10 m/s to 15 m/s. Figure 17 indicates that wind speed increase towards the deep water.
- 11. International Journal of Engineering and Management Research e-ISSN: 2250-0758 | p-ISSN: 2394-6962 Volume- 9, Issue- 3 (June 2019) www.ijemr.net https://doi.org/10.31033/ijemr.9.3.14 109 This work is licensed under Creative Commons Attribution 4.0 International License. Figure 17: Annual wind speed distribution for Probability density function. In general, Nigerian offshore exhibits a great variation in the wind speed in daily terms, recording as high as 15m/s at some instance and 0m/s at times. The mean power density is a useful way to evaluate the wind resource available at a potential site as it indicates how much energy is available at the site for conversion by a wind turbine. III. GENERAL DISCUSSIONS ON THE NIGERIAN ATLANTIC UNDER STUDY Figure 18: Collective area of the West Africa offshore under study Forcados Bonny Asabo Bonga
- 12. International Journal of Engineering and Management Research e-ISSN: 2250-0758 | p-ISSN: 2394-6962 Volume- 9, Issue- 3 (June 2019) www.ijemr.net https://doi.org/10.31033/ijemr.9.3.14 110 This work is licensed under Creative Commons Attribution 4.0 International License. The locations under the study are shown in Figure 18. It is noted that there are three shallow water locations and one deep water (Bonga) station. The locations studied can be generalized into the part of the Nigeria offshore as marked in red lines. Based on the data available and the consequent analyzed results, the following observations are made: 1. The ocean condition is mild with extreme waves less than 2.5m. 2. The wave is largely primary swell with long period in Bonga. The swell metamorphosed into secondary waves with lower period as it approaches shallow water. a. In Forcados, the secondary waves is attributed to shallow water and vegetation sheltering b. In Bonny and Asabo, it is largely due to numerous islands and shallow water 3. Wind power source offshore is not competitively large. 4. Underwater Current power source is not competitively large. The minimum current velocity required for power is 1.0 m/s. The mea current velocity in the area under study is only 0.3 m/s. 5. Though Shell Nigeria report discussed the possible errors in the Bonga current directions, a deeper review tends to point that the current is unidirectional. a. In Shallow water Forcados, it is purely tidal. b. Bonny and Asabo show relatively unidirectional IV. OPPORTUNITIES IN THE NIGERIAN ATLANTIC UNDER STUDY Nigeria is not as lucky as their counterparts in Europe, America and Asia with large wind power and huge underwater current. However, it can be optimized fit its purpose. 4.1 Renewable Power Opportunities in renewable energy power do exist but the required approach is purely by integrating two or more energy sources. Solar is abundant and require space which can easily be found offshore. The Center for Maritime and Offshore Studies of the University has developed a ducted vertical axis underwater current power turbine (UCPT) that can operate at low velocities of about 0.2m/s (Agbakwuru et al., 2019). See Figures 19, 20 and 21. Figure 19: Vertical axis underwater power turbine for low velocities
- 13. International Journal of Engineering and Management Research e-ISSN: 2250-0758 | p-ISSN: 2394-6962 Volume- 9, Issue- 3 (June 2019) www.ijemr.net https://doi.org/10.31033/ijemr.9.3.14 111 This work is licensed under Creative Commons Attribution 4.0 International License. Figure 20: The floated UCPT model showing throat to blades (other parts are submerged) Figure 21: The UCPT at workshop demonstration. The wave period in certain places, especially at show locations is very low and considering the fact that the ocean surface is mild, an indigenous technology of buoy operated wave power can be made and deployed. The Center for Maritime and Offshore Studies of the University has initiated work on this. The consequence of these developments is that we can integrate solar system on exposed platforms. 4.2. Marine Food Production The consequence of such installation is generation of power for use not only in the riverine but also for the so called all-electric driven vessels for fish production. Nigeria is noted to have lost its base as a fish trawling nation, not because our water is infertile but basically due to unavailability of affordable technology to ensure that sea going capital cost is well lower than the price of fish trawled. The present day diesel engine operated system of trawling certainly have costs concern. The idea of all-electric driven vessel or hybrid is perhaps the best way to go. This will be addressed in another paper. V. CONCLUSION The paper has attempted to demonstrate that though in terms of magnitudes, wave heights, underwater currents and winds are low, but one can capitalize on the mild nature of the West African Ocean and harness energies through integration of energy systems. This can further be extended into the marine food production in ocean system using low capital vessels with all electric driven for trawling. ACKNOWLEDGMENT The Center for Maritime and Offshore Studies. And the Department of Marine Engineering, both of the Federal University of Petroleum Resources, Effurun, gladly thank Shell Nigeria for the provision of relevant data used in this work.
- 14. International Journal of Engineering and Management Research e-ISSN: 2250-0758 | p-ISSN: 2394-6962 Volume- 9, Issue- 3 (June 2019) www.ijemr.net https://doi.org/10.31033/ijemr.9.3.14 112 This work is licensed under Creative Commons Attribution 4.0 International License. REFERENCES [1] Djamal Hissein Didane, Nurhayati Rosly, Mohd Fadhli Zulkafli, & Syariful Syafiq Shamsudin. (2017). Evaluation of wind energy potential as a power generation source in chad. Available at: https://www.hindawi.com/journals/ijrm/2017/3121875/. [2] Agbakwuru, J.A., Akaawase, B., & Nwaoha, T. C. (2019). Characteristics and resource potentials of Nigerian Atlantic. Presented at the 5th High Level Industry, science and government dialogue on Atlantic interaction. Available at: https://www.researchgate.net/project/Characteristics- and-resource-potentials-of-Nigerian-Atlantic. [3] Agbakwuru, J.A., Akaawase, B.T., & Ove, G.T. (2017). The sea state description of Asabo location in offshore Nigeria. Ocean System Engineering: Techno Press. [4] Akinsanya Akinyemi Olugbenga, Gudmestad Ove Tobias, & Agbakwuru Jasper. (2017). Swell description for Bonga Offshore Nigeria location. Ocean System Engineering, 7(4). Available at: https://www.researchgate.net/publication/322300474_Swell _description_for_Bonga_offshore_Nigeria location [5] Alves, J.H.G.M. (2006). Numerical modeling of ocean swell contributions to the global wind wave climate. Ocean Modelling, 11(1-2), 98-122. [6] Ardhuin, F., Bertrand, C., & Fabrice, C. (2009). Observation of swell dissipation across oceans. Geophysical Research Letters, 36(6). Available at: https://agupubs.onlinelibrary.wiley.com/doi/full/10.1029/20 08GL037030.. [7] Bhowmick, S., Kumar, R., Chaudhuri, S., & Sarkar, A. (2011). Swell propagation over Indian ocean region. International Journal of Ocean and Climate Systems, 2, 87– 99. [8] Chen, Y. et al. (2002). Surface temperature of the Arctic: Comparison of TOVS satellite retrievals with surface observations. Available at: https://journals.ametsoc.org/doi/abs/10.1175/1520- 0442%282002%29015%3C3698%3ASTOTAC%3E2.0.CO %3B2. [9] Prevosto, M.et al. (2013). Swell genesis, modelling and measurements in West Africa. Availale at: https://www.researchgate.net/publication/267607618_Swell _Genesis_Modelling_and_Measurements_in_West_Africa.