
Recommended
More Related Content
Similar to characteristic of function, average rate chnage, instant rate chnage.pptx
Similar to characteristic of function, average rate chnage, instant rate chnage.pptx (20)
More from PallaviGupta66118
More from PallaviGupta66118 (10)
Recently uploaded
Recently uploaded (20)
characteristic of function, average rate chnage, instant rate chnage.pptx
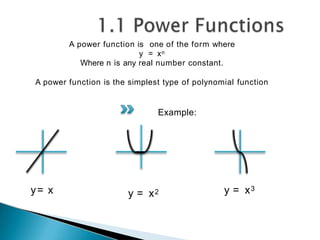
- 1. A power function is one of the form where y = xn Where n is any real number constant. A power function is the simplest type of polynomial function Example: y= x y = x2 y = x3
- 2. F(X) =3x5 + 2x3 + x2 - 1 Leading coefficient Degree Constant term ( a0 ) variable • n must be a whole number
- 3. ODD-DEGREE POWER FUNCTIONS HAVE POINT SYMMETRY ABOUT THE ORIGIN, (0,0)
- 4. Bracket interval Inequality Number line In words (a,b) a <x<b a b X is greater than x than a and less than b (a,b] a < x ≤ b a b X is greater than a and less than or equal to b
- 5. Key features of the graph Y=xn ; n = odd Y=xn; n = even Domain {x € R } {x € R } Range { y € R } { y € R/ y ≥ 0 } End behaviour as x ∞ y ∞ y End behaviour as x ∞ y- ∞ y ∞ I II III IV
- 6. Local maximum Local minimum VIDEO TIME ! ^_^ Absolute minimum
- 7. Graphs of polynomial functions with odd degree 🞂 odd-degree polynomials have at least one x - intercepts, up to a max of nx-intercepts. 🞂 The domain of all odd-degree polynomials is {xε R} and the range is { yε R} 🞂 Odd degree functions have NO maximum point * minimum point 🞂 Odd-degree polynomials may have point symmetry Positive leading coefficient Negative leading coefficient
- 8. 🞂 Even-degree polynomials may have from zero to a maximum of n x - intercepts, where n is the degree of the function 🞂 The domain of all even-degree polynomials is {xε R} 🞂 Even-degree polynomials may have line symmetry. Graphs of Polynomial Functions with Even Degree Positive leading coefficient Negative leasing coefficient
- 10. 🞂 Using Y & X – Intercepts ( Zero‟s ) 🞂 The degree of the function 🞂 Sign of leading coefficient 🞂 Graphic Calculator
- 11. F ( x ) = ( X – 1 ) ( X + 1 ) ( X – 3 ) Y = 0 X – 1 = 0 = 1 X + 1 = 0 = - 1 X – 3 = 0 = 3 X = 0 Y = X – 1 = - 1 Y = X + 1 = 1 Y = X – 3 = - 3 X intercept(s) : Y = 0 Y intercept(s) : X = 0
- 12. F ( x ) = ( X – 1 ) ( X + 1 ) ( X – 3 ) X3 – 3X2 – X + 3 (Degree: 3; Three possible solutions)
- 13. POSITIVE NEGATIVE E O v d e d n Degree Polynomials
- 14. X3 – 3X2 – X + 3 Positive Leading Coefficient Degree of 3 = Odd
- 15. 🞂 Clear Your Memory ( Just In Case ) 🞂 Press “ ( Y = )“ 🞂 Key in formula 🞂 Press “ Graph “ Steps
- 17. y= a f [k(x+b)] + c
- 18. „ - ‟ means reflection in the x - axis a>1 0<a<1 means vertical stretch of factor a means vertical compression of factor a k>1 0<k<1 means horizontal compression of factor 1/k means horizontal stretch of factor 1/k b>0 b<0 means horizontal shift b unit left means horizontal shift b unit right c>0 c<0 means vertical shift c unit up means vertical shift c unit down Note: f(-x) - f(x) means a reflection in the y-axis means a reflection in the x - axis
- 19. Reflection over the x - axis - f(x) reflects f(x) over the x-axis.
- 20. Reflection over the y-axis f(-x) reflects f(x) over the y-axis.
- 21. a Vertical Stretch or Compress a[f(x)] stretches/compresses f(x) vertically
- 22. k Horizontal Stretch or Compress f(kx) stretches/compresses f(x) horizontally
- 23. b Slide to the right or left f(x + / - b) translates f(x) horizontally
- 24. c Slide upward or downward [f(x)+/-] c translates f(x) vertically
- 25. f(x)=x2 f(x)= 4(1/3 x)2 - 7
- 28. 🞂 Measure of how quickly one quantity (the dependent variable) changes with respect to another quantity (the independent variable) 🞂 Types of rate of change:- ◦ Average ◦ Instantaneous
- 29. Average Rate Of Change Instantaneous Rate Of Change 🞂 Change that takes place over an interval 🞂 Change that takes place in an instant
- 30. 🞂 Rate of Change - Average Rate of Change - Instantaneous Rate of Change 🞂 Slope = Gradient 🞂 Secant = Line that connects two points on a curve 🞂 Points [Example: P (x,y)]
- 31. 🞂 Refers to the slope of the secant between the points. 🞂 Average rate of change = ∆ y / ∆ x = change in y/change in x = y2-y1 x2-x1
- 32. Time (t) in hours ; x 0 1 2 3 3.5 Distance d(t) in km; y 50 98 156 200 256 • Average velocity= slope/gradient=m= ∆ y / ∆ x Average rate of change = (y2-y1)/(x2-x1) Time ∆d ∆ t ∆ d / ∆ t = Average ROC 0<t<1 d(1) – d(o) = 48km 1 - 0=1 48 km/h 1<t<2 d(2) – d(1) = 58km 2 - 1=1 58km/h 2<t<3 d(3) – d(2) = 44km 3 - 2=1 44km/h 3<t<4 d(3.5) – d(3) = 56km 3.5-3=0.5 112km/h
- 33. 🞂 John drops a ball from the cliff of a hill of 150m. After t seconds it is d meters above the ground, where d(t) = 90– 4t2; 0<t<5 a) Calculate the average rate of change of the distance of the ball above the ground between the times t = 1 and t = 4 Average velocity = d(4) – d(1) / 4 - 1 =2 6 - 86 / 4 - 1 = - 20m/s b) Find the average rate of change of the distance of the ball above the ground between t=1 and t=2.5 Average velocity = d(2.5) – d(1) / 2.5 – 1 = 65-86/2.5-1 = - 14m/s
- 34. 200 0 400 1000 800 600 2 4 6 8 10 12 Amount Of Money Amount Of Money
- 35. amount of 🞂 Find the average rate of change of the money in the account: i) Month 2 to month 4 ii) Month 4 to month 8 iii) Month 8 to month 10 iv) Month 8 to month 12 i) A.R.O.C = 400-200/ 4- = 50 ii) A.R.OC = 800-400/ 8 - 4 = 100 iii) A.R.O.C = 800-800/10-8 = 0 iv) A.R.O.C = 500-800/ 12-8 = - 75
- 36. 🞂 How can you tell that the A.R.O.C is positive/negative by examining a) the table of values ? - POSITIVE because as x increases, y increases - NEGATIVE because as x increases, y decreases b) the graph ? - POSITIVE because the graph is increasing from left to right - NEGATIVE because the graph is decreasing from left to right
- 37. 🞂 How can you tell the rate of change is constant or non-constant by examining a) The table of values ? - CONSTANT= the change in the dependent variables is the same for each one unit increase in the independent variable. - NON- CONSTANT = the change in the dependent variables varies for each one unit increase in the independent variable. b) The graph ? - CONSTANT = Graph is linear - NON- CONSTANT= Graph is not linear c) The average rate of change ? - CONSTANT = A.R.O.C is the same - NON- CONSTANT = A.R.O.C varies
- 39. - As a point Y becomes very close to a tangent point X, the slope of the secant line becomes closer to (approaches) the slope of the tangent line. is used to denote the word - An arrow “approaches”. - Example: As Y X, the slope of secant XY the slope of the tangent at X. - Thus, the A.R.O.C between X and Y becomes closer to the value of the instantaneous rate of change at X.
- 40. 🞂 From a graph - Draw a tangent line on the graph and estimating the slope of that tangent from the graph
- 41. x y 0.6 5.0 0.8 5.3 1.0 4.9 1.3 3.0 1.5 3.53 🞂 From the table of values method Slope of secant between X= 0.8 & X= 1.0 = 4.9-5.3/1.0-0.8 = - 2 Slope of secant between X= 1.0 & X= 1.3 = 3.0- 4.9/1.3-1.0 = - 6.3 Instantaneous rate of change at X= 1.0= a+b/2 Therefore, = - 2+(-6.3)/2 = - 4.15
- 42. 🞂 From an equation method - Looking for a trend as the slopes of secants get closer and closer to the slope of the tangent. - Example: A ball is tossed up in the air so that it‟s position s in meters and at time t in second, is given by: s(t) = - 5t2 + 30t + 2 Interval ∆s ∆ t Average rate of change 1<t<2 S(2) – s(1) = 15 2- 1 = 1 15 1<t<1.5 S(1.5) –s(1) = 1.75 1.5 - 1 = 0.5 17.5 1<t<1.1 S(1.1) – s(1) = 1.95 1.1-1 = 0.1 19.5 1<t<1.0 1 S(1.01) – s(1) = 1.995 1.01 – 1 = 0.01 19.95 Therefore, the I.R.O.C at t=1, approximately 20m/s.
- 43. 🞂 Using the graphing calculator (Tangent Operation) - Page 515 in the text book