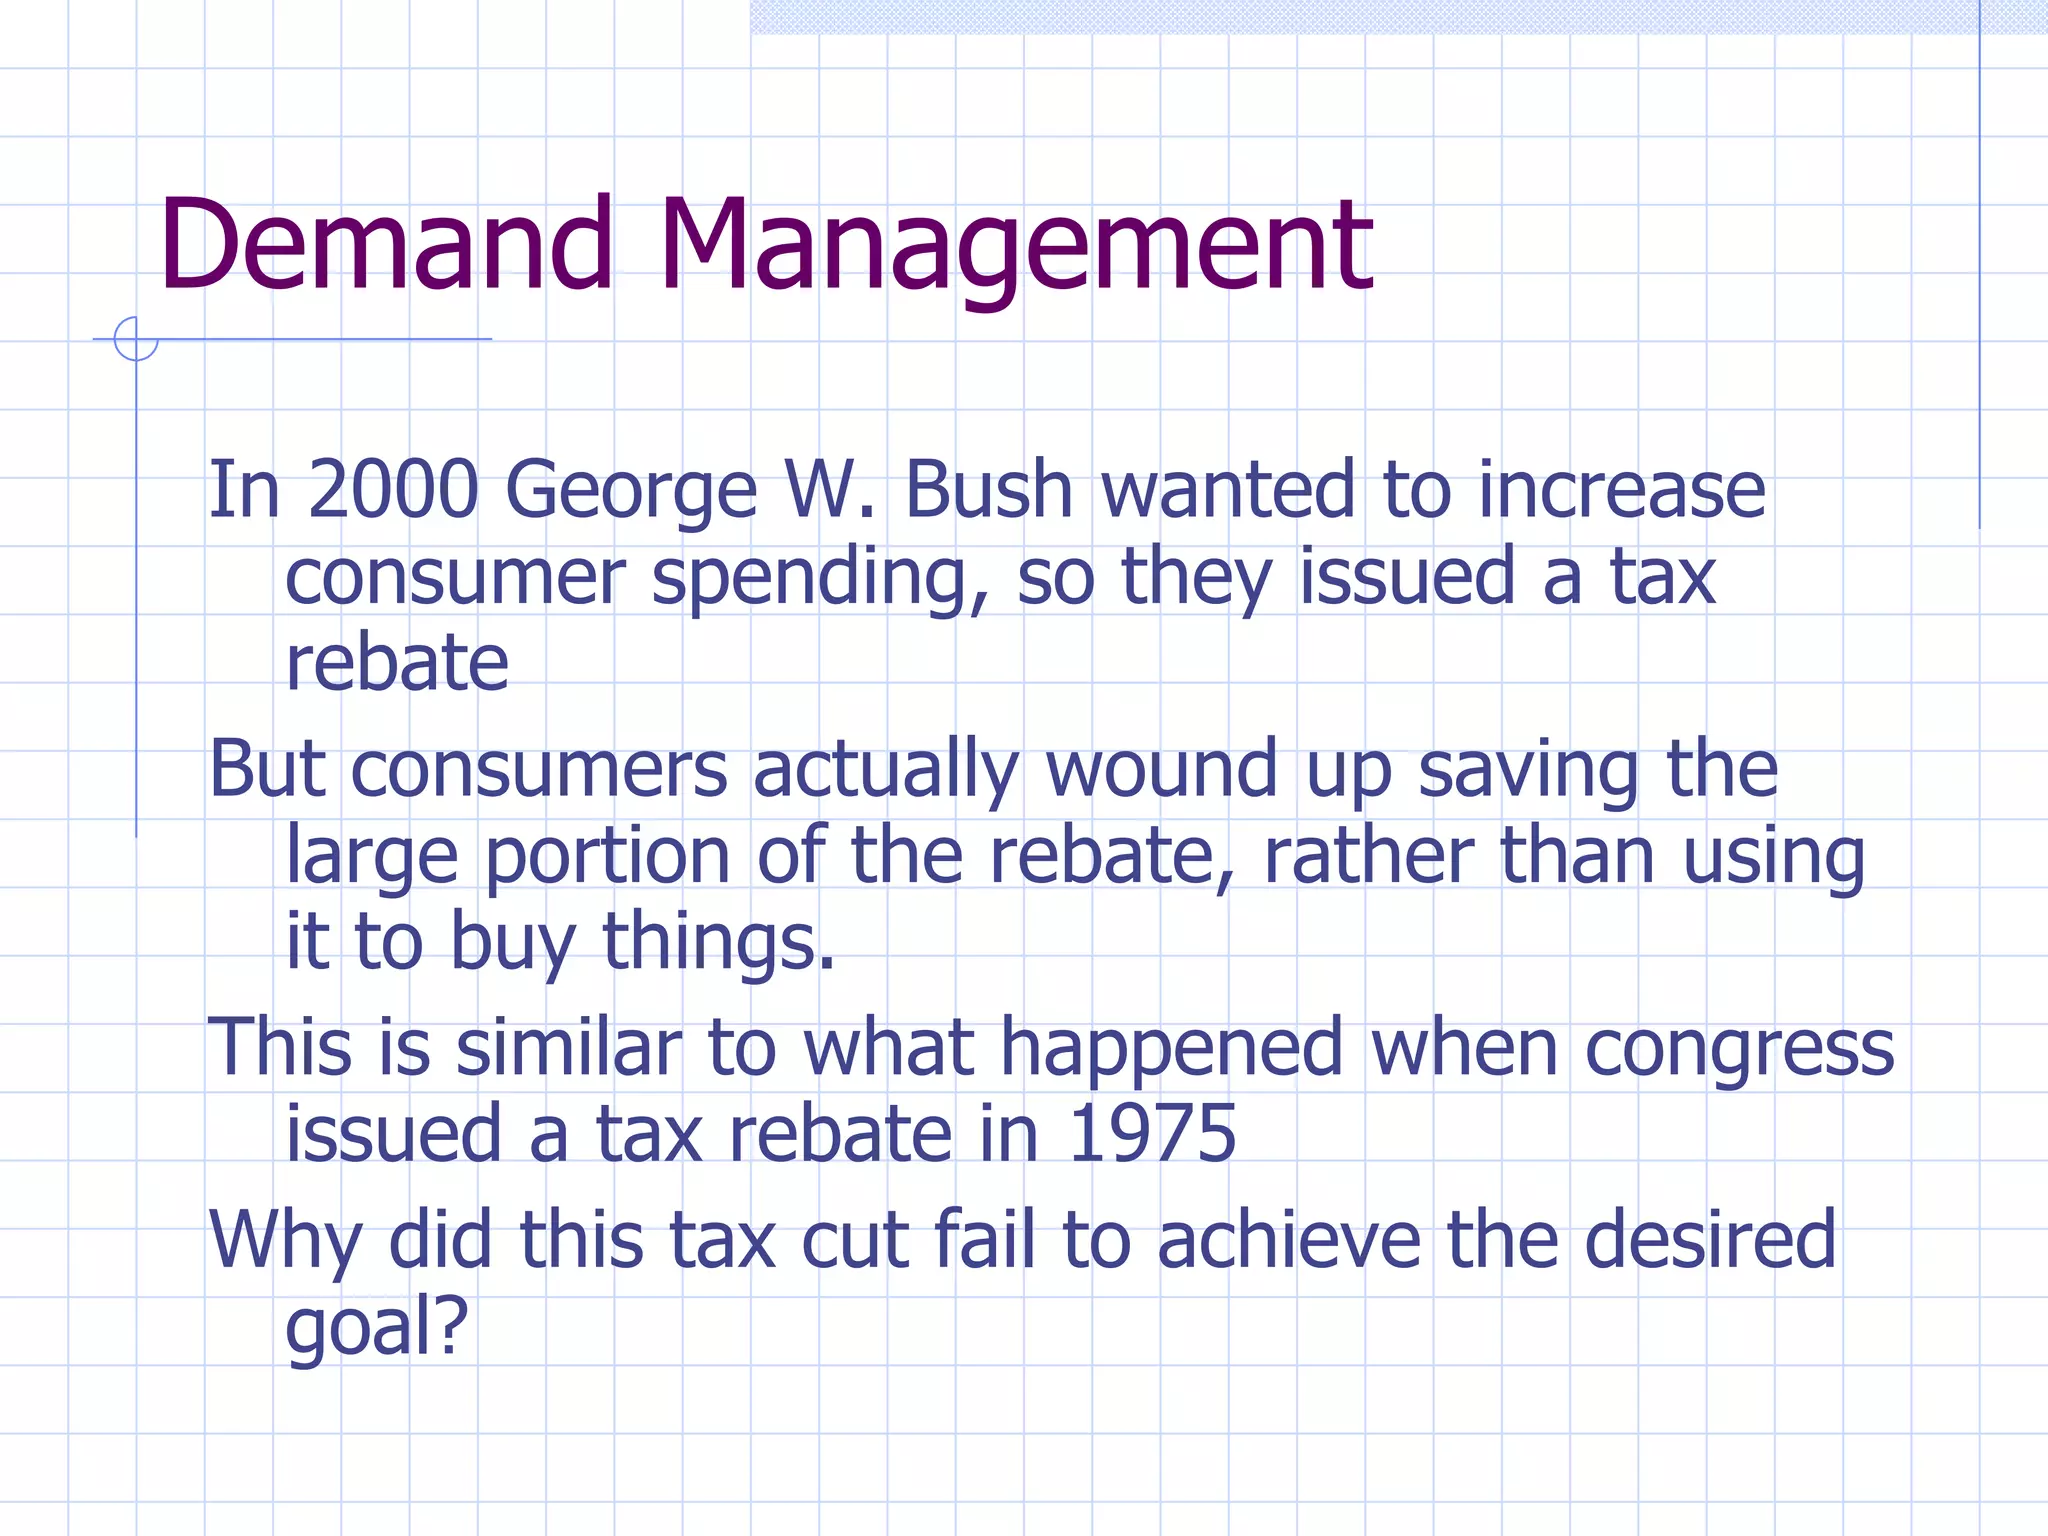
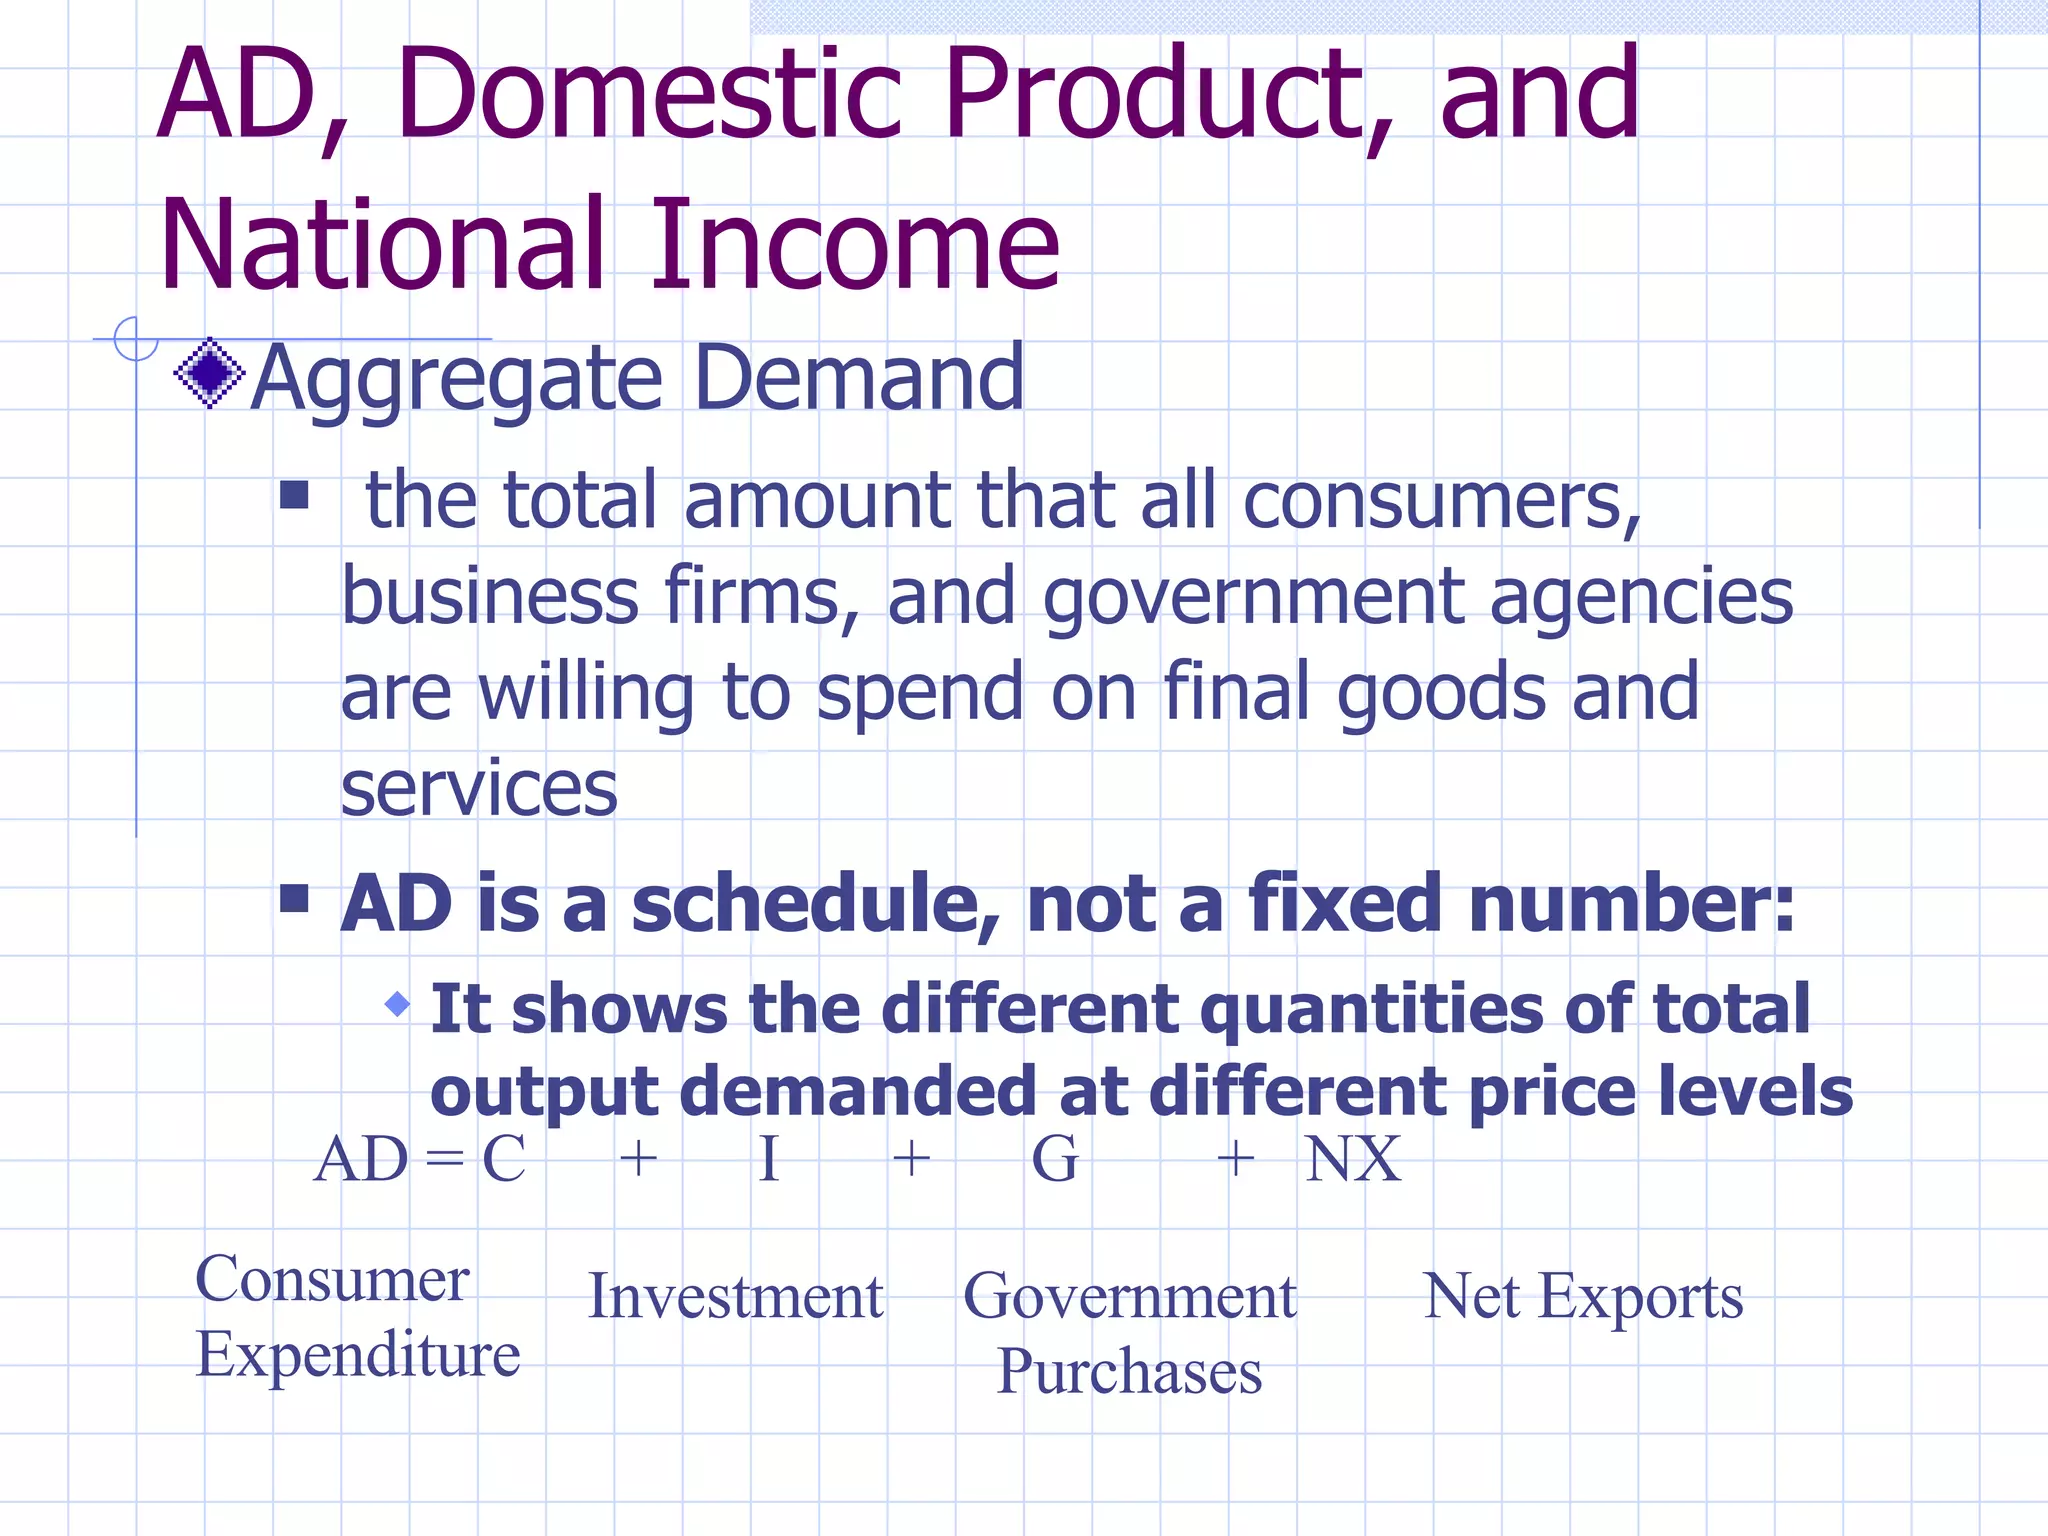
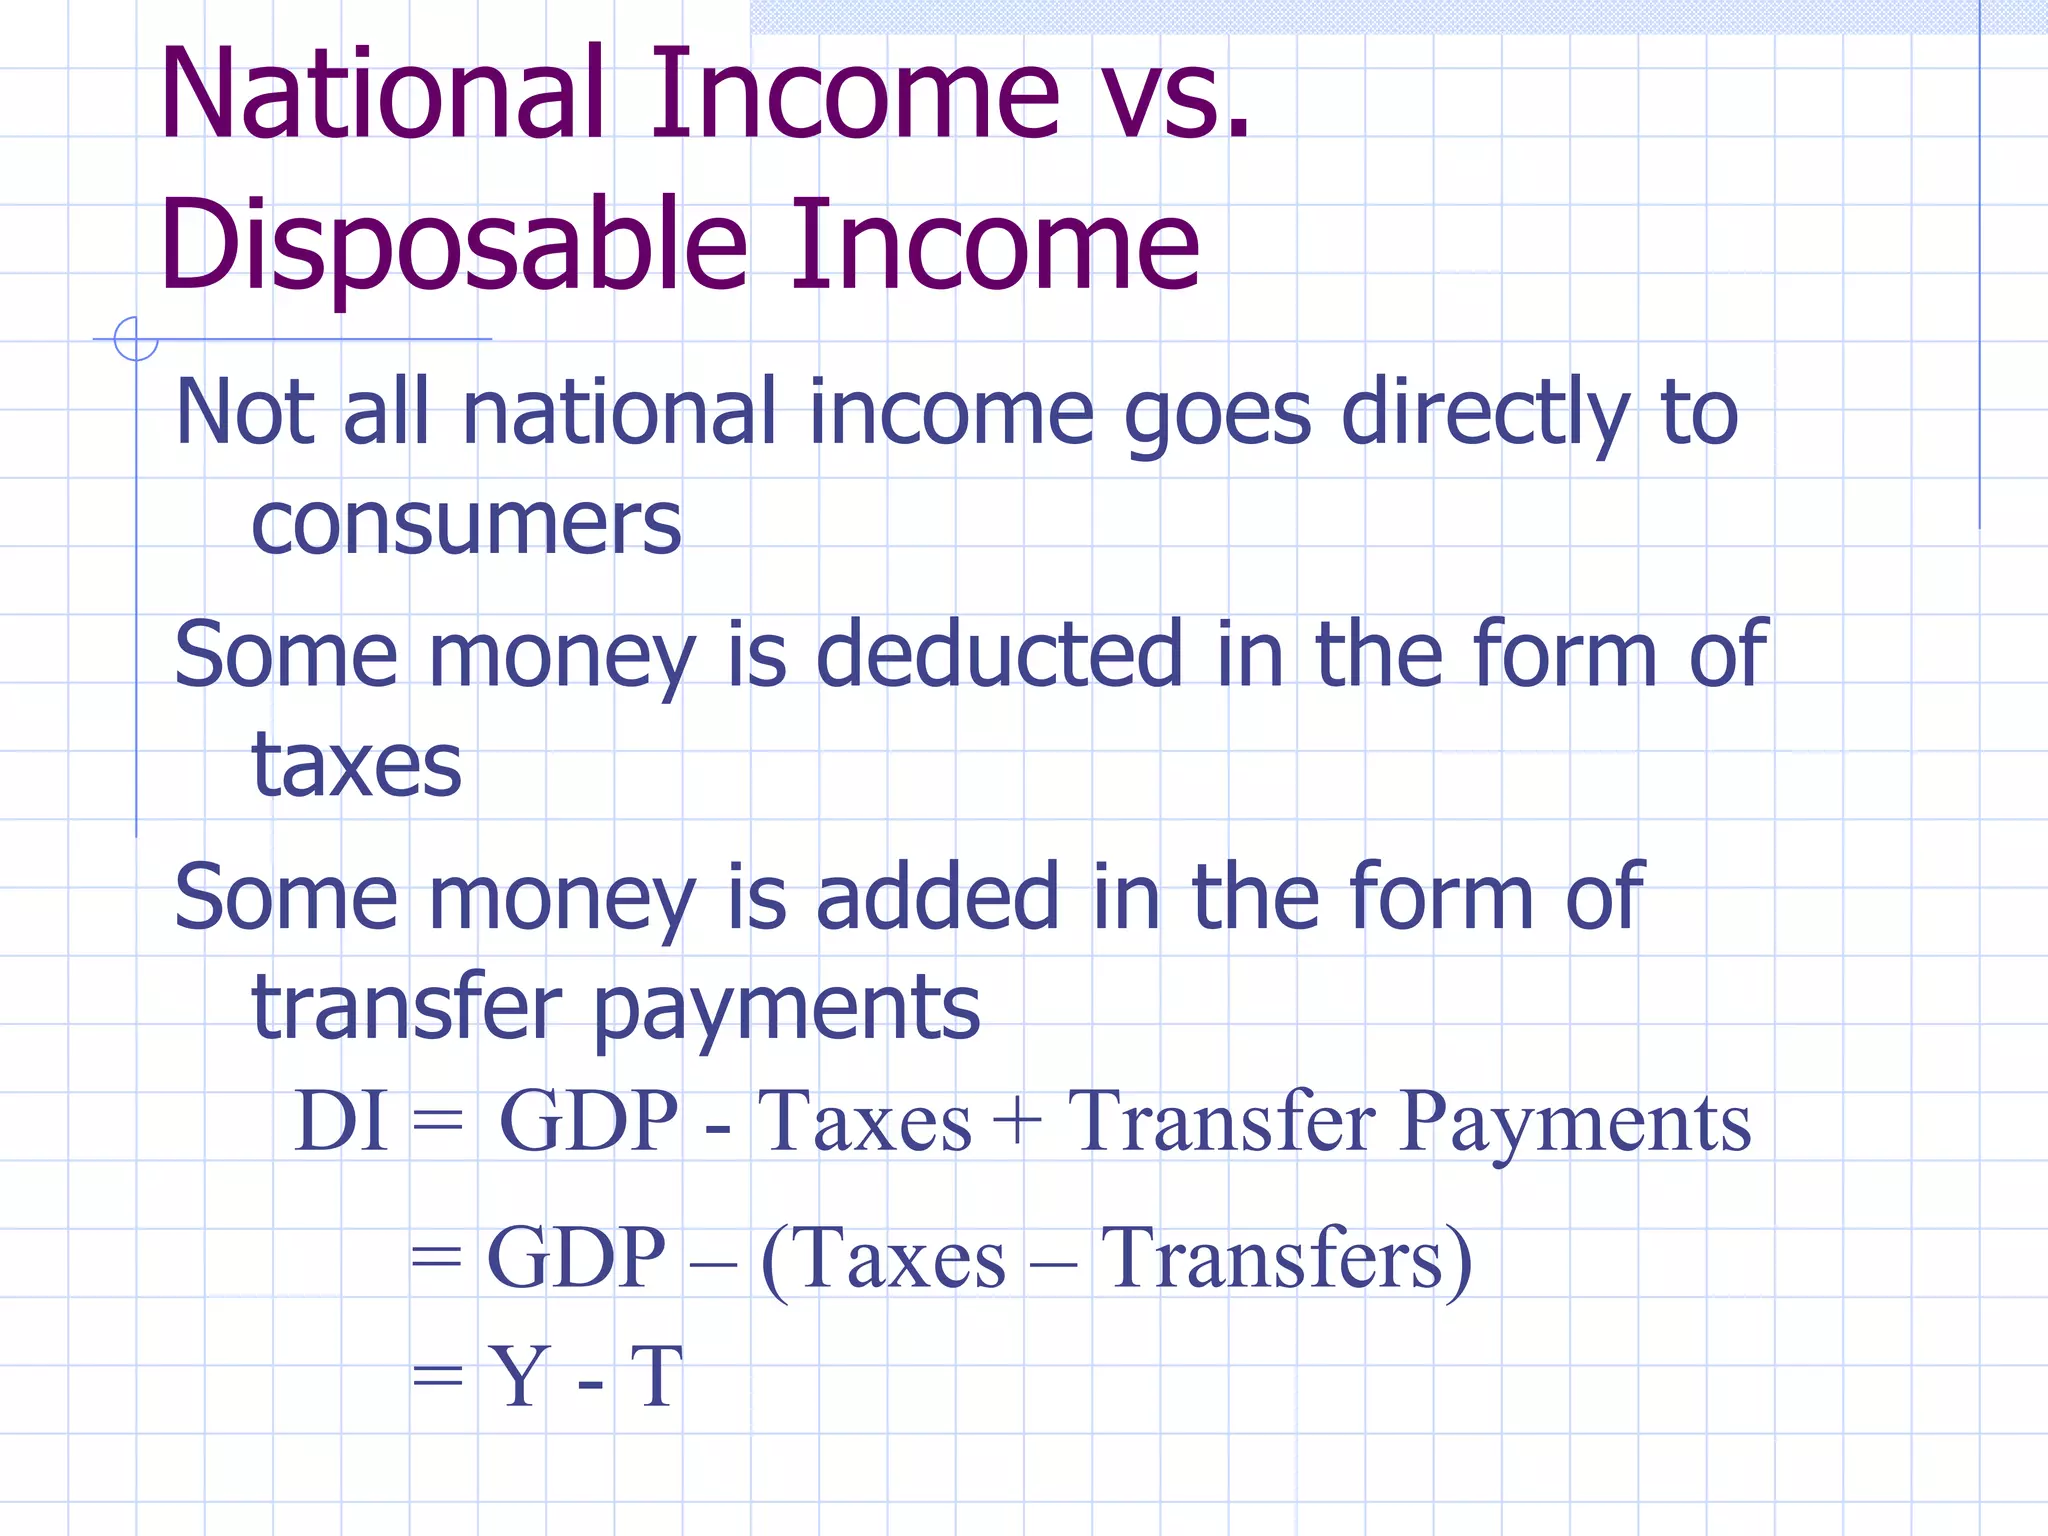
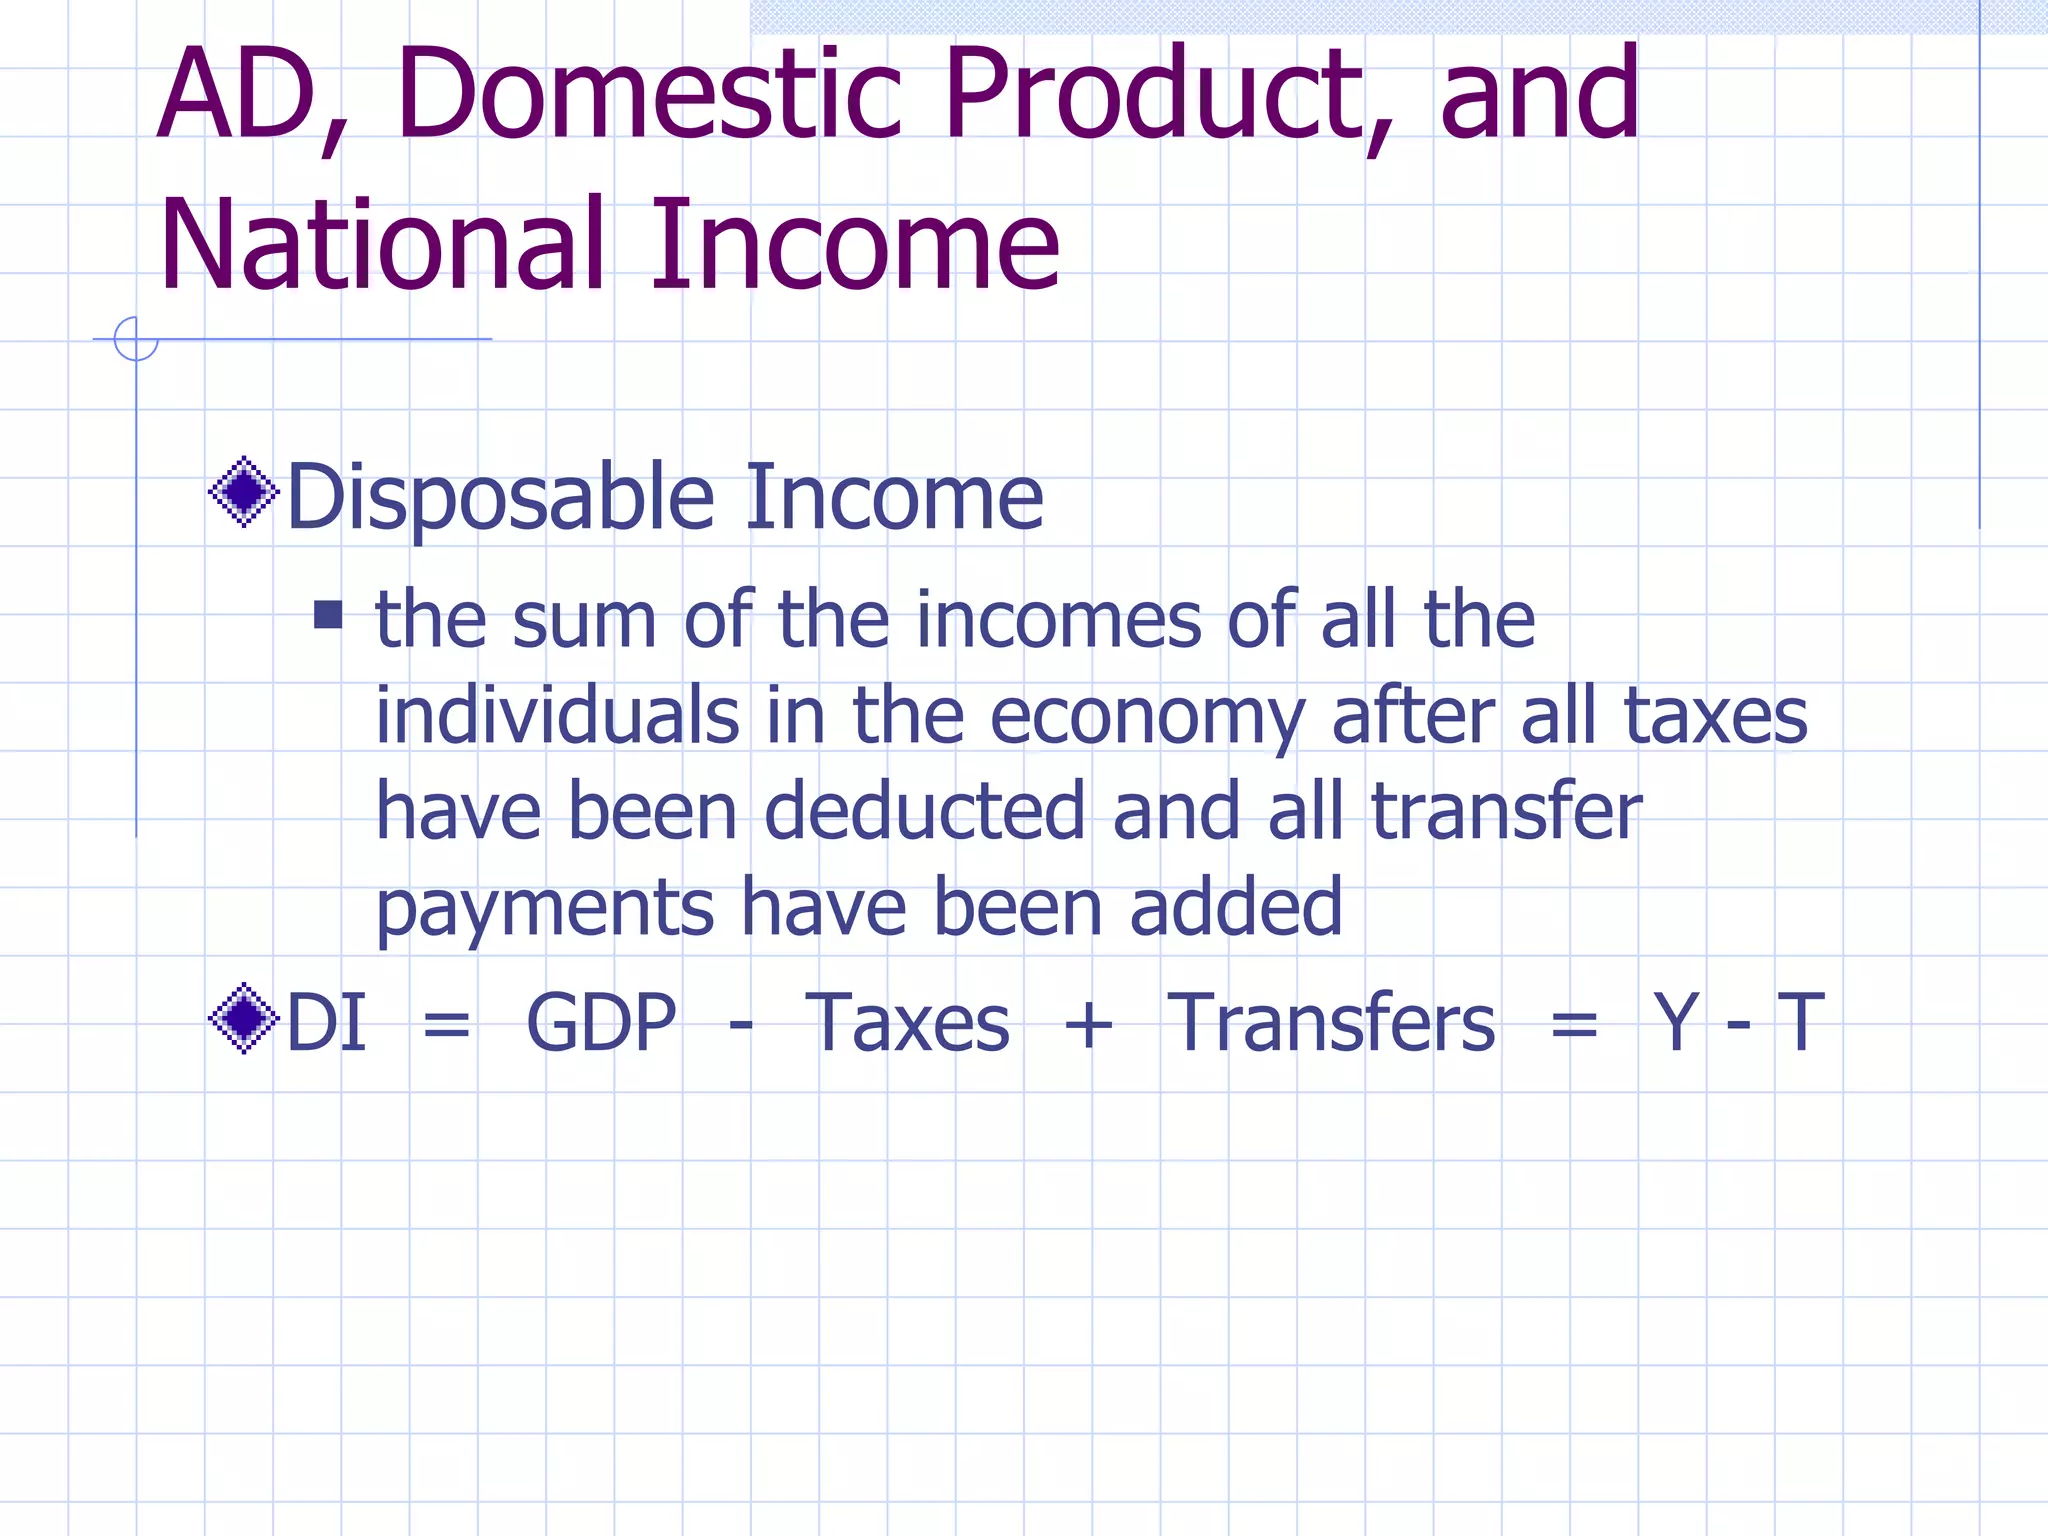
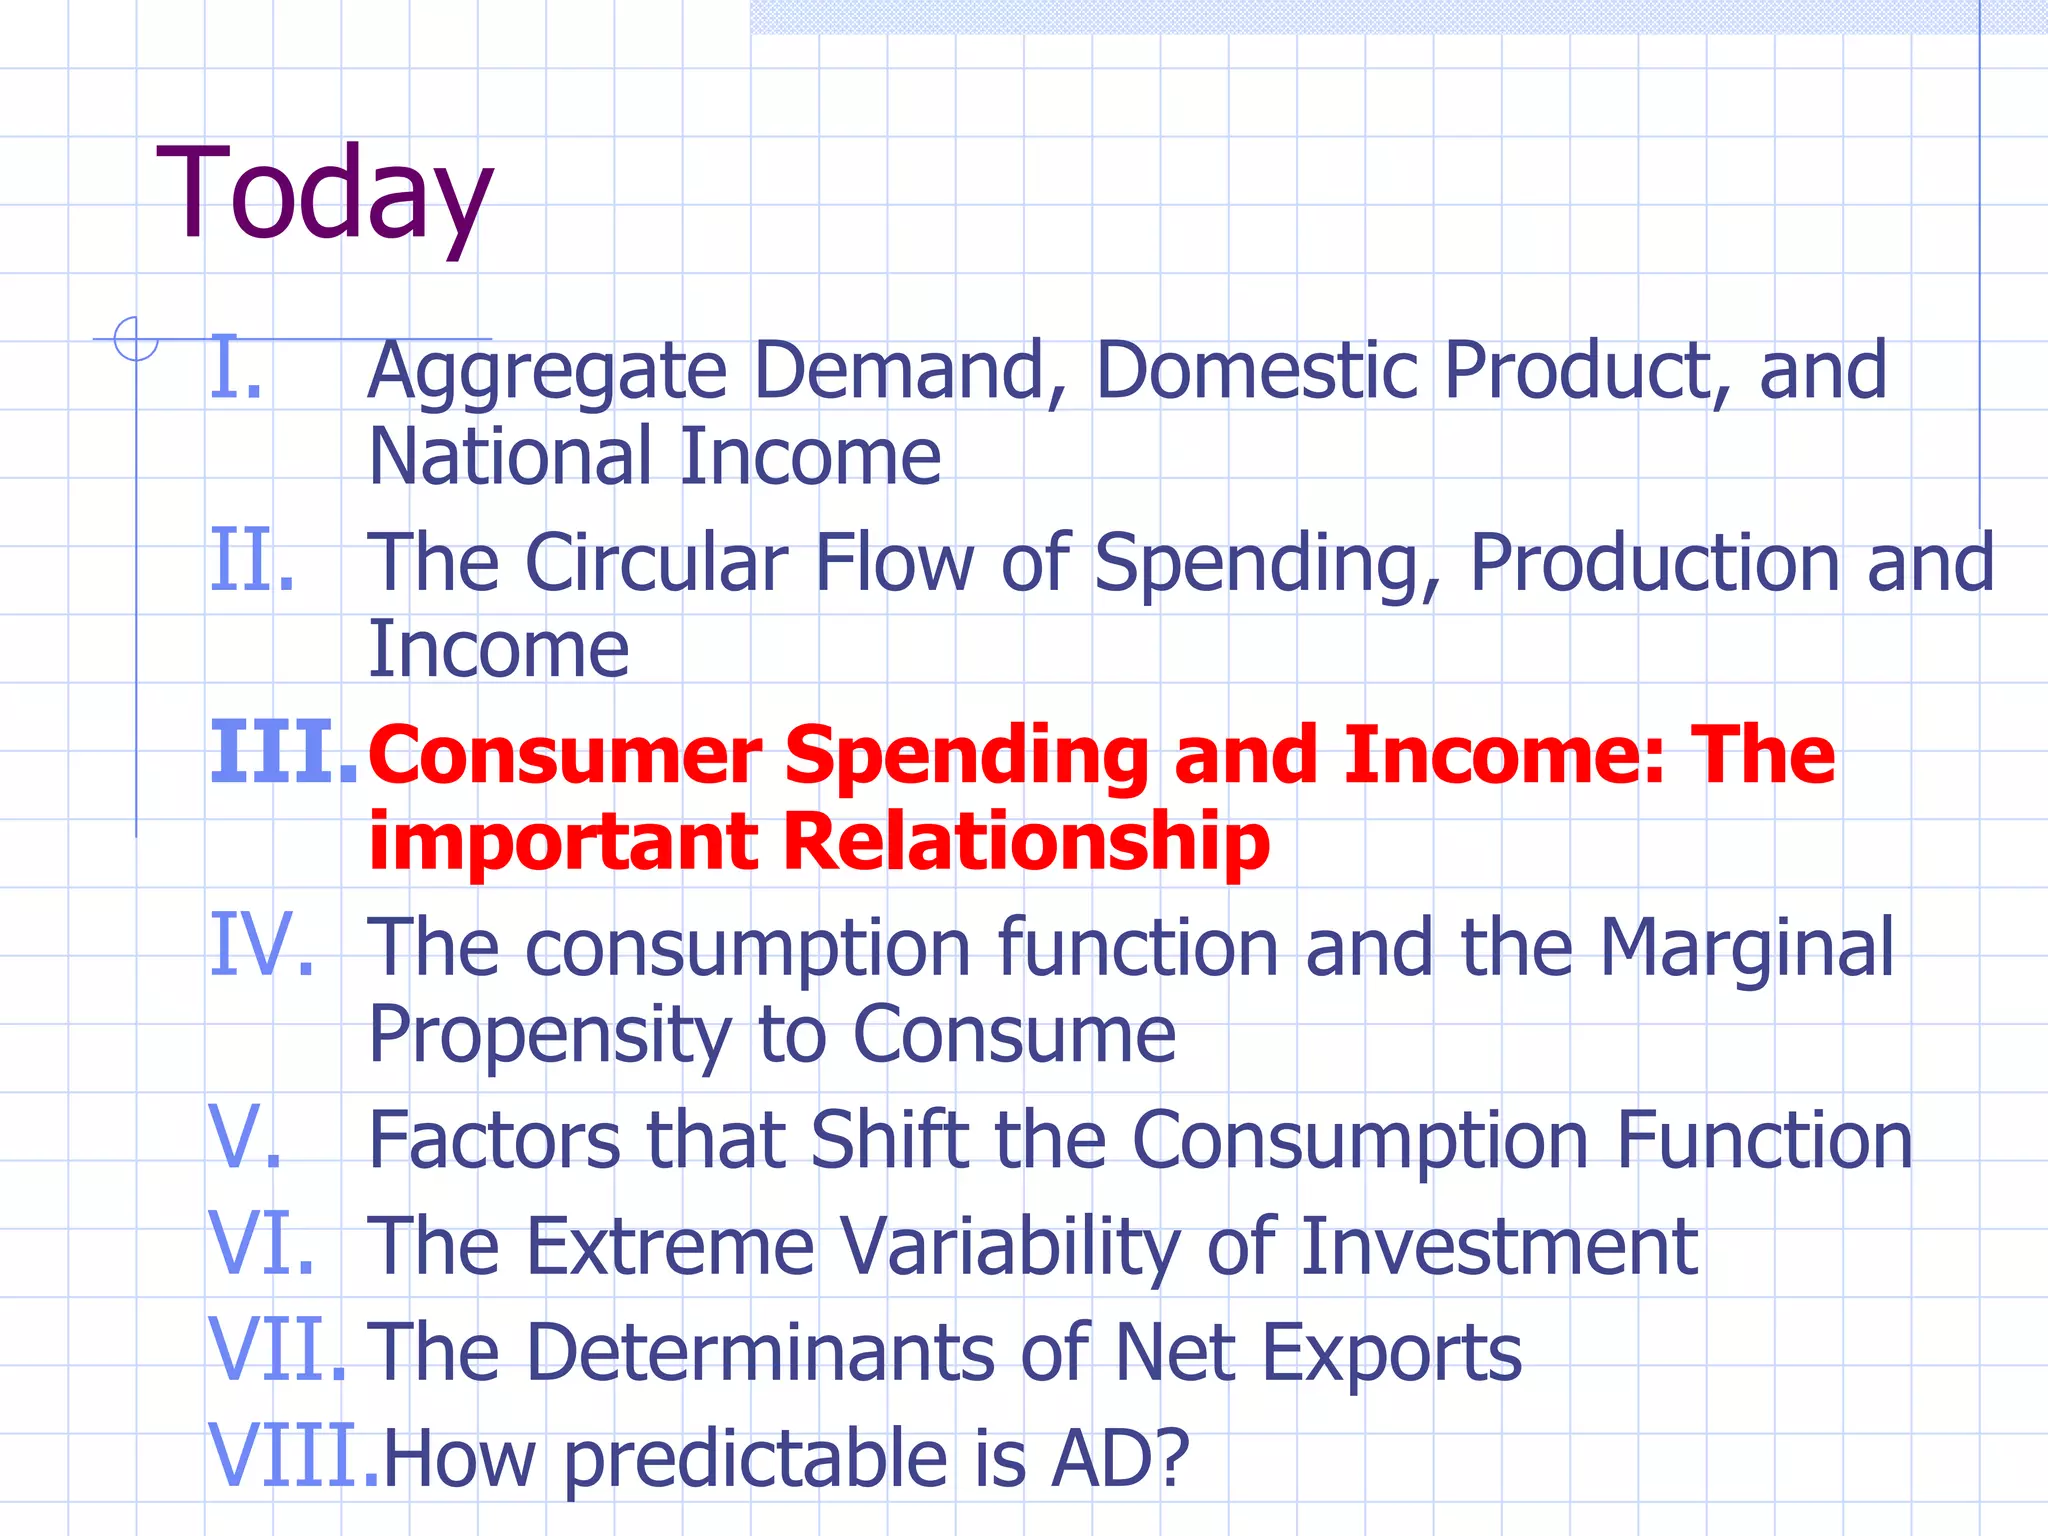
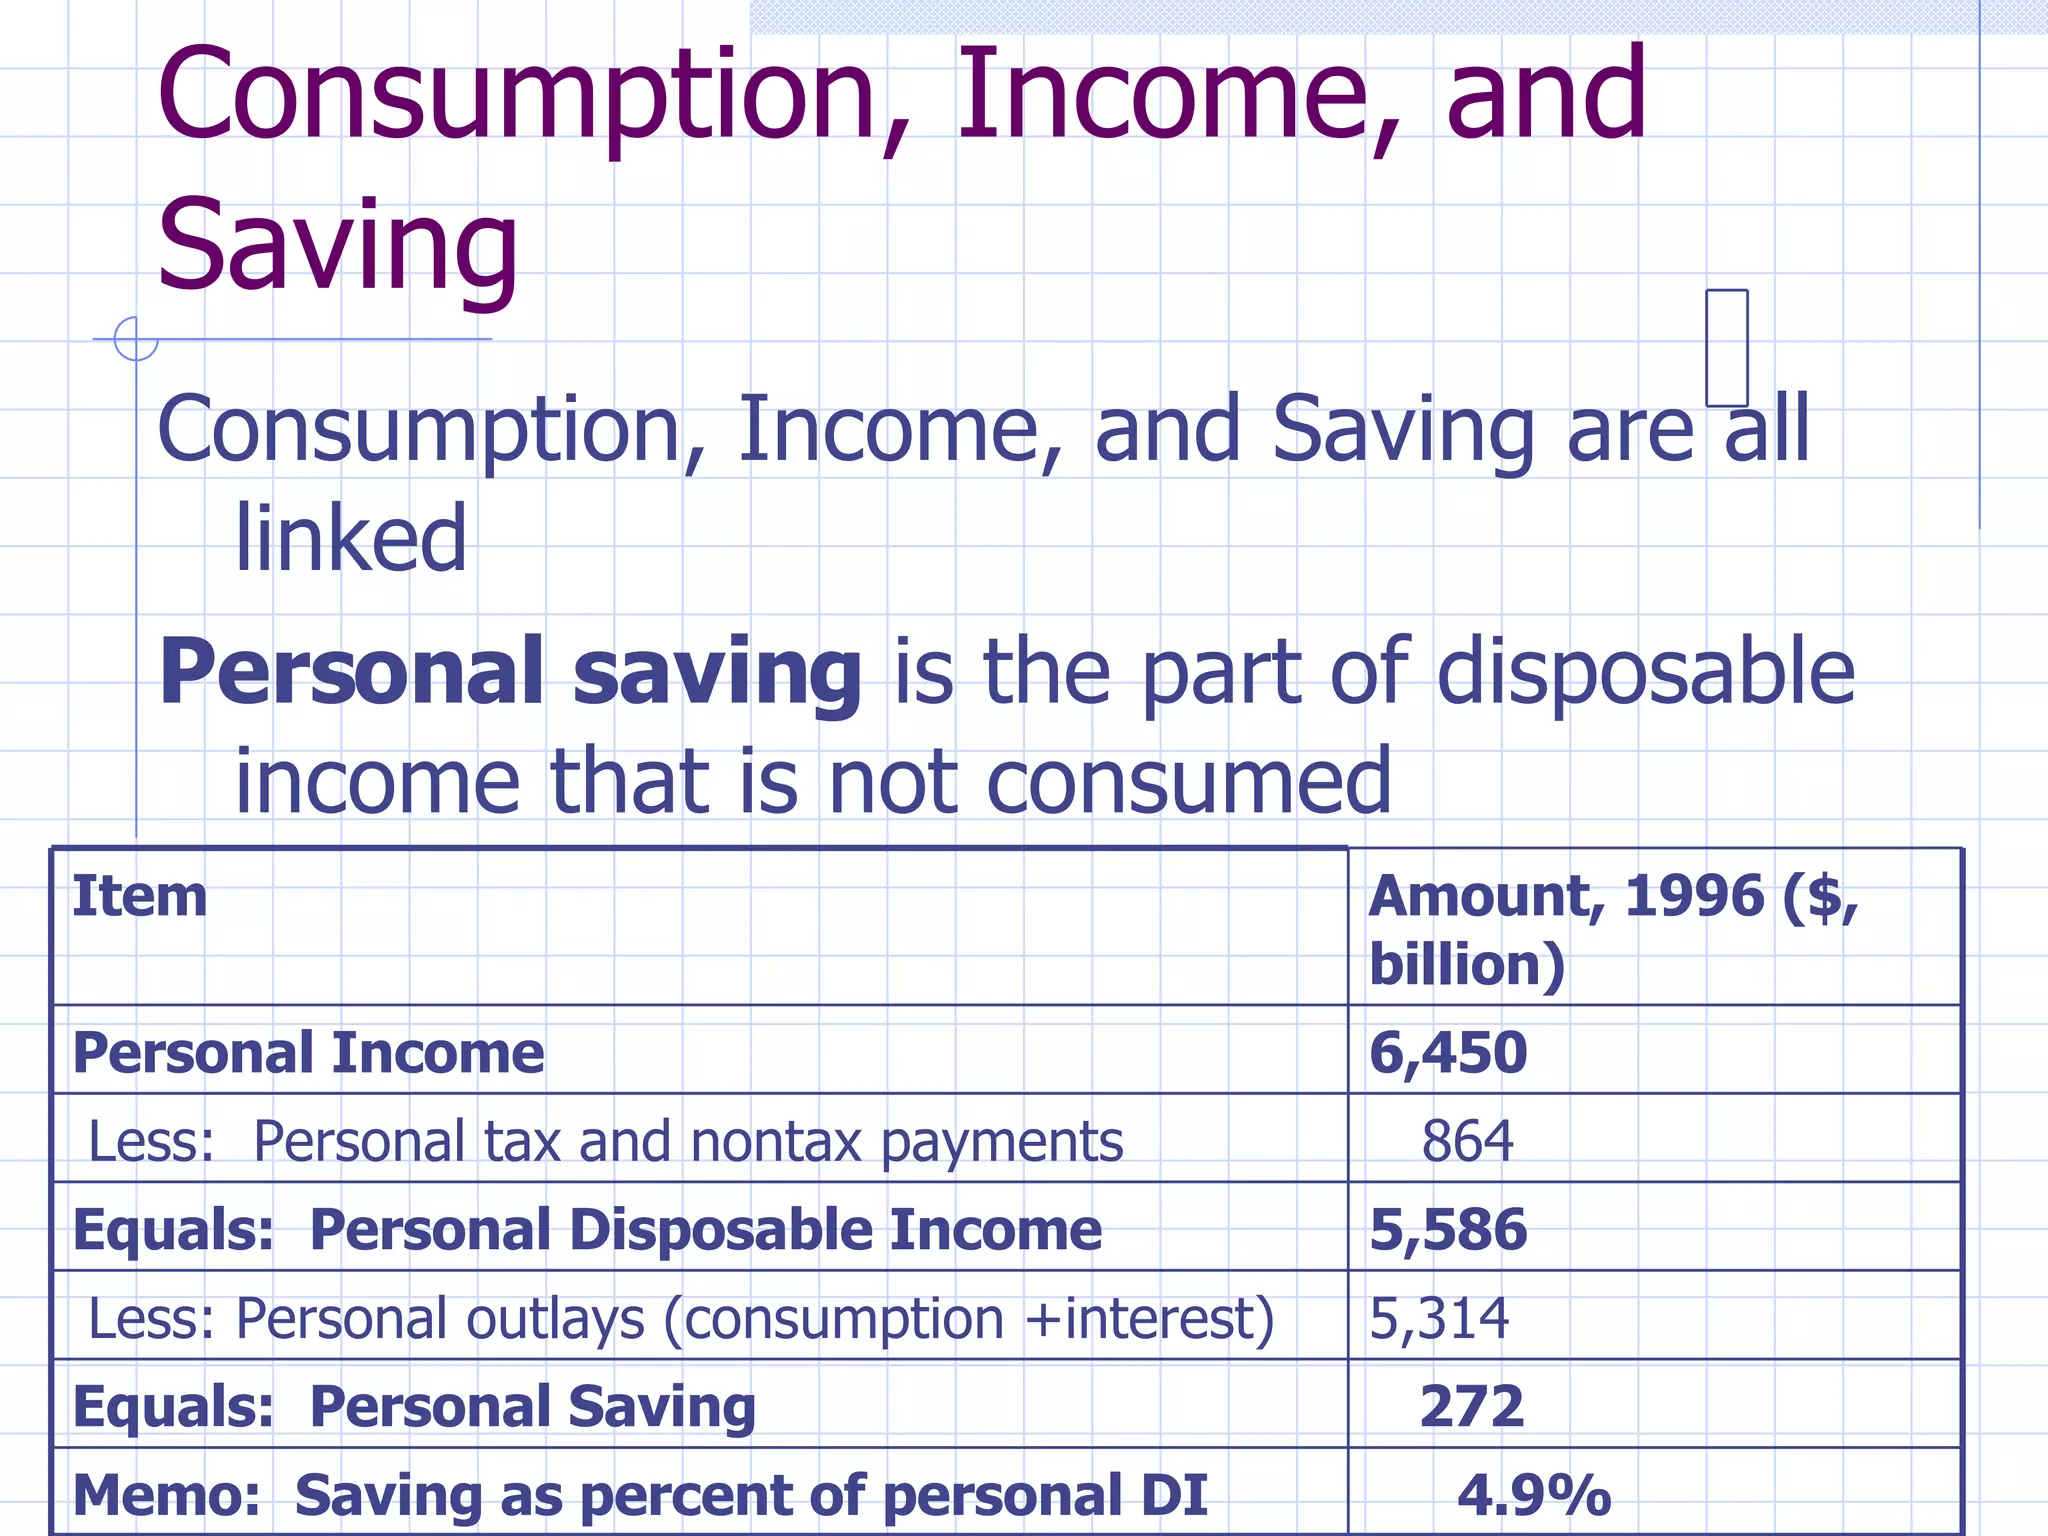
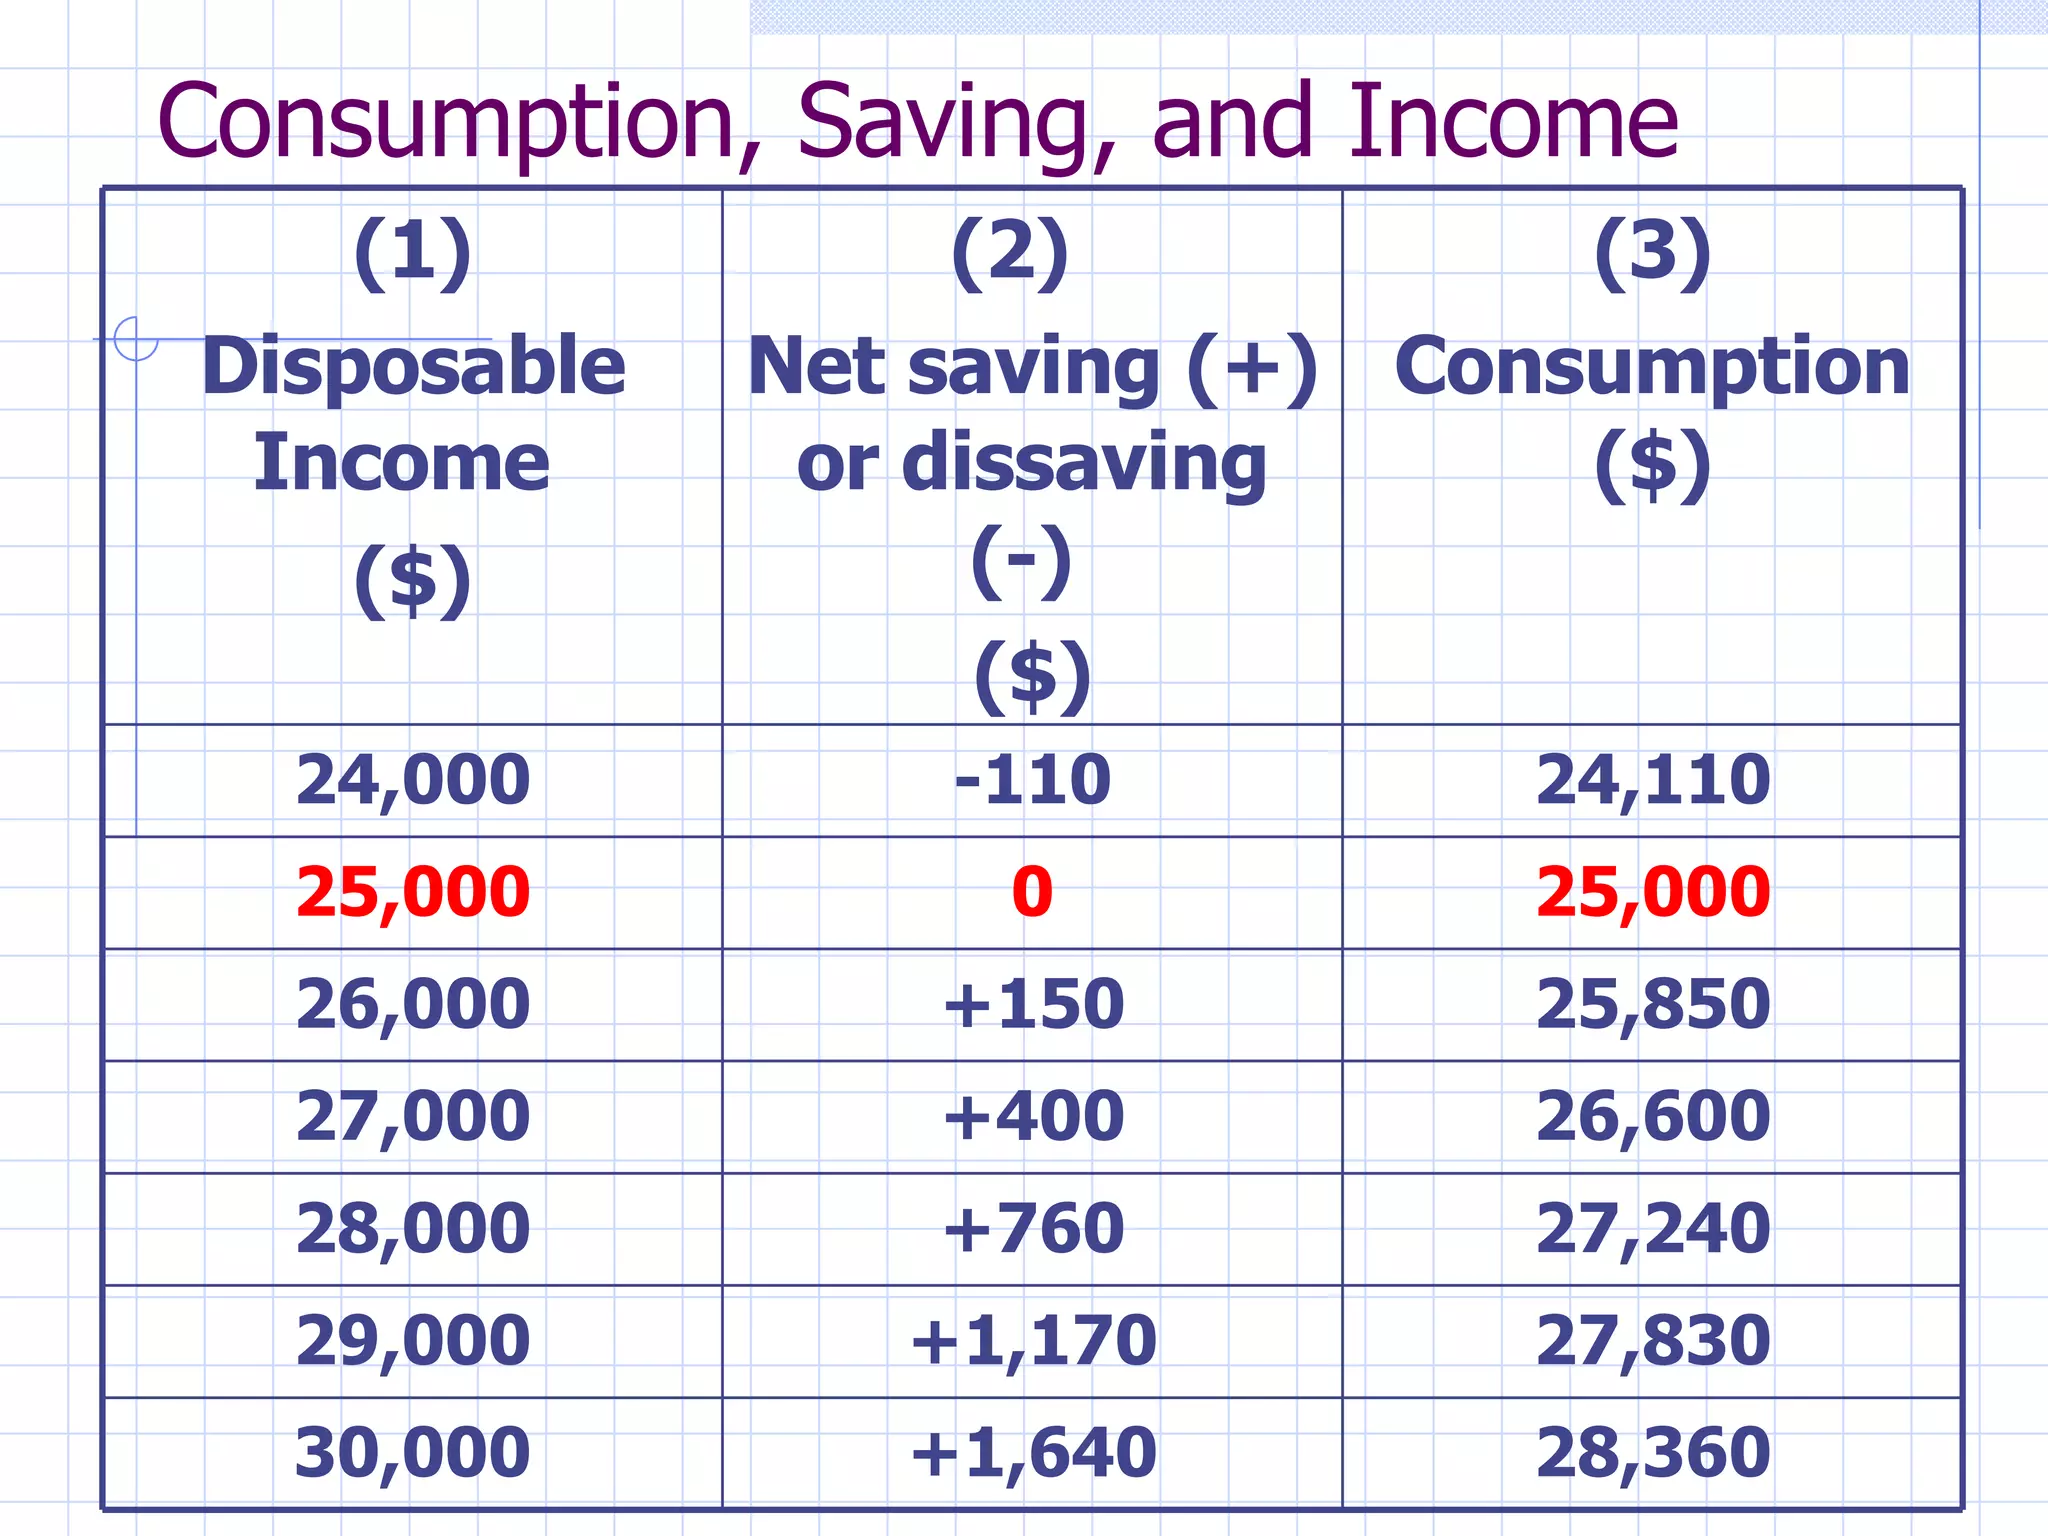
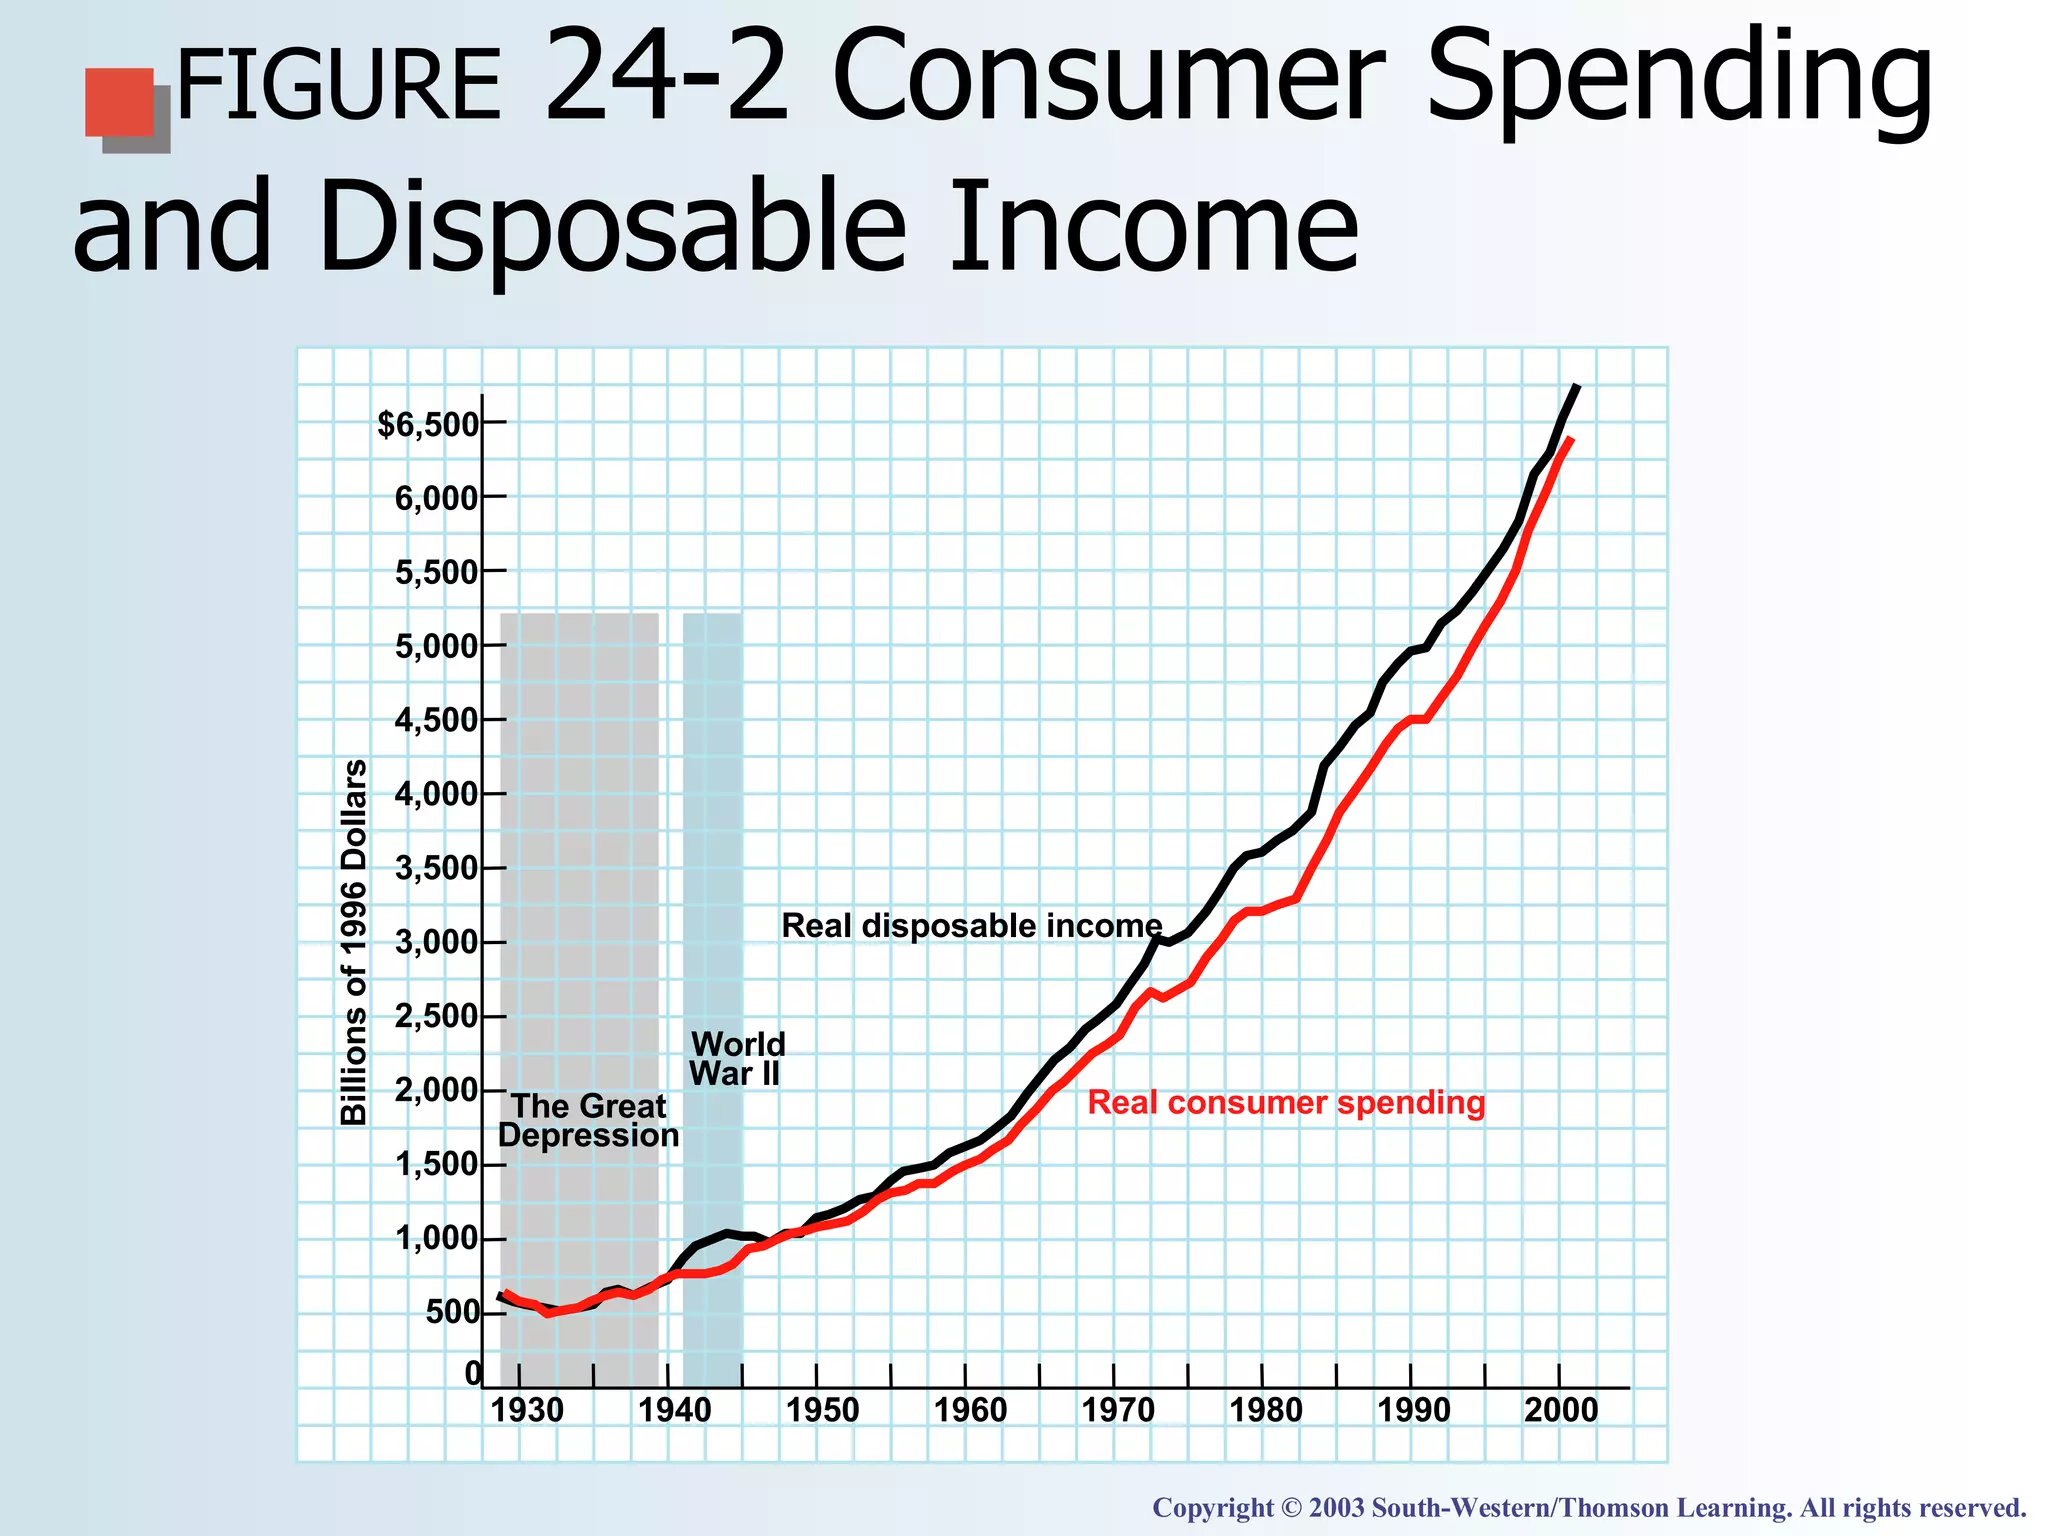
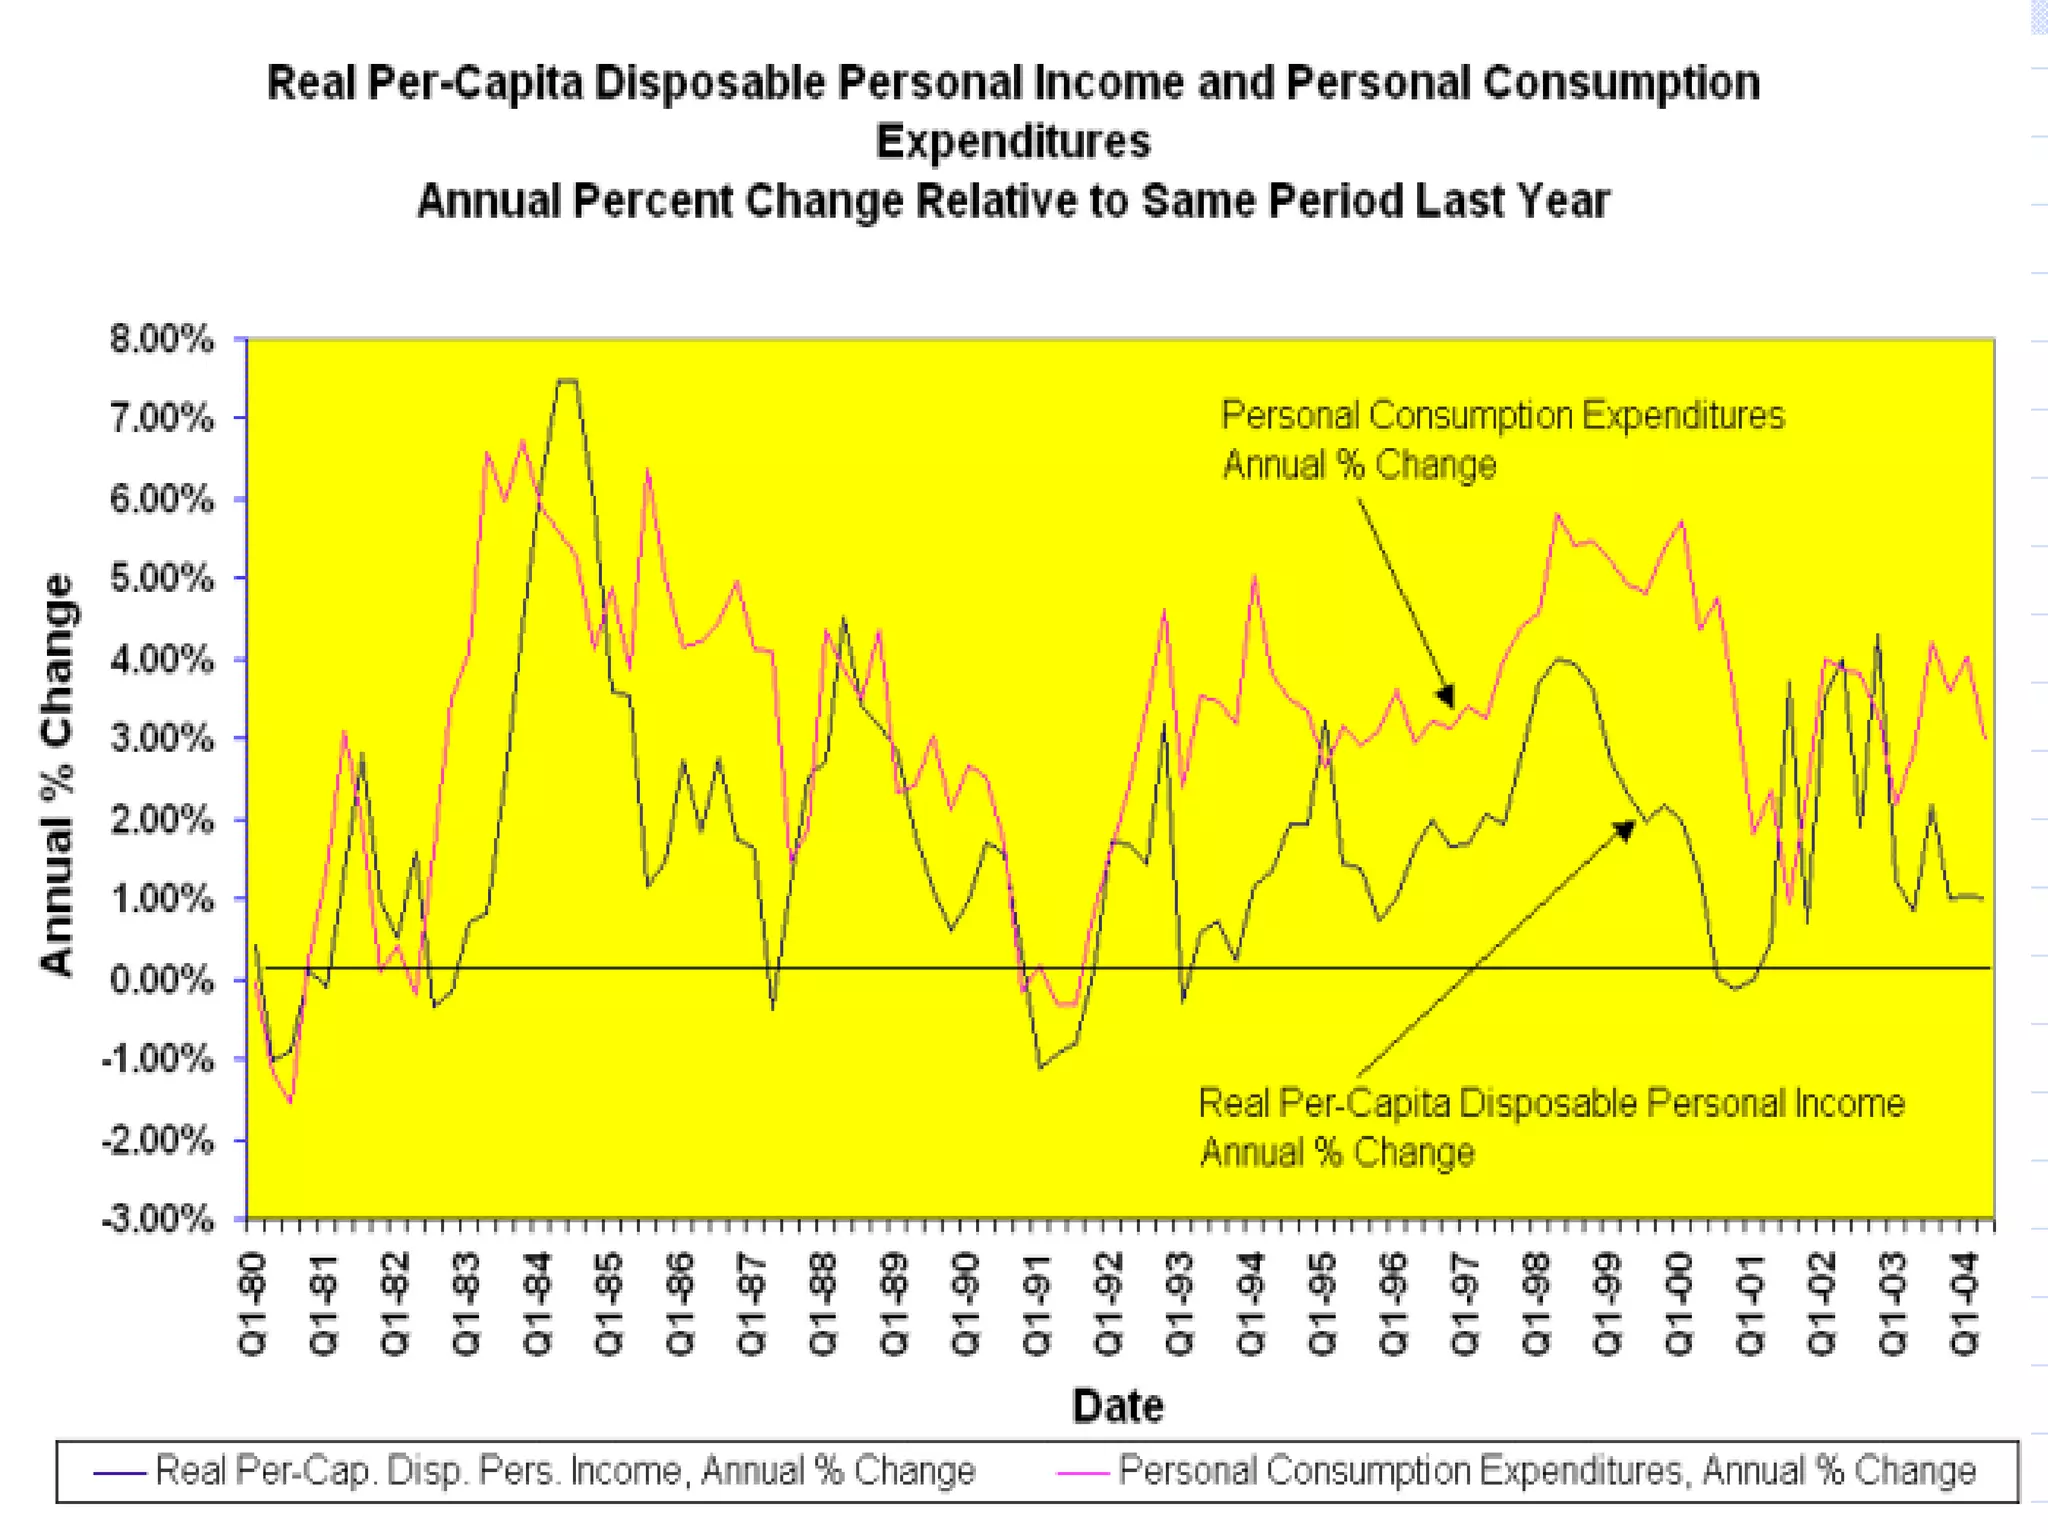
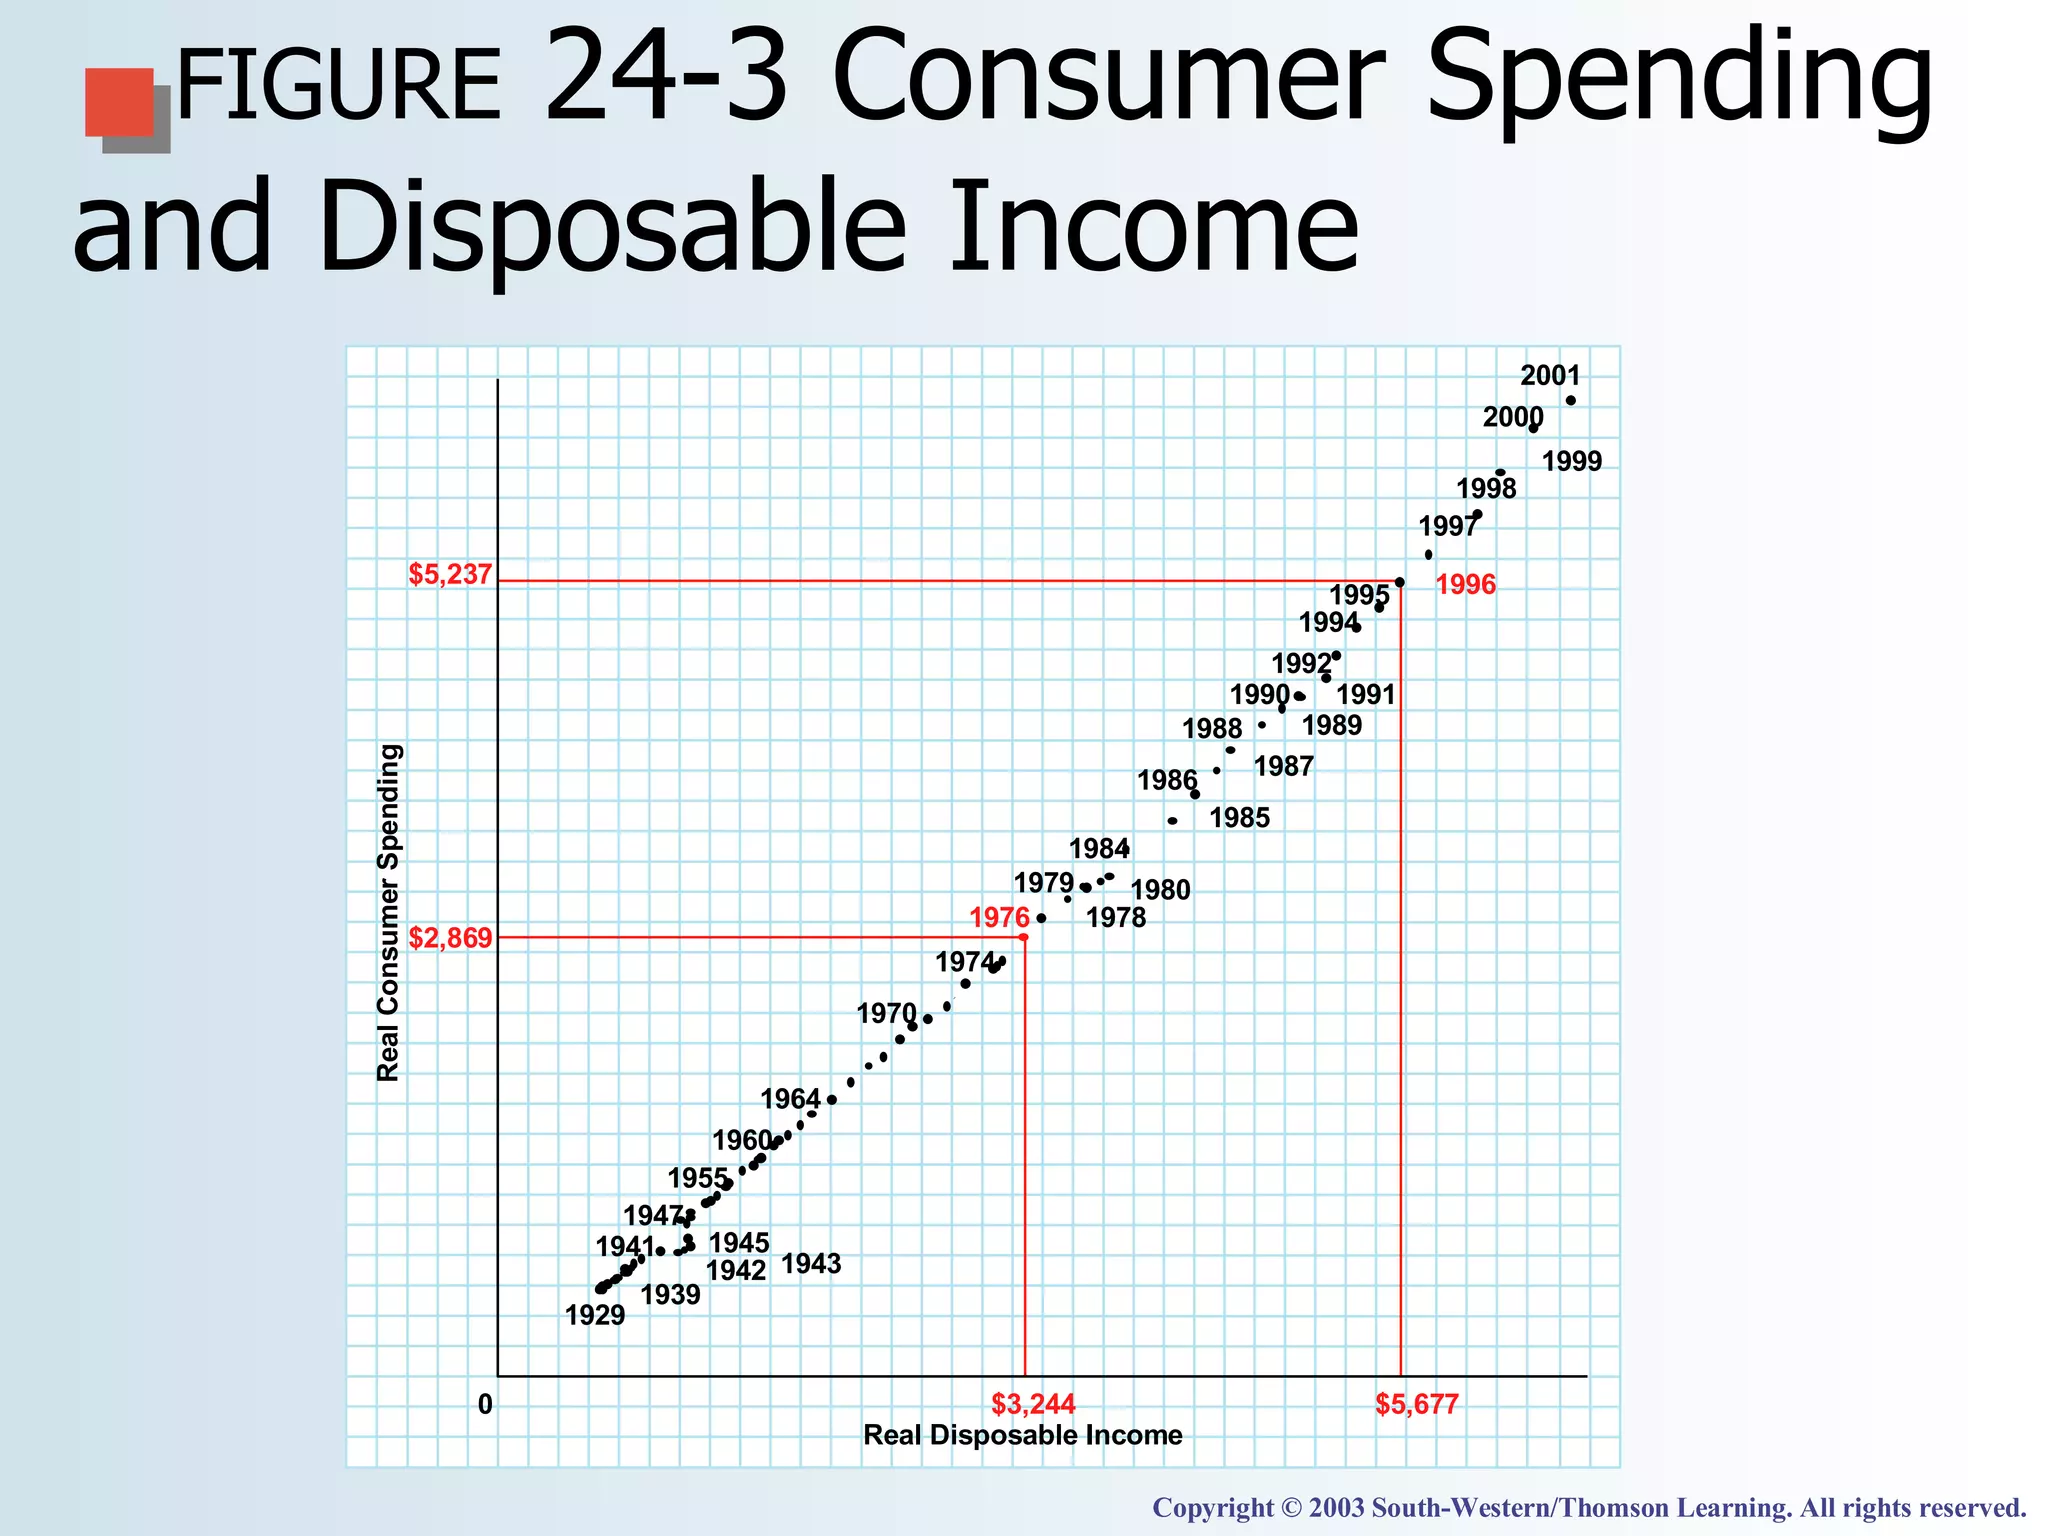
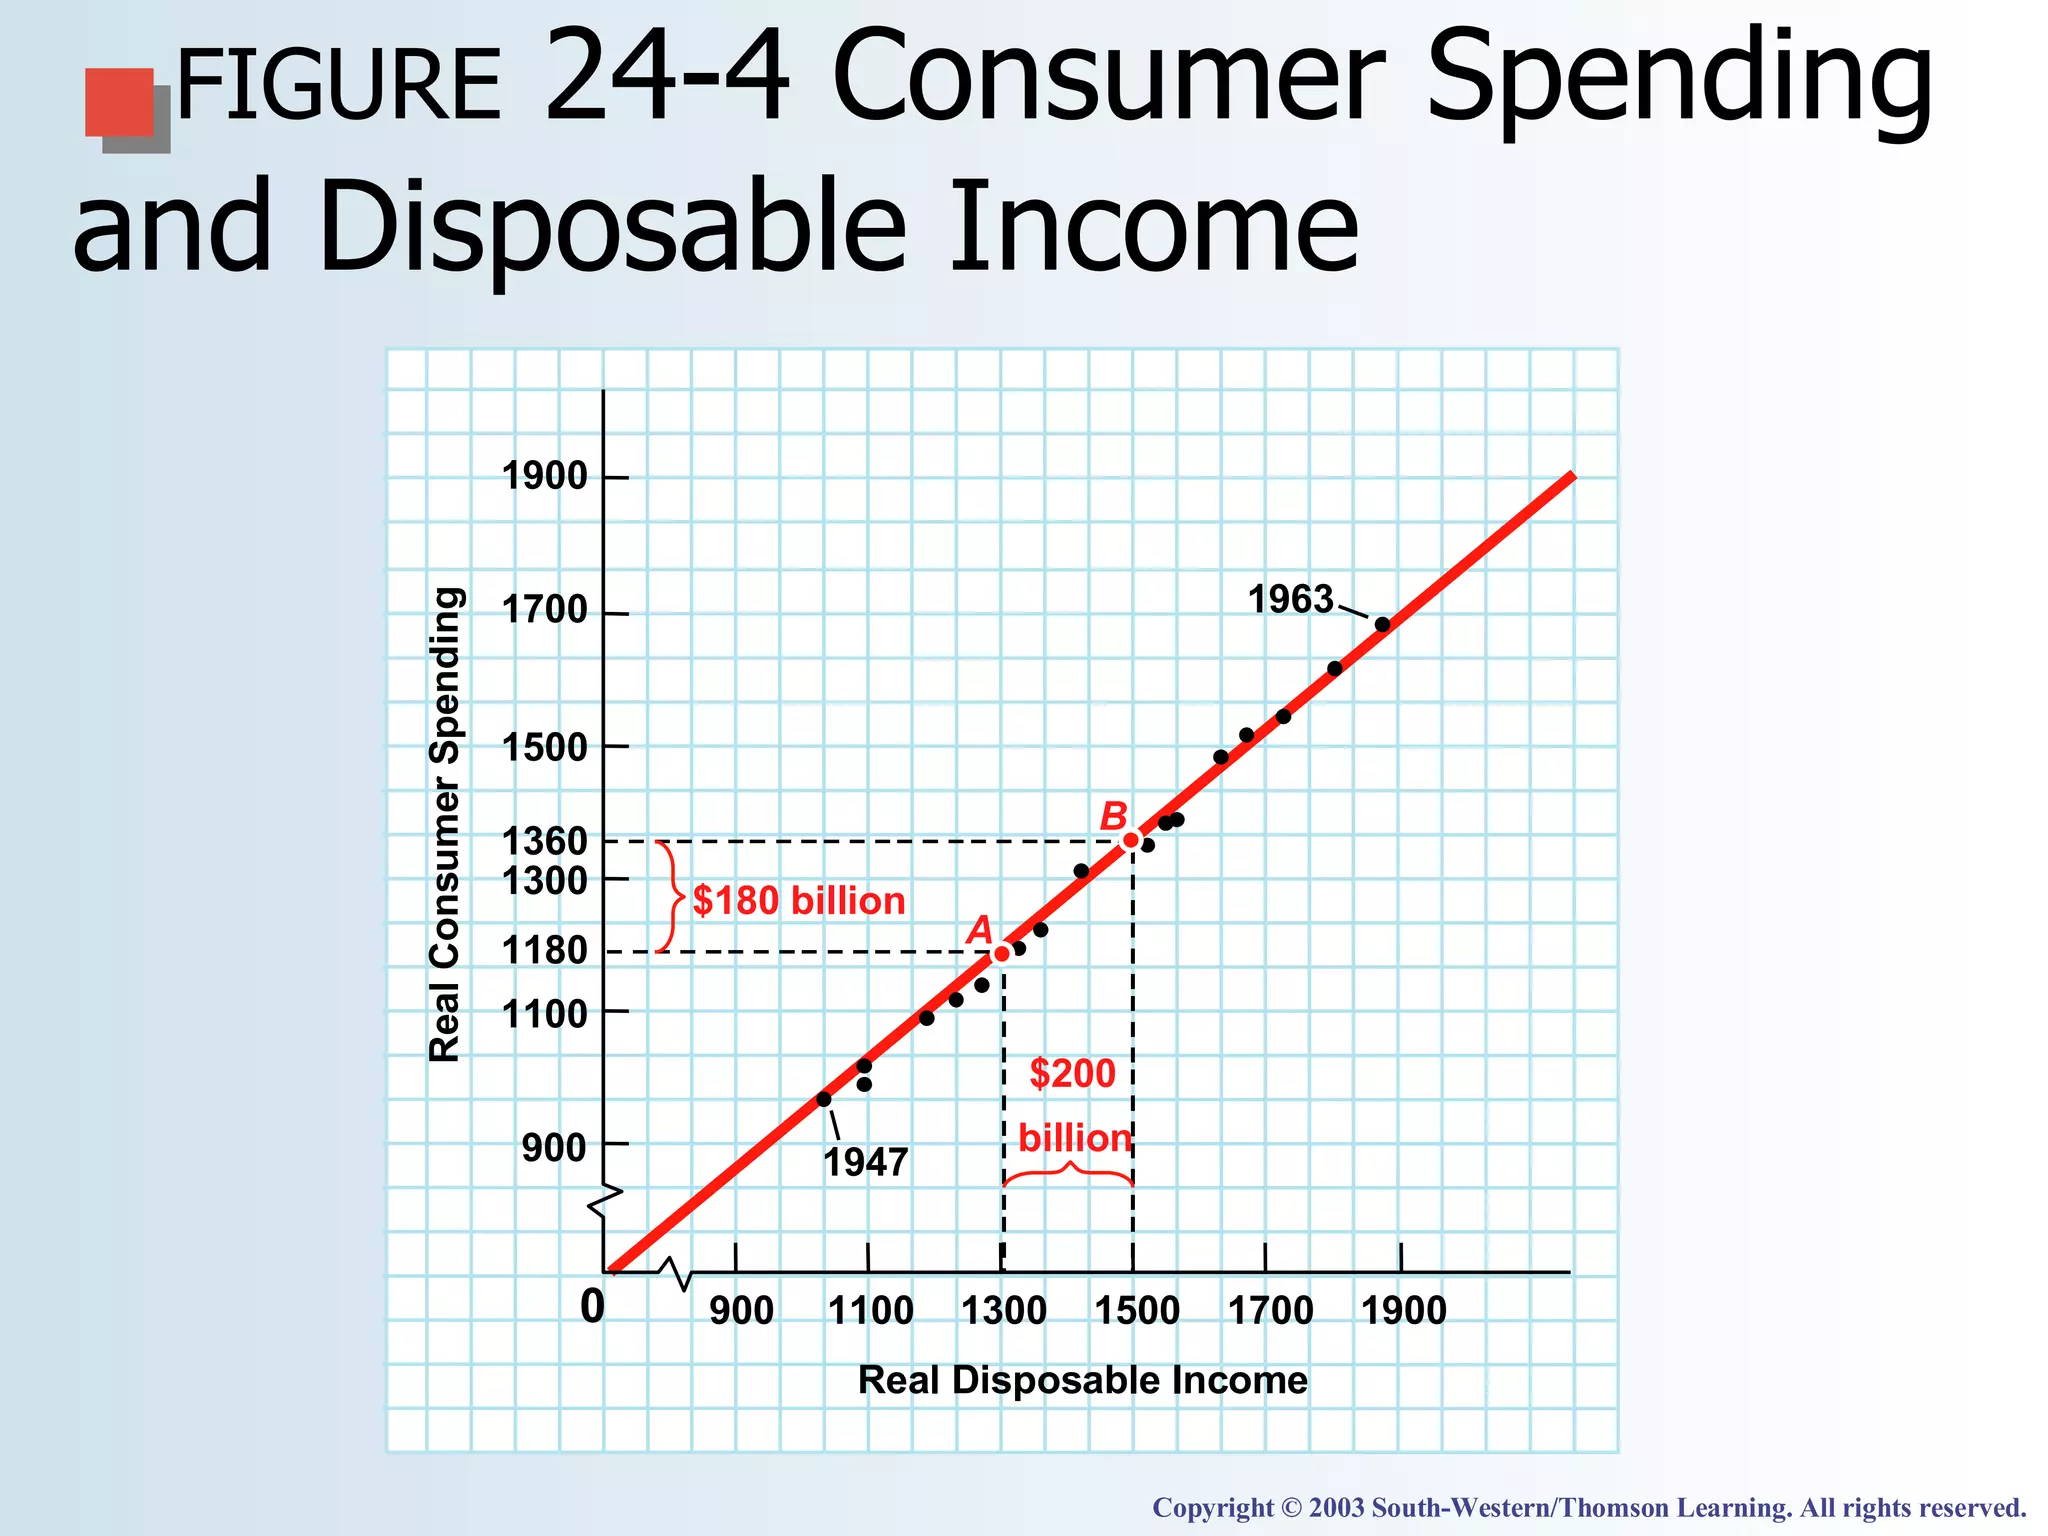
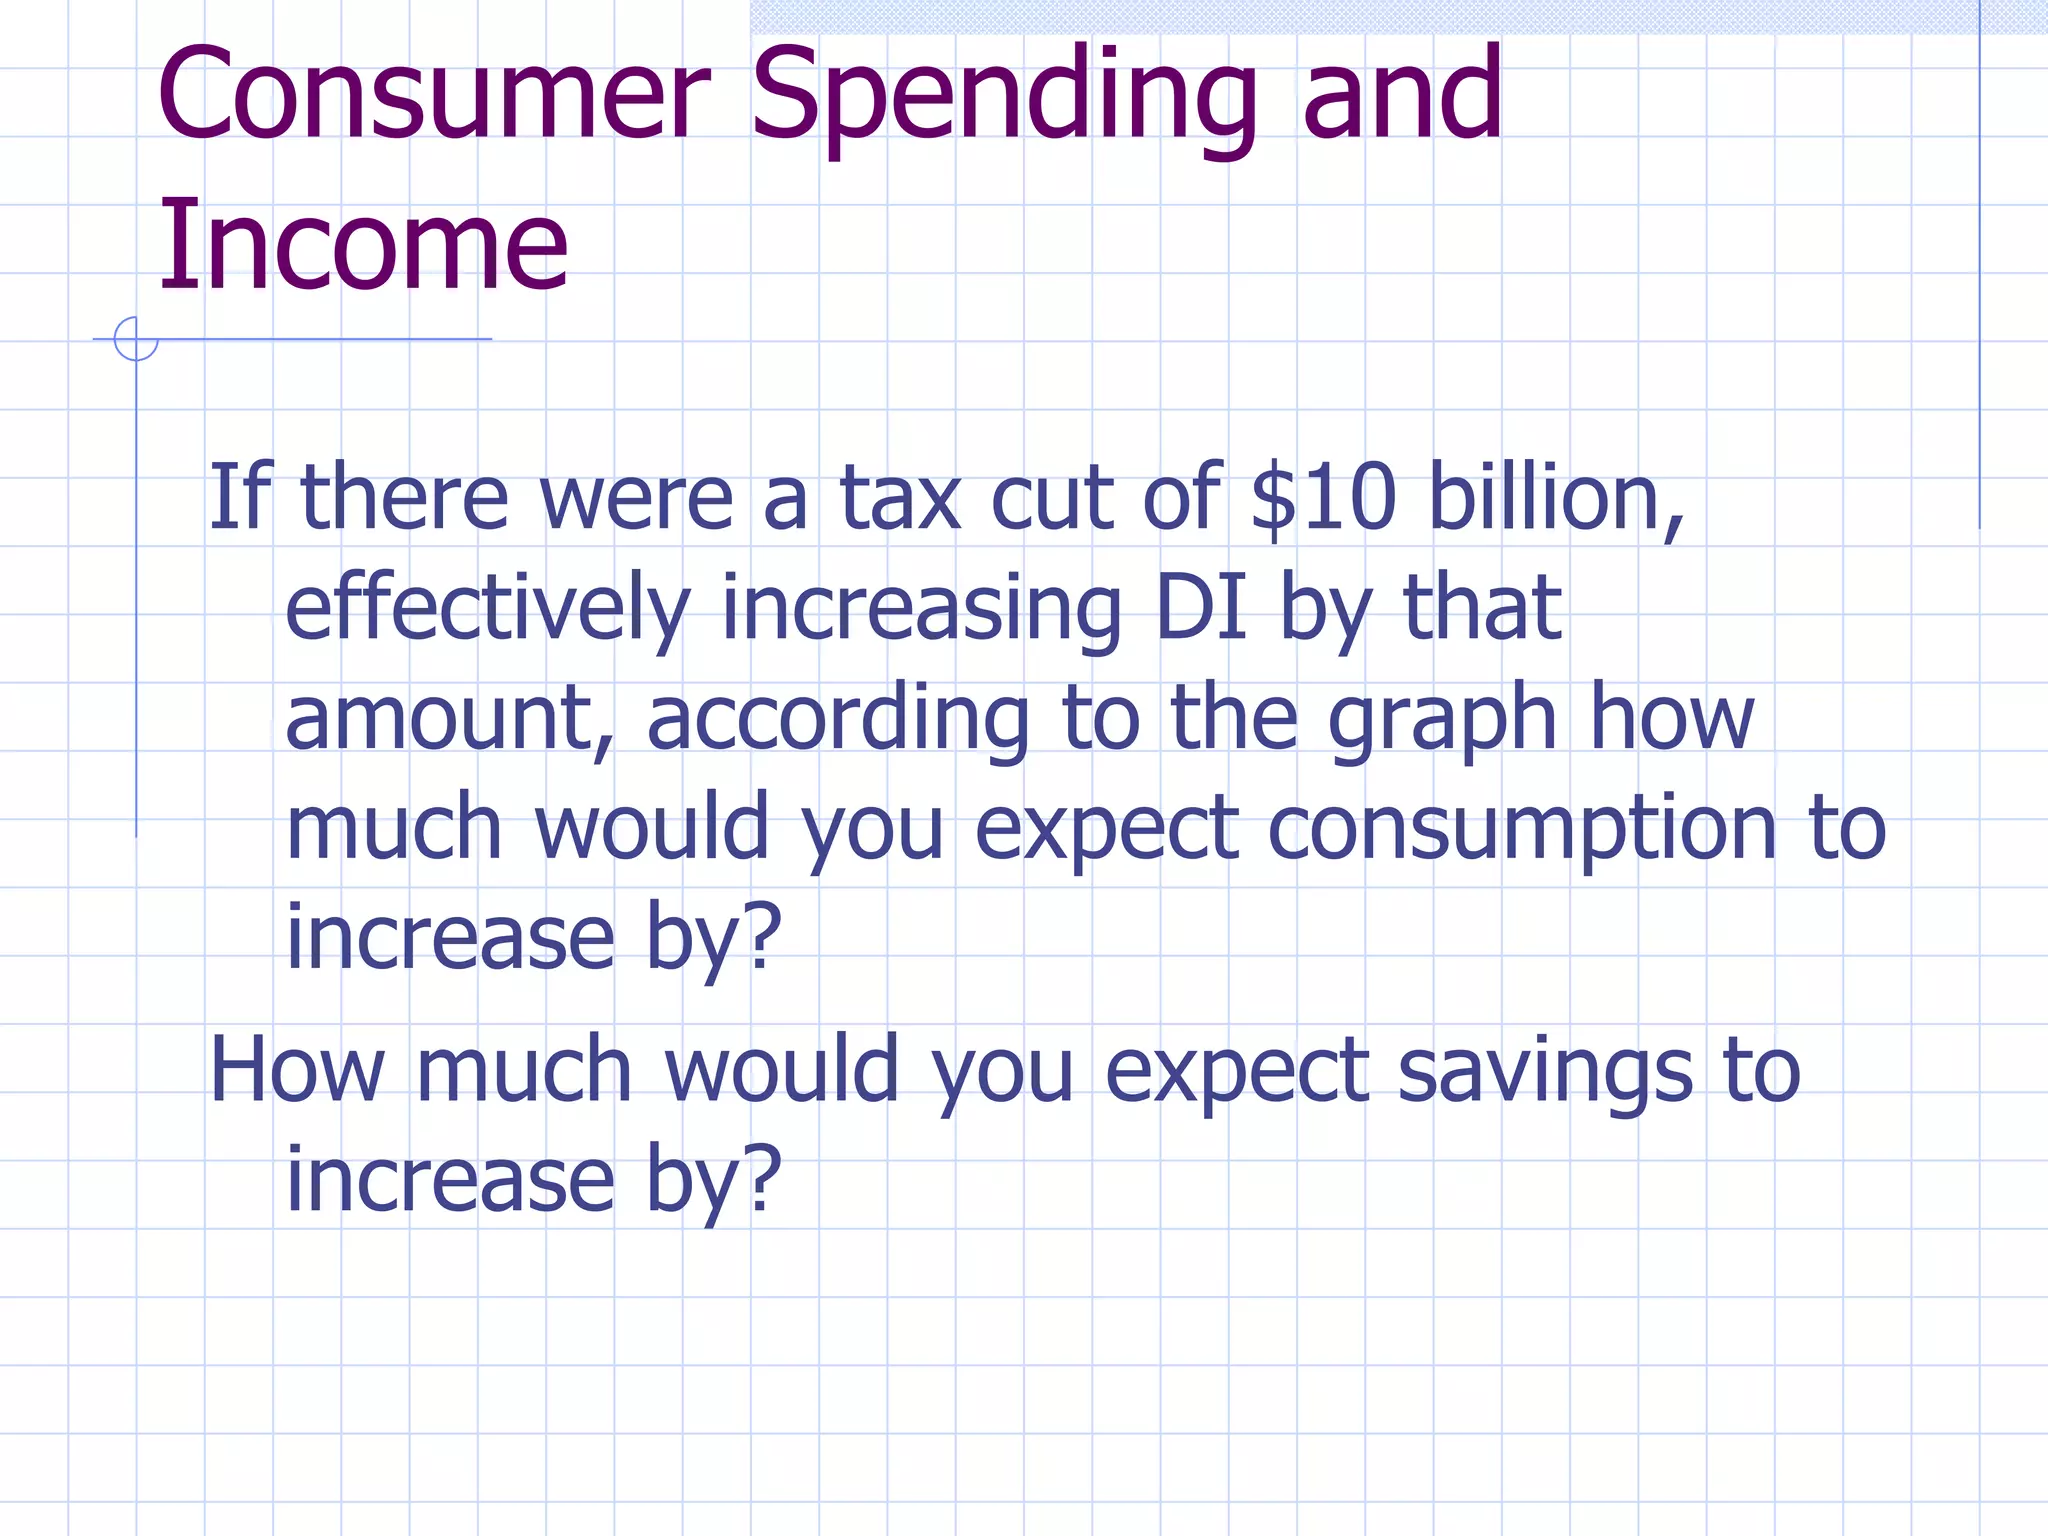
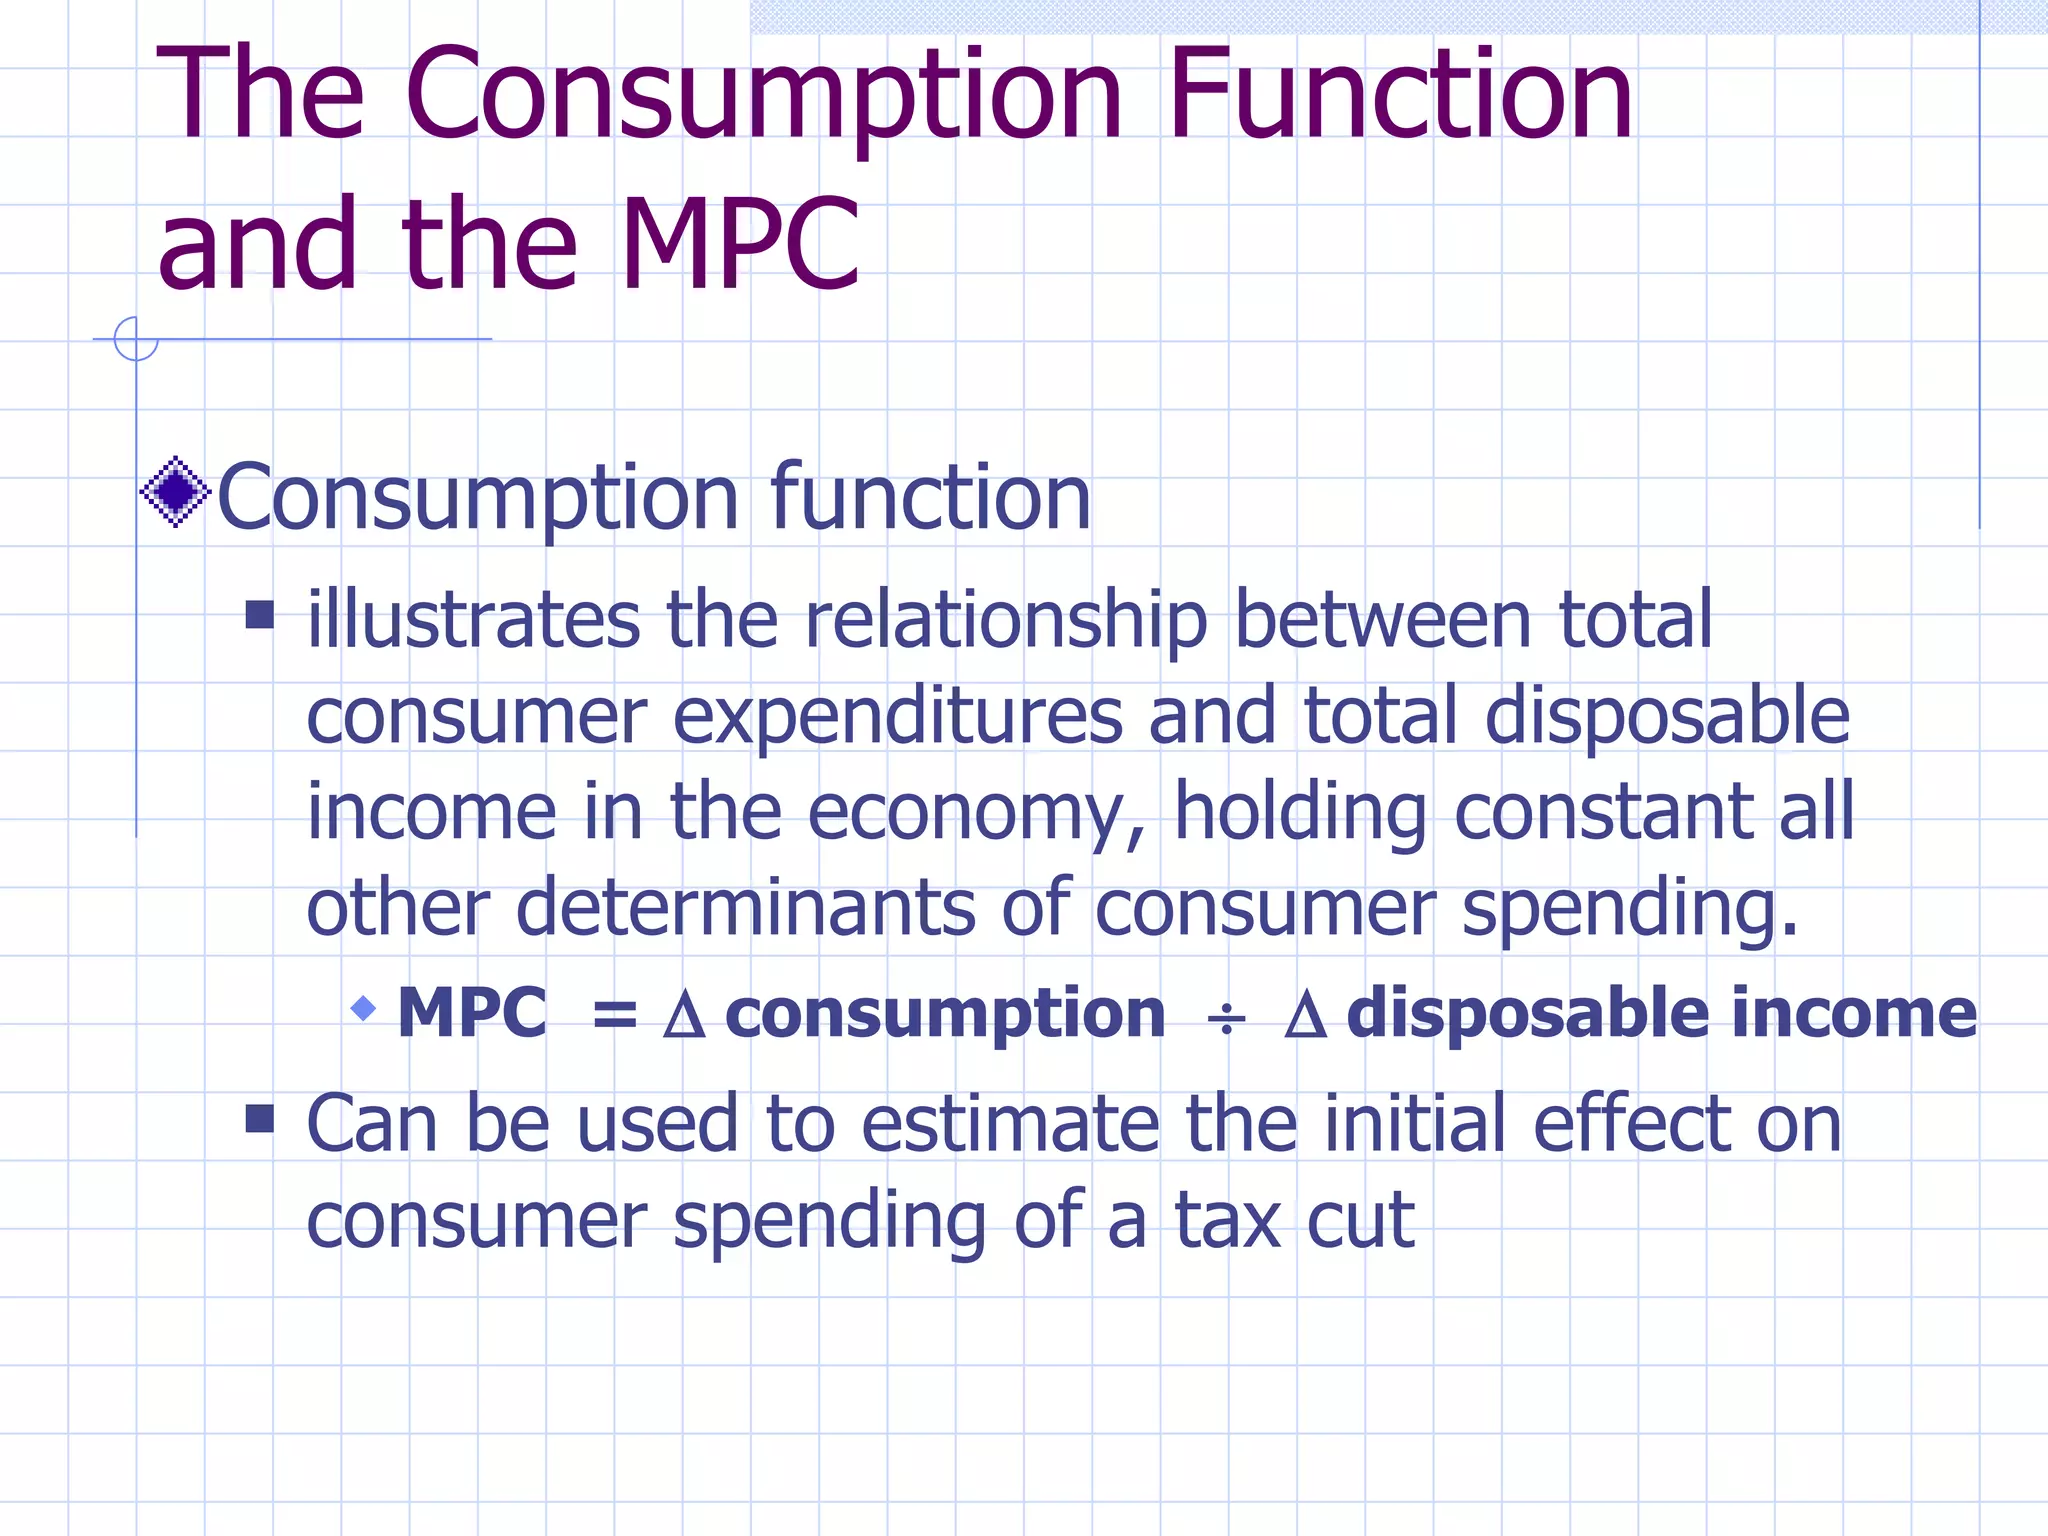
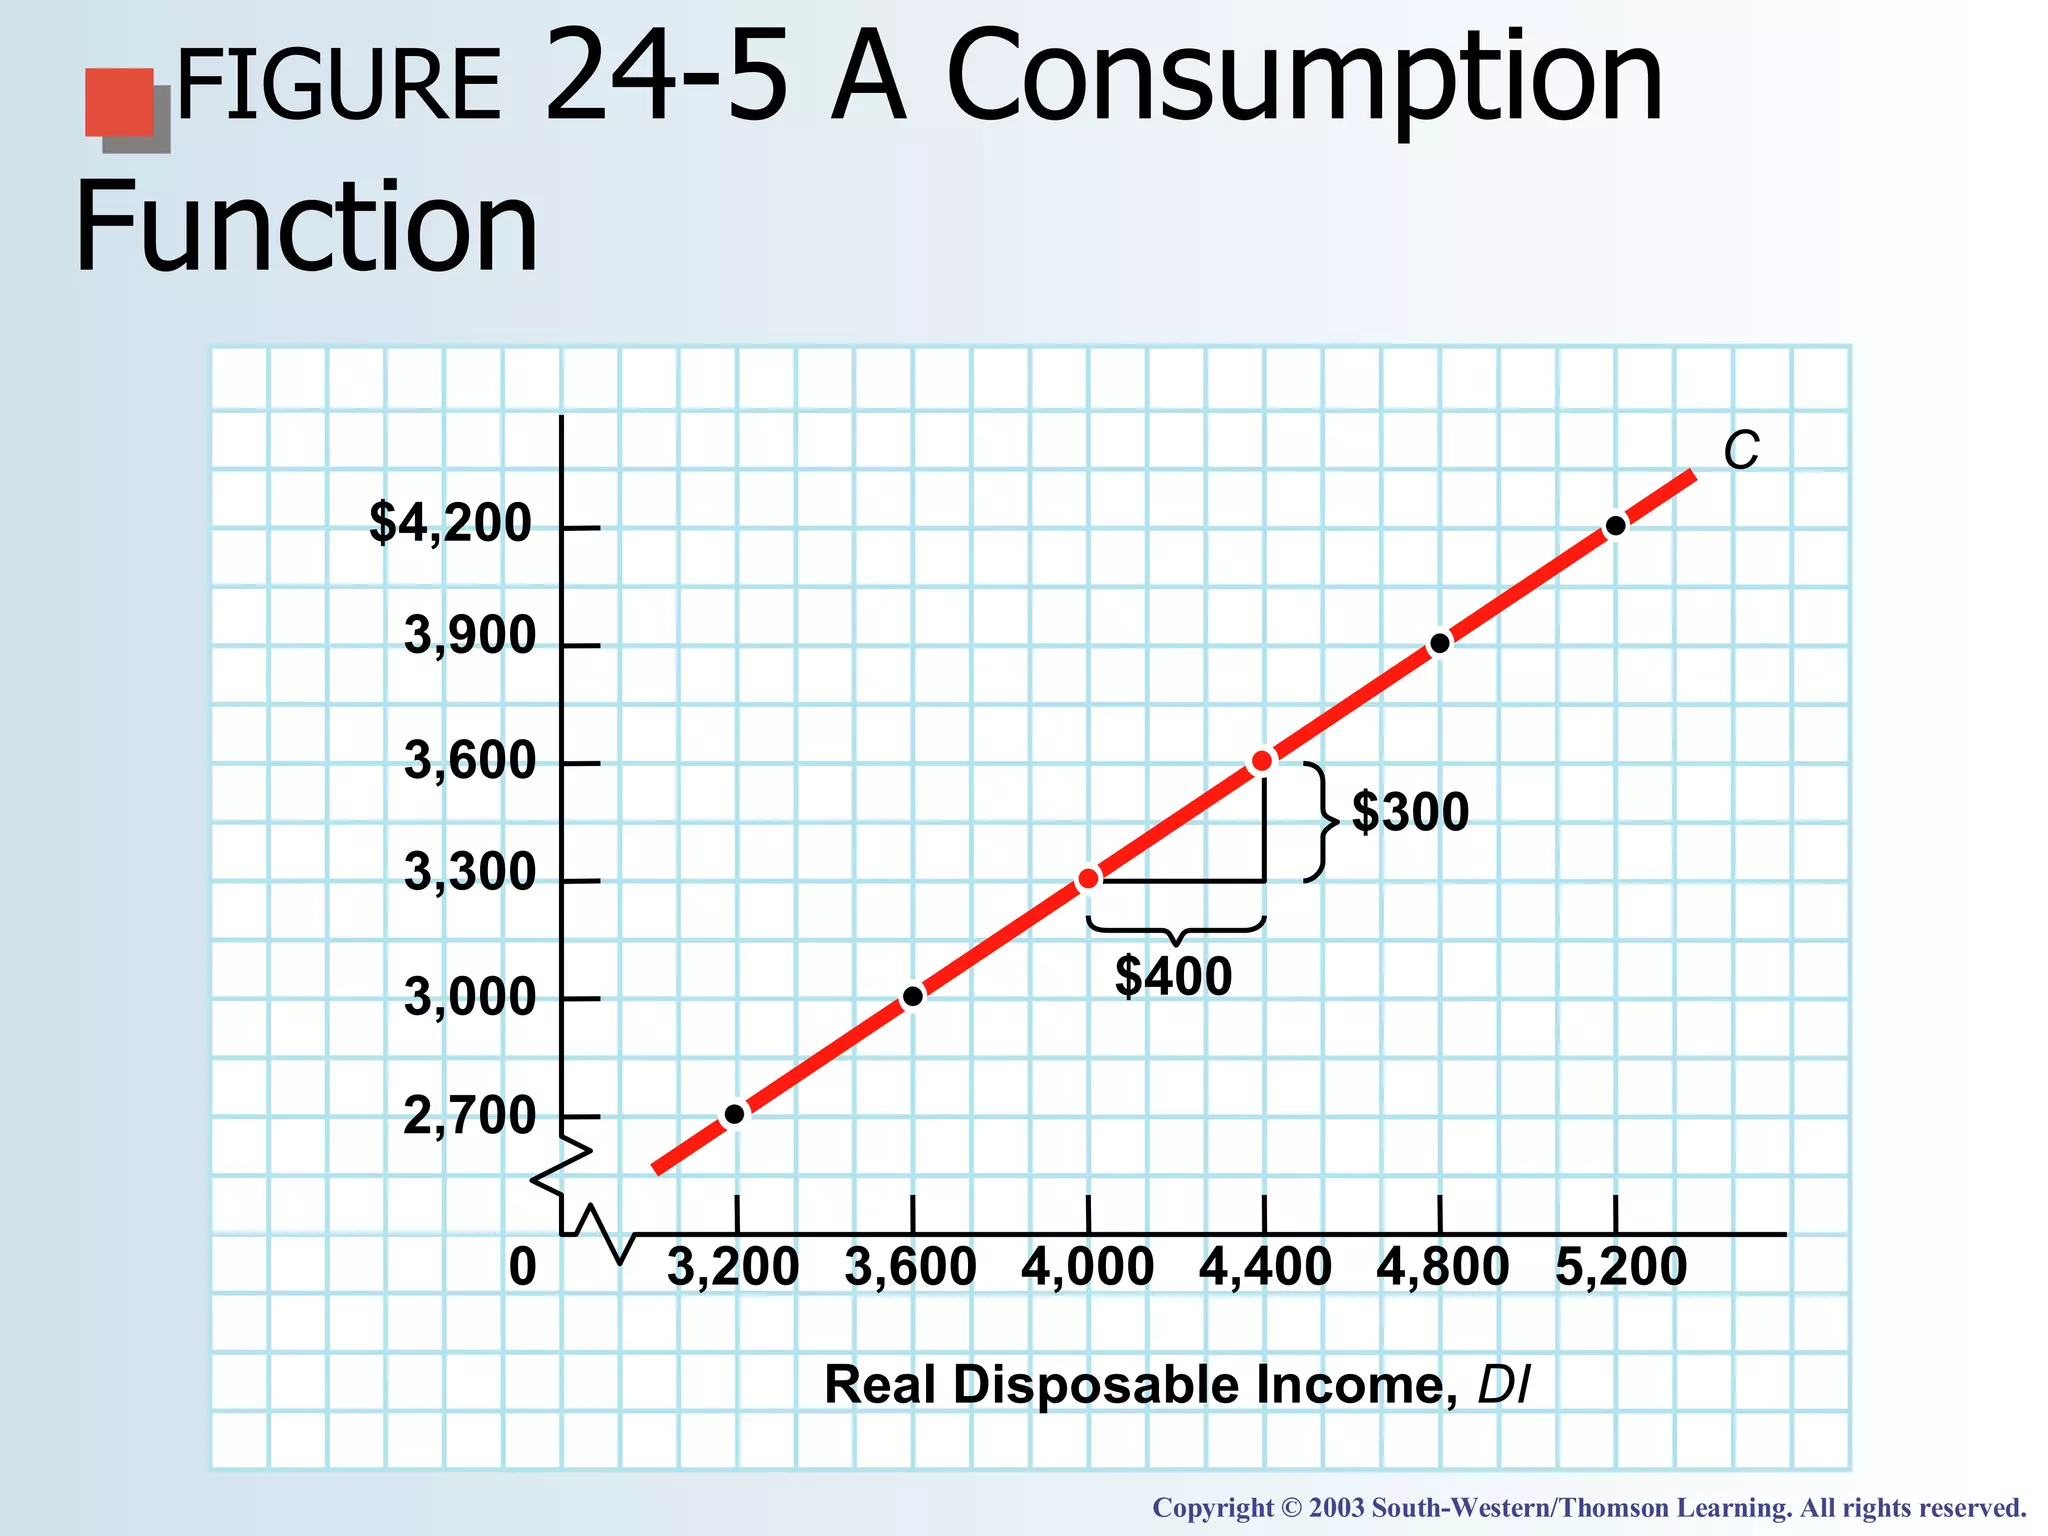
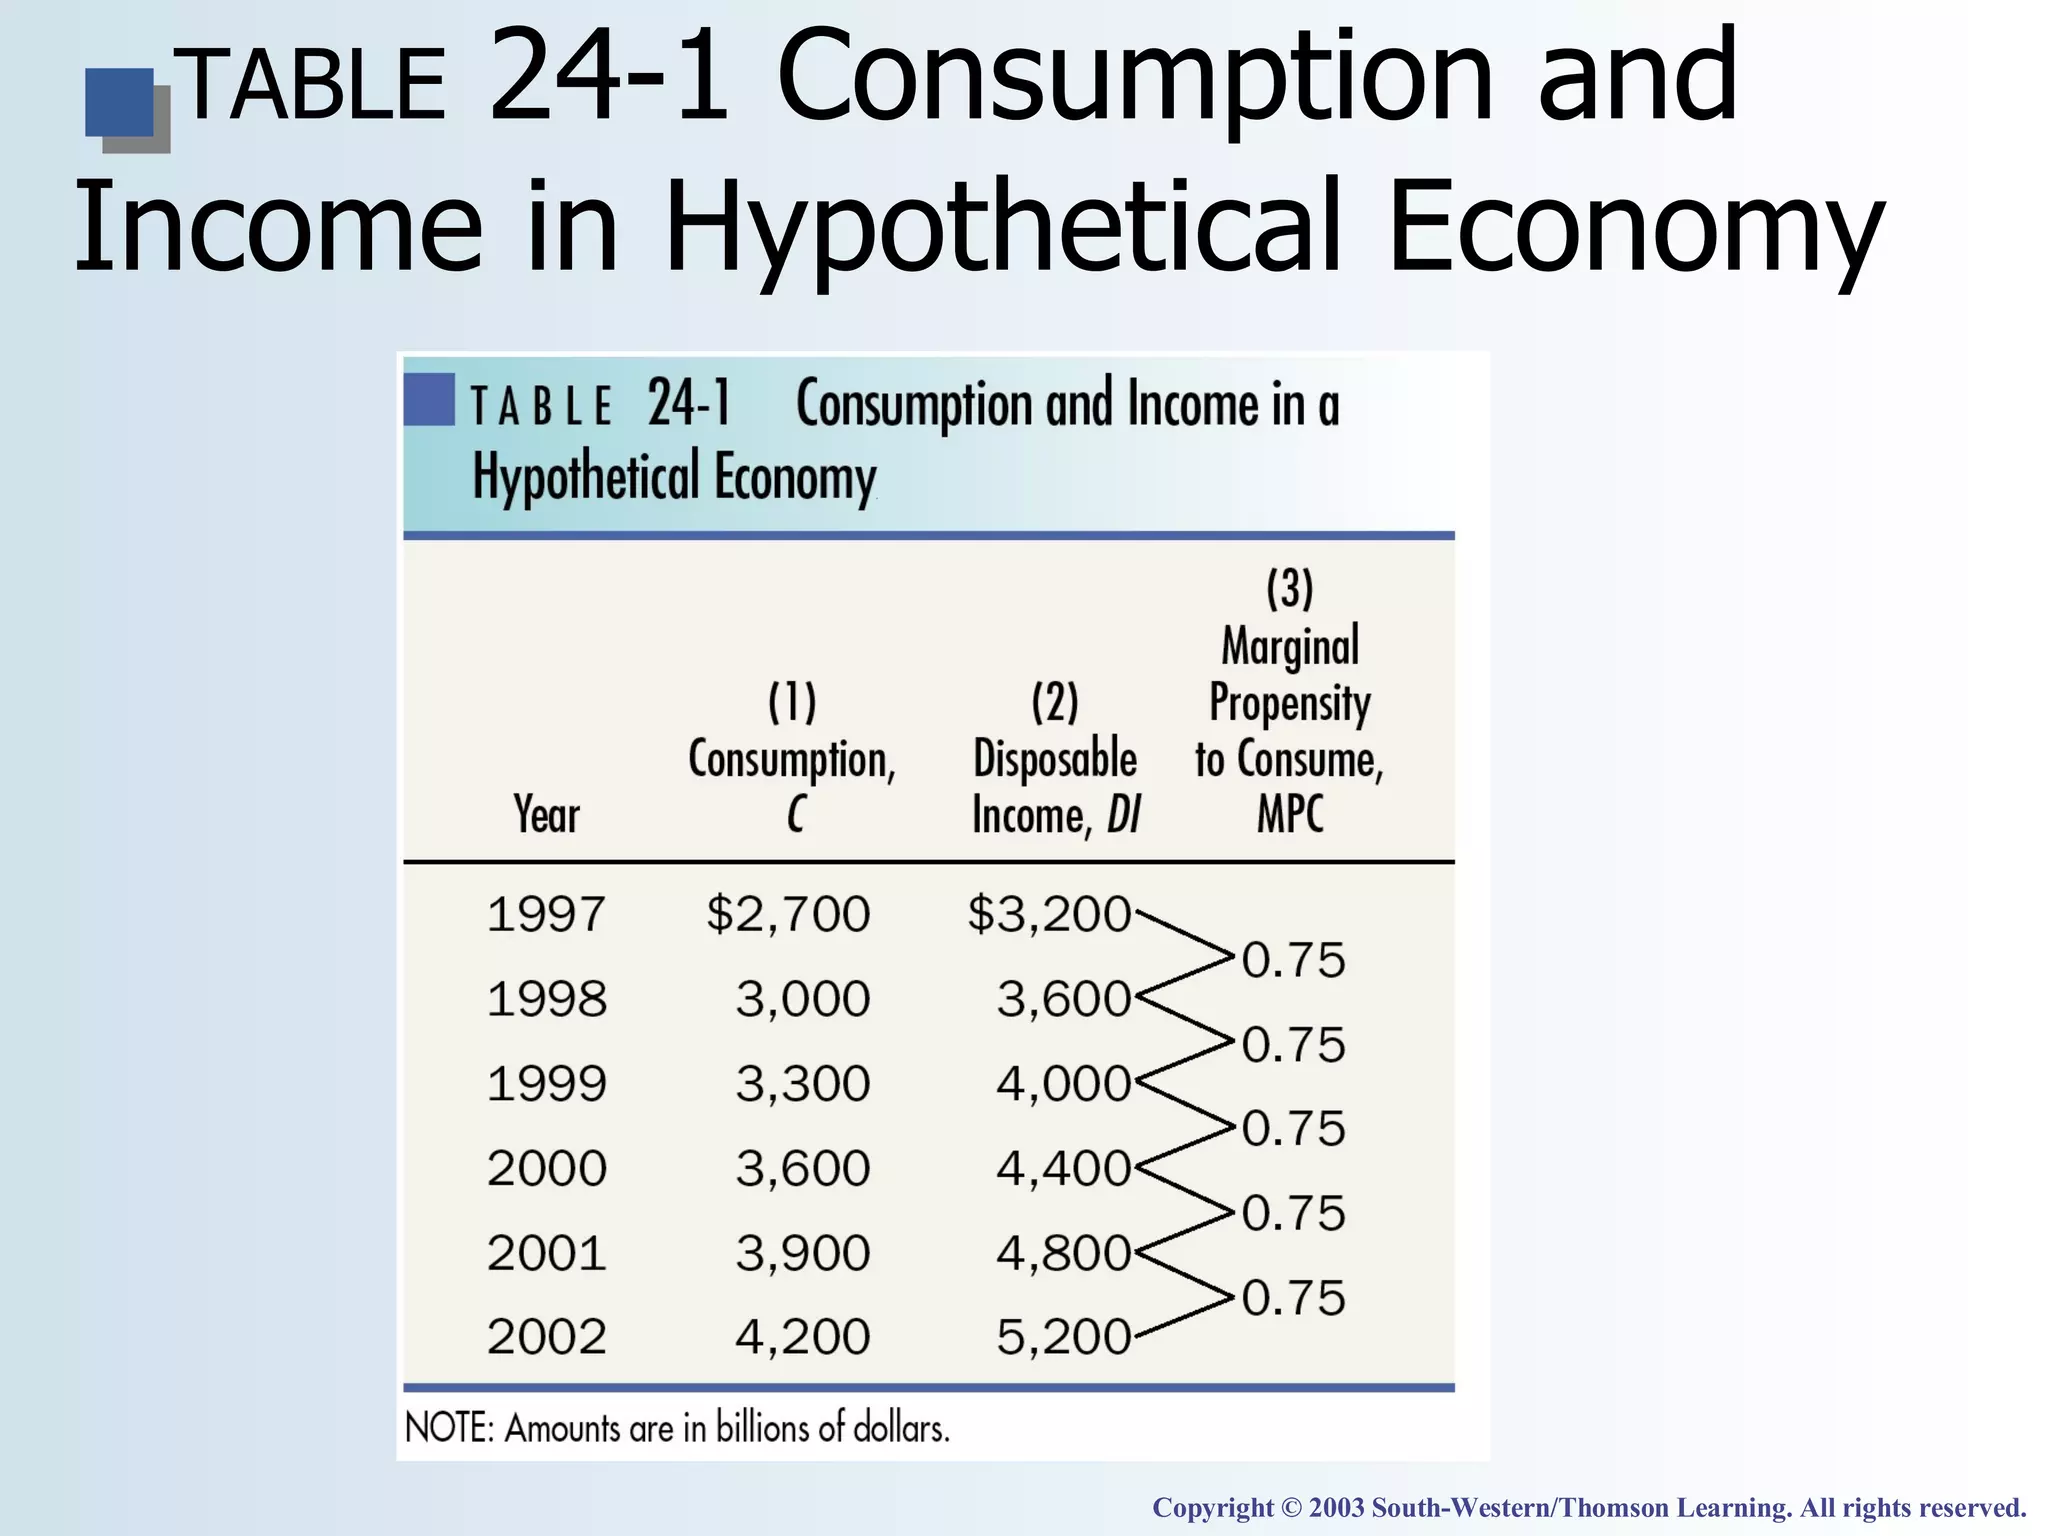
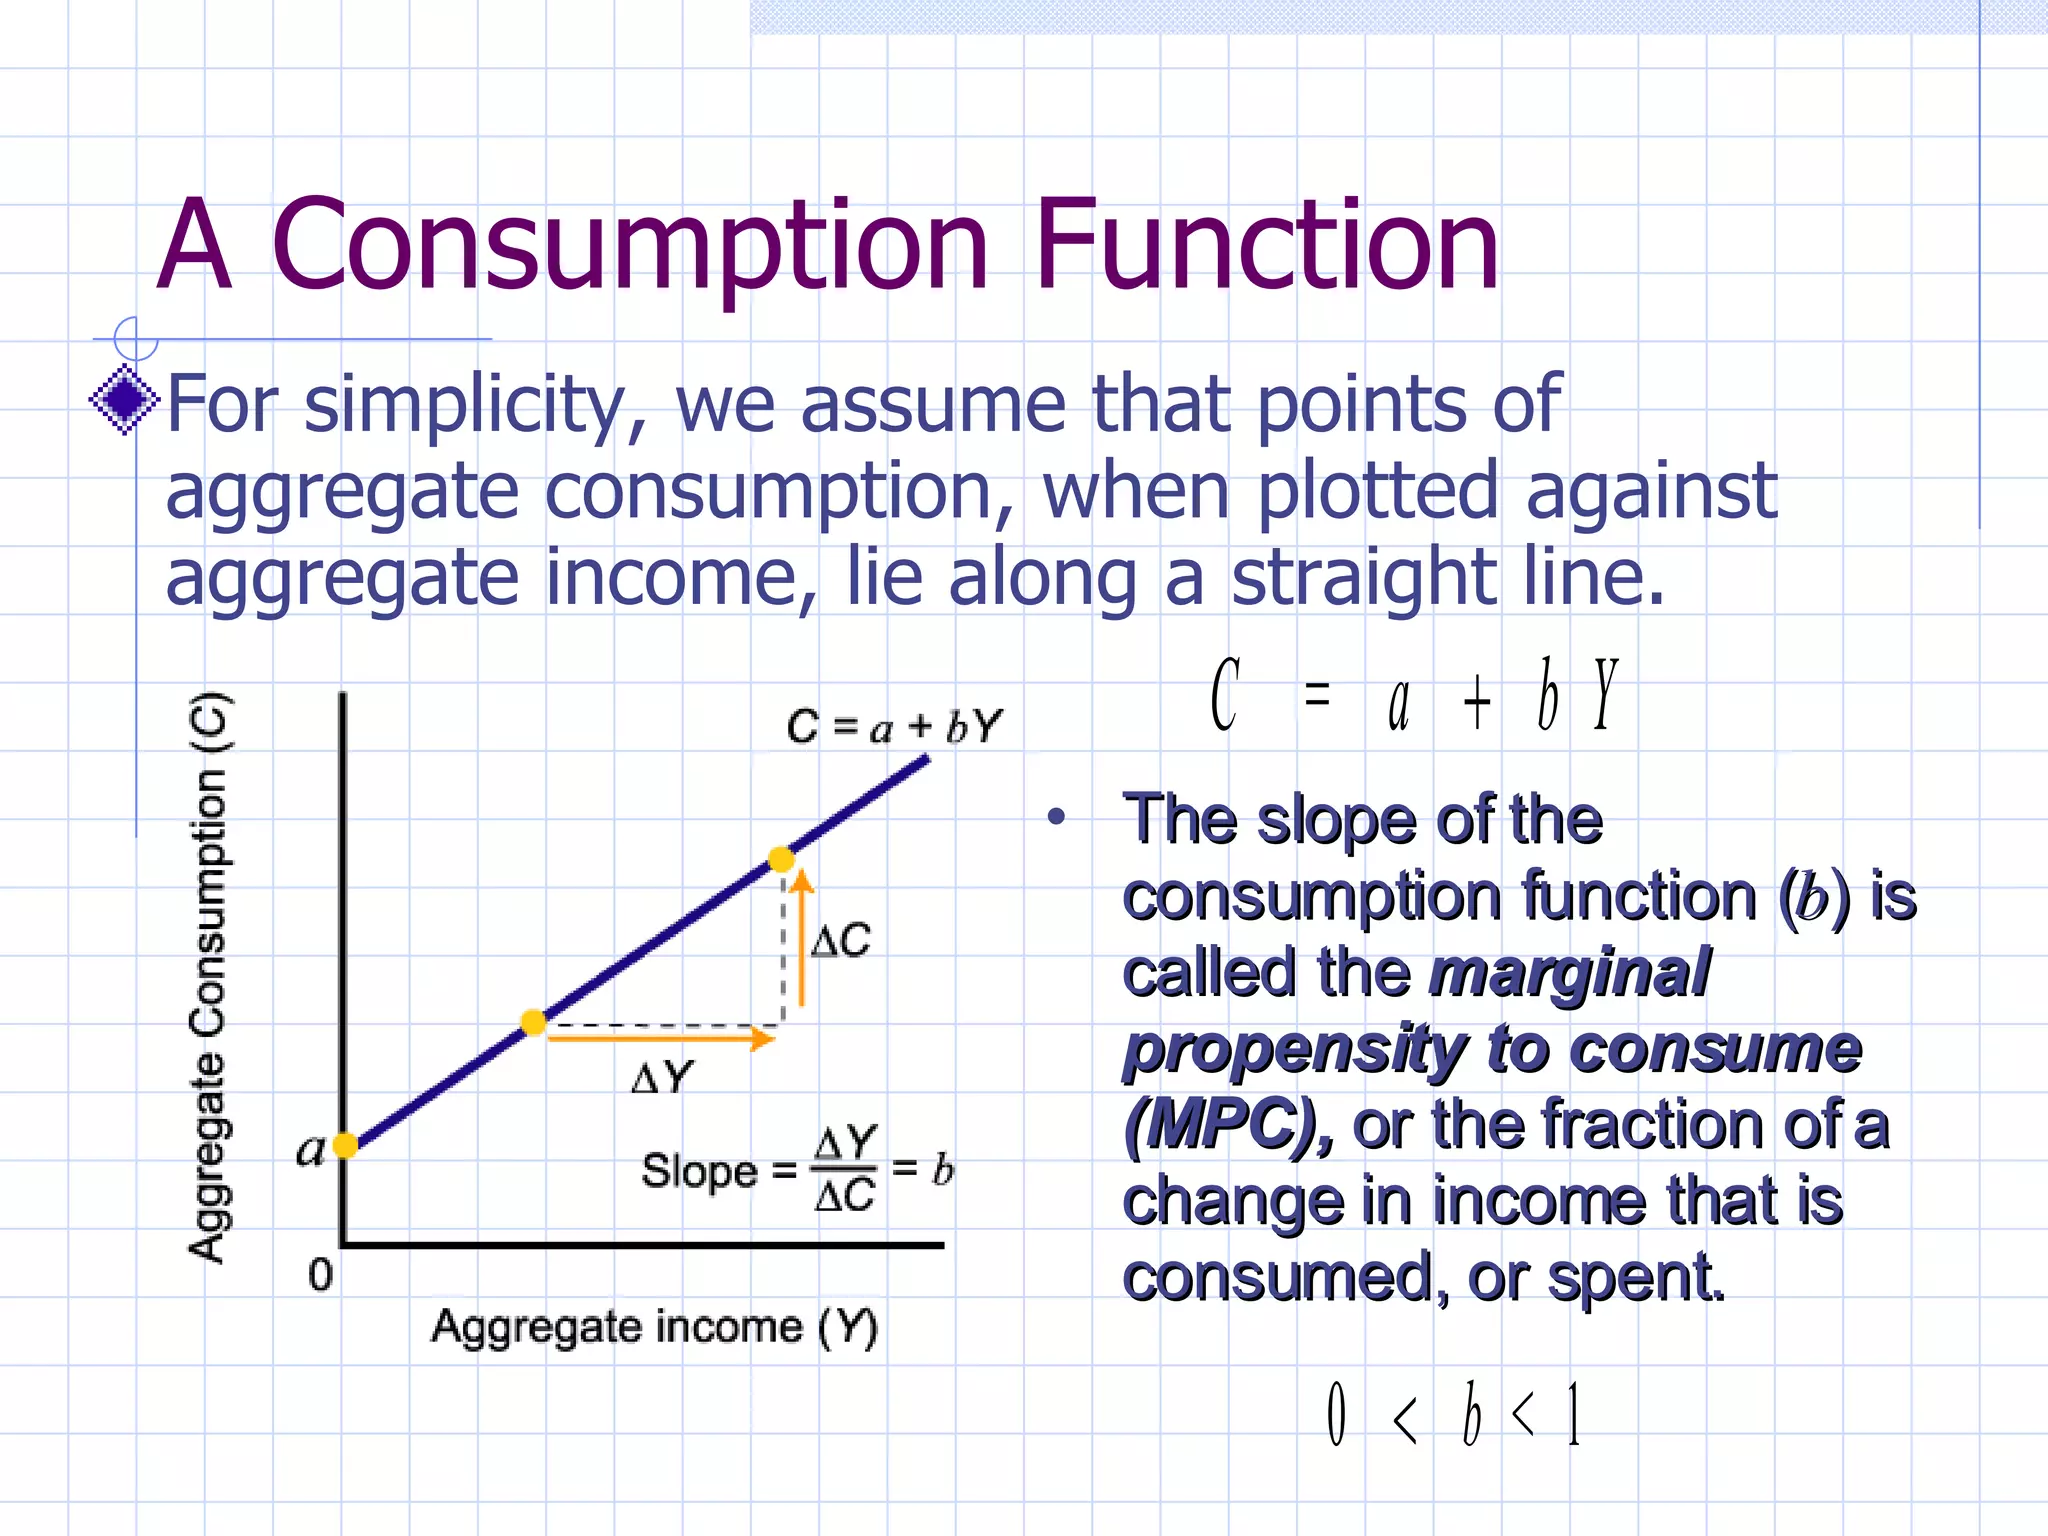
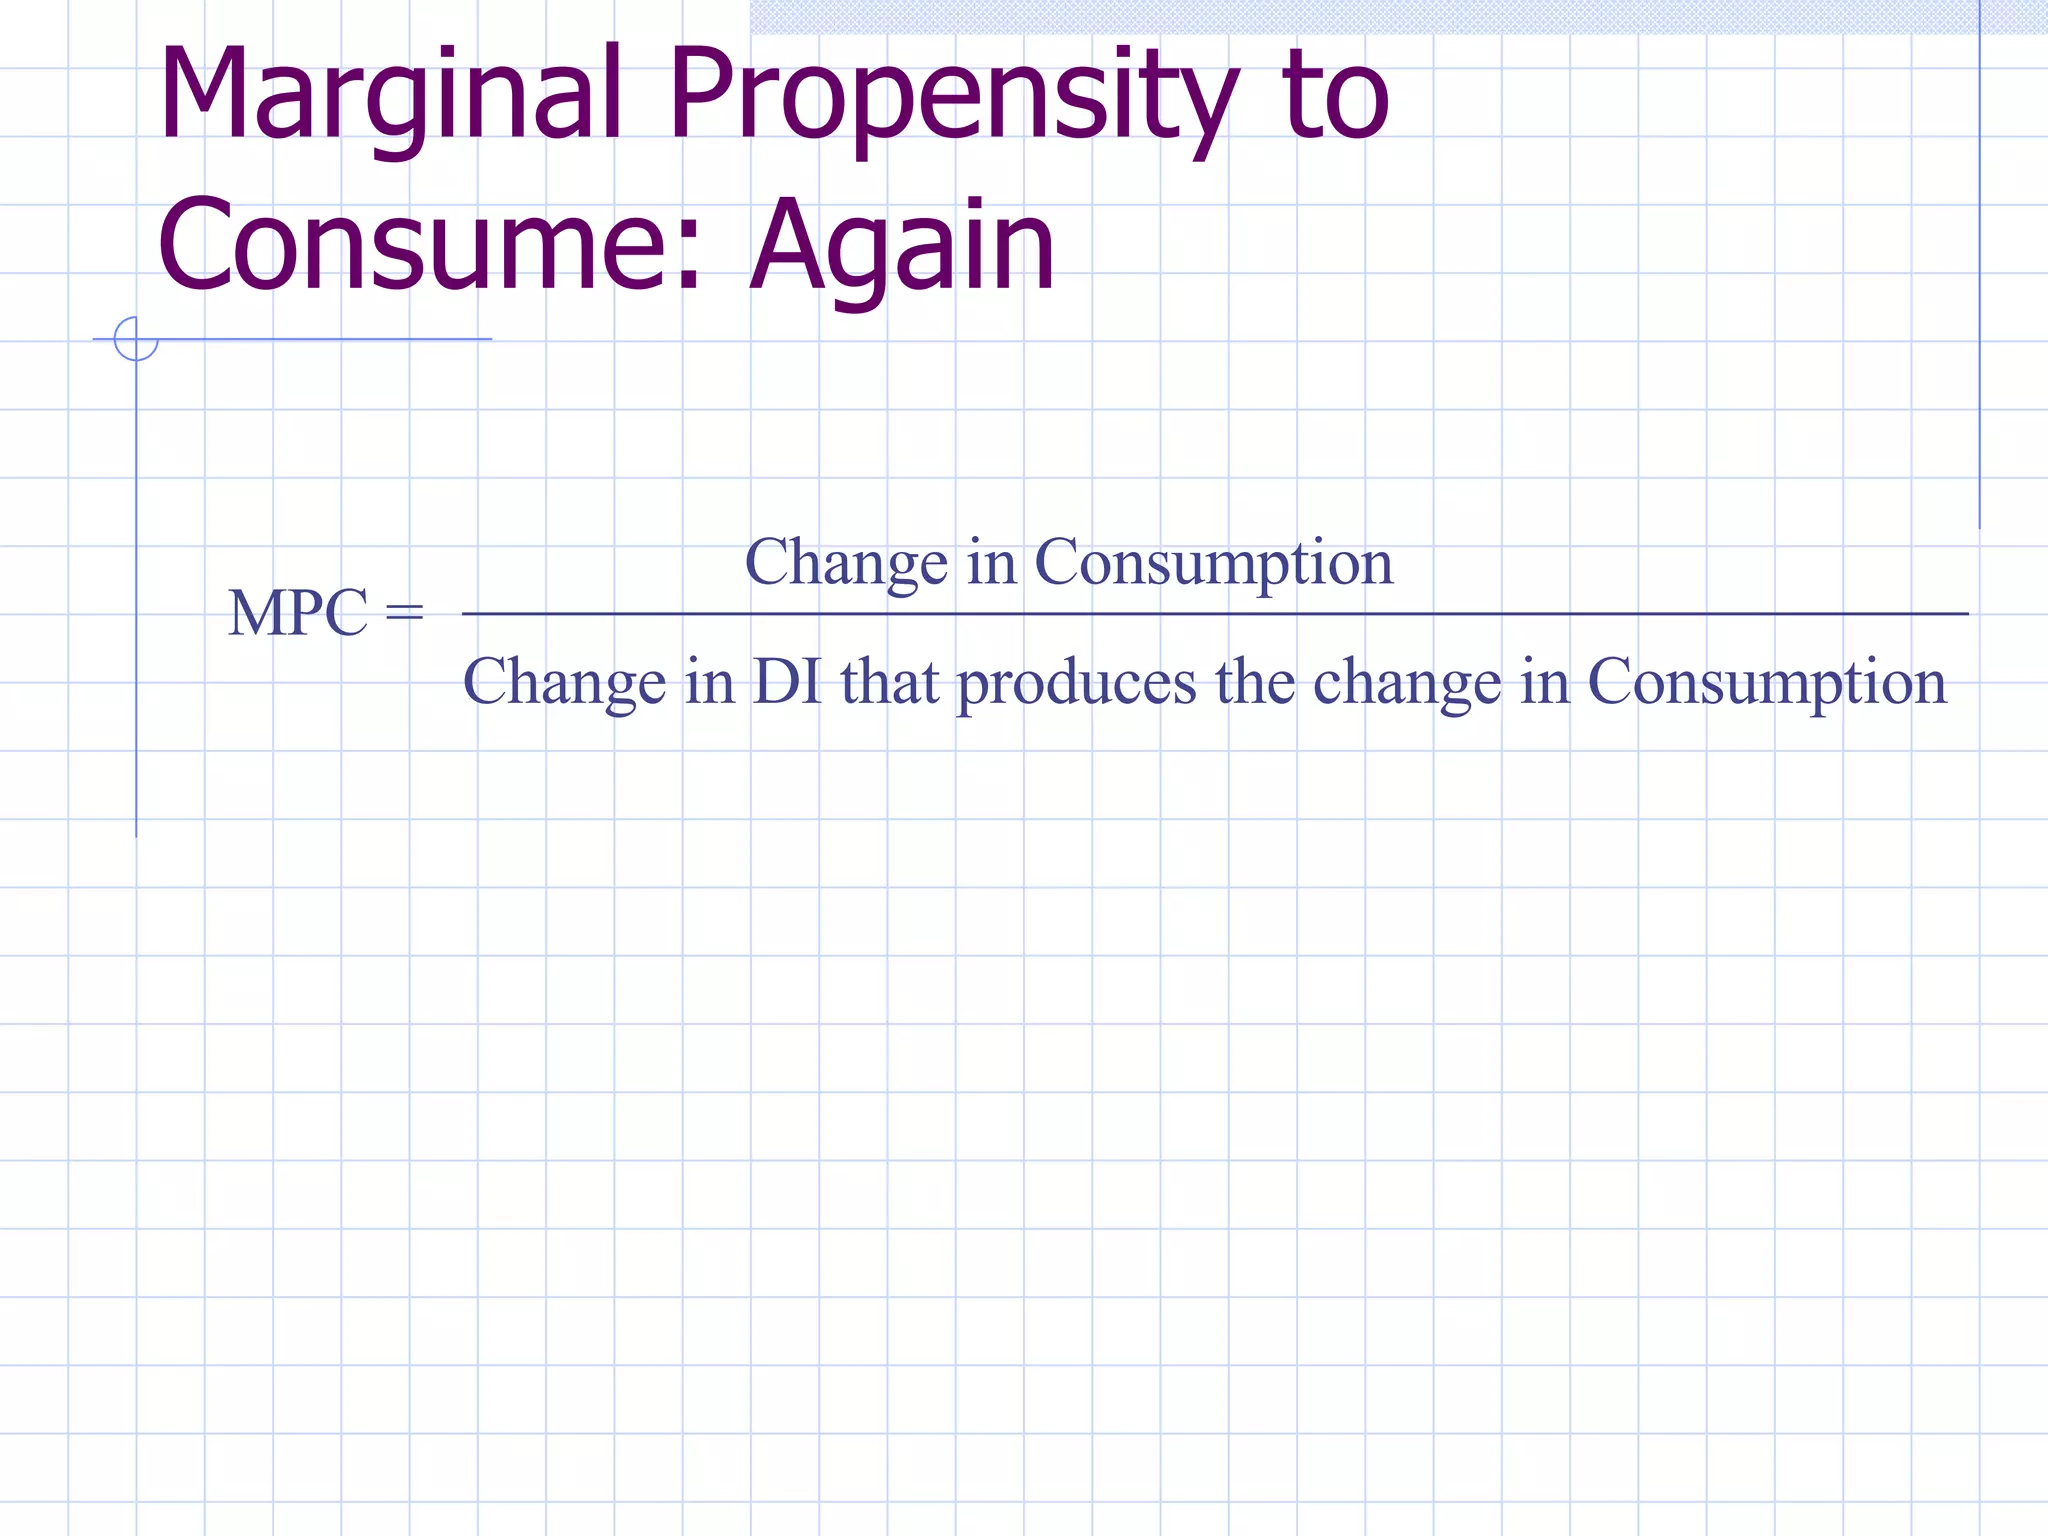
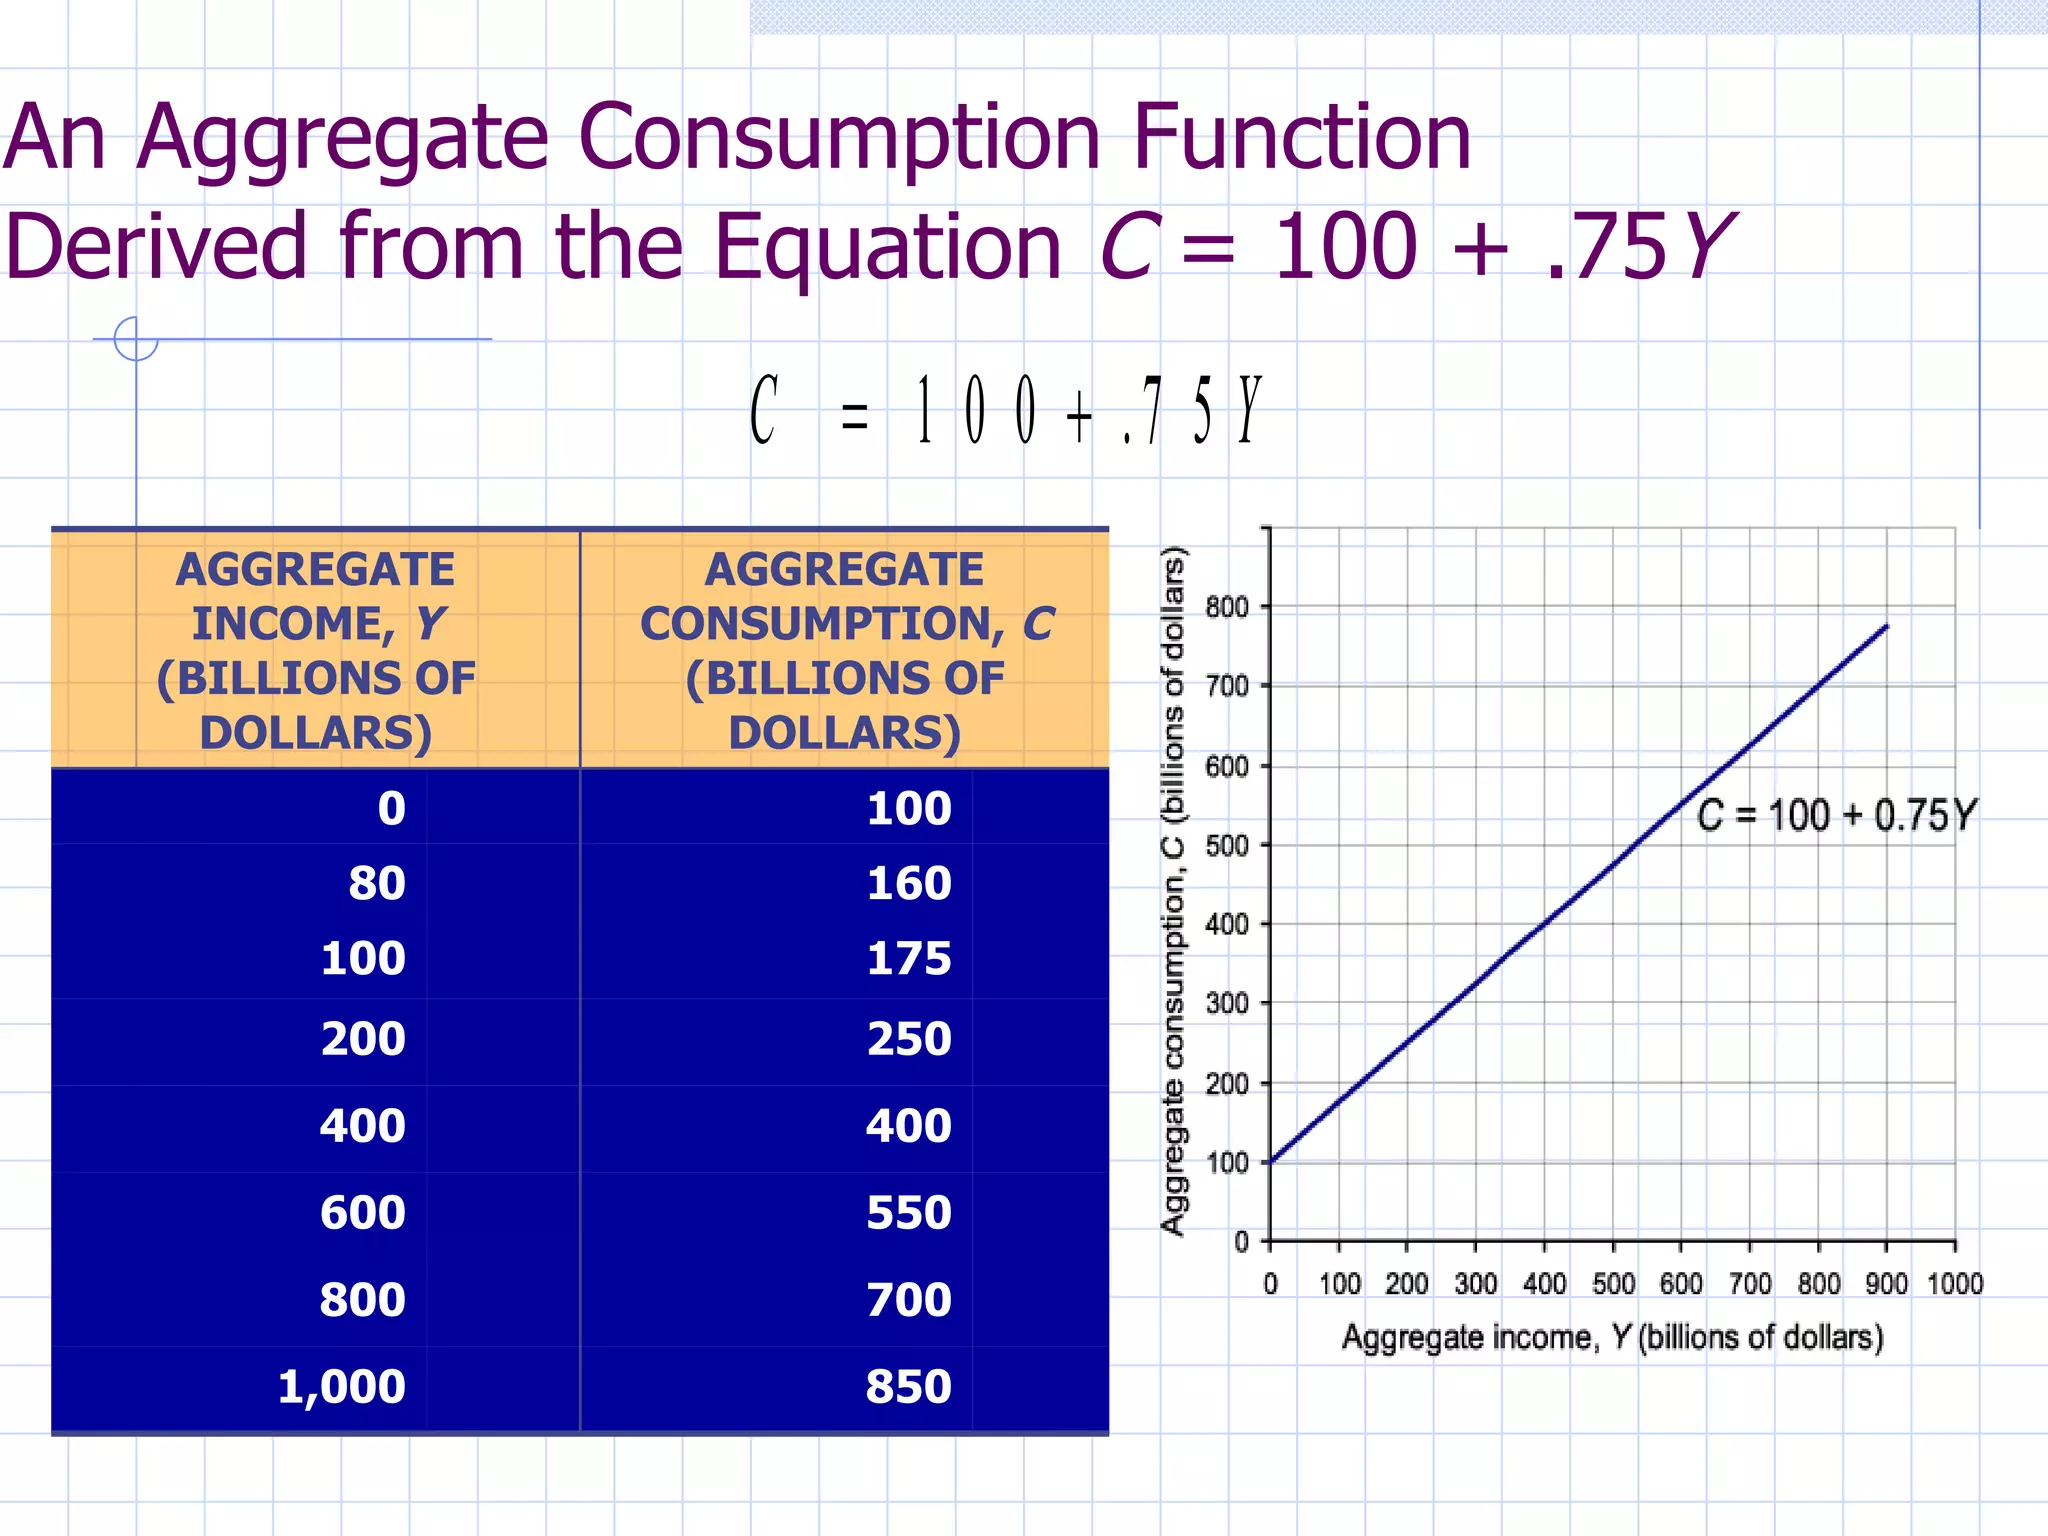
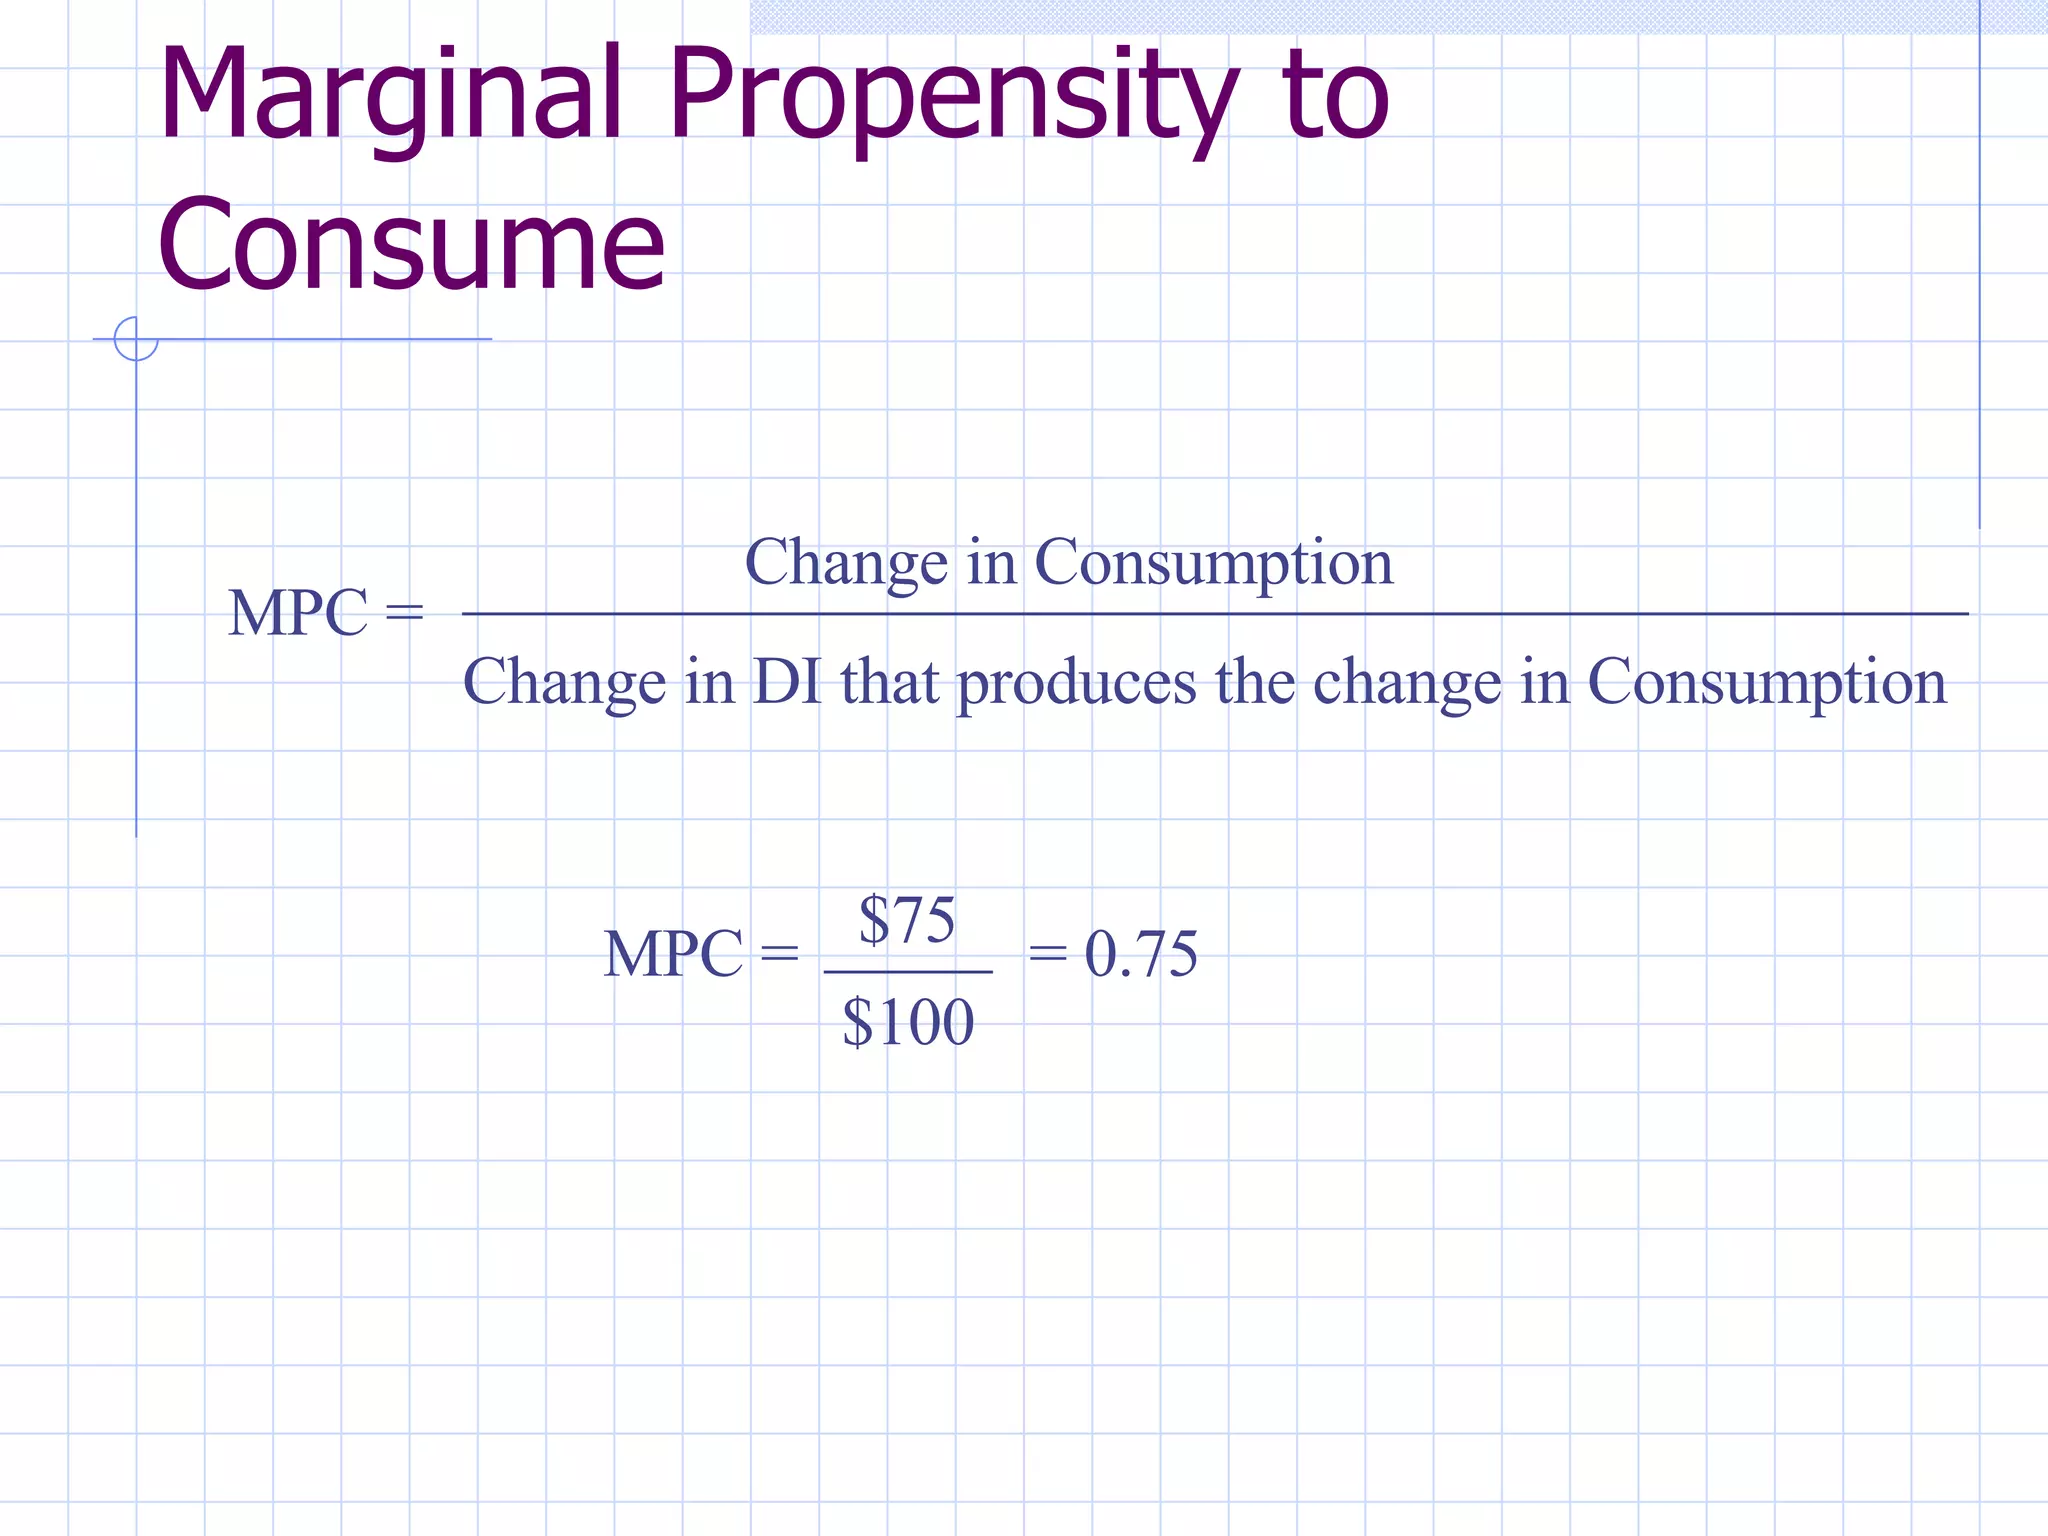
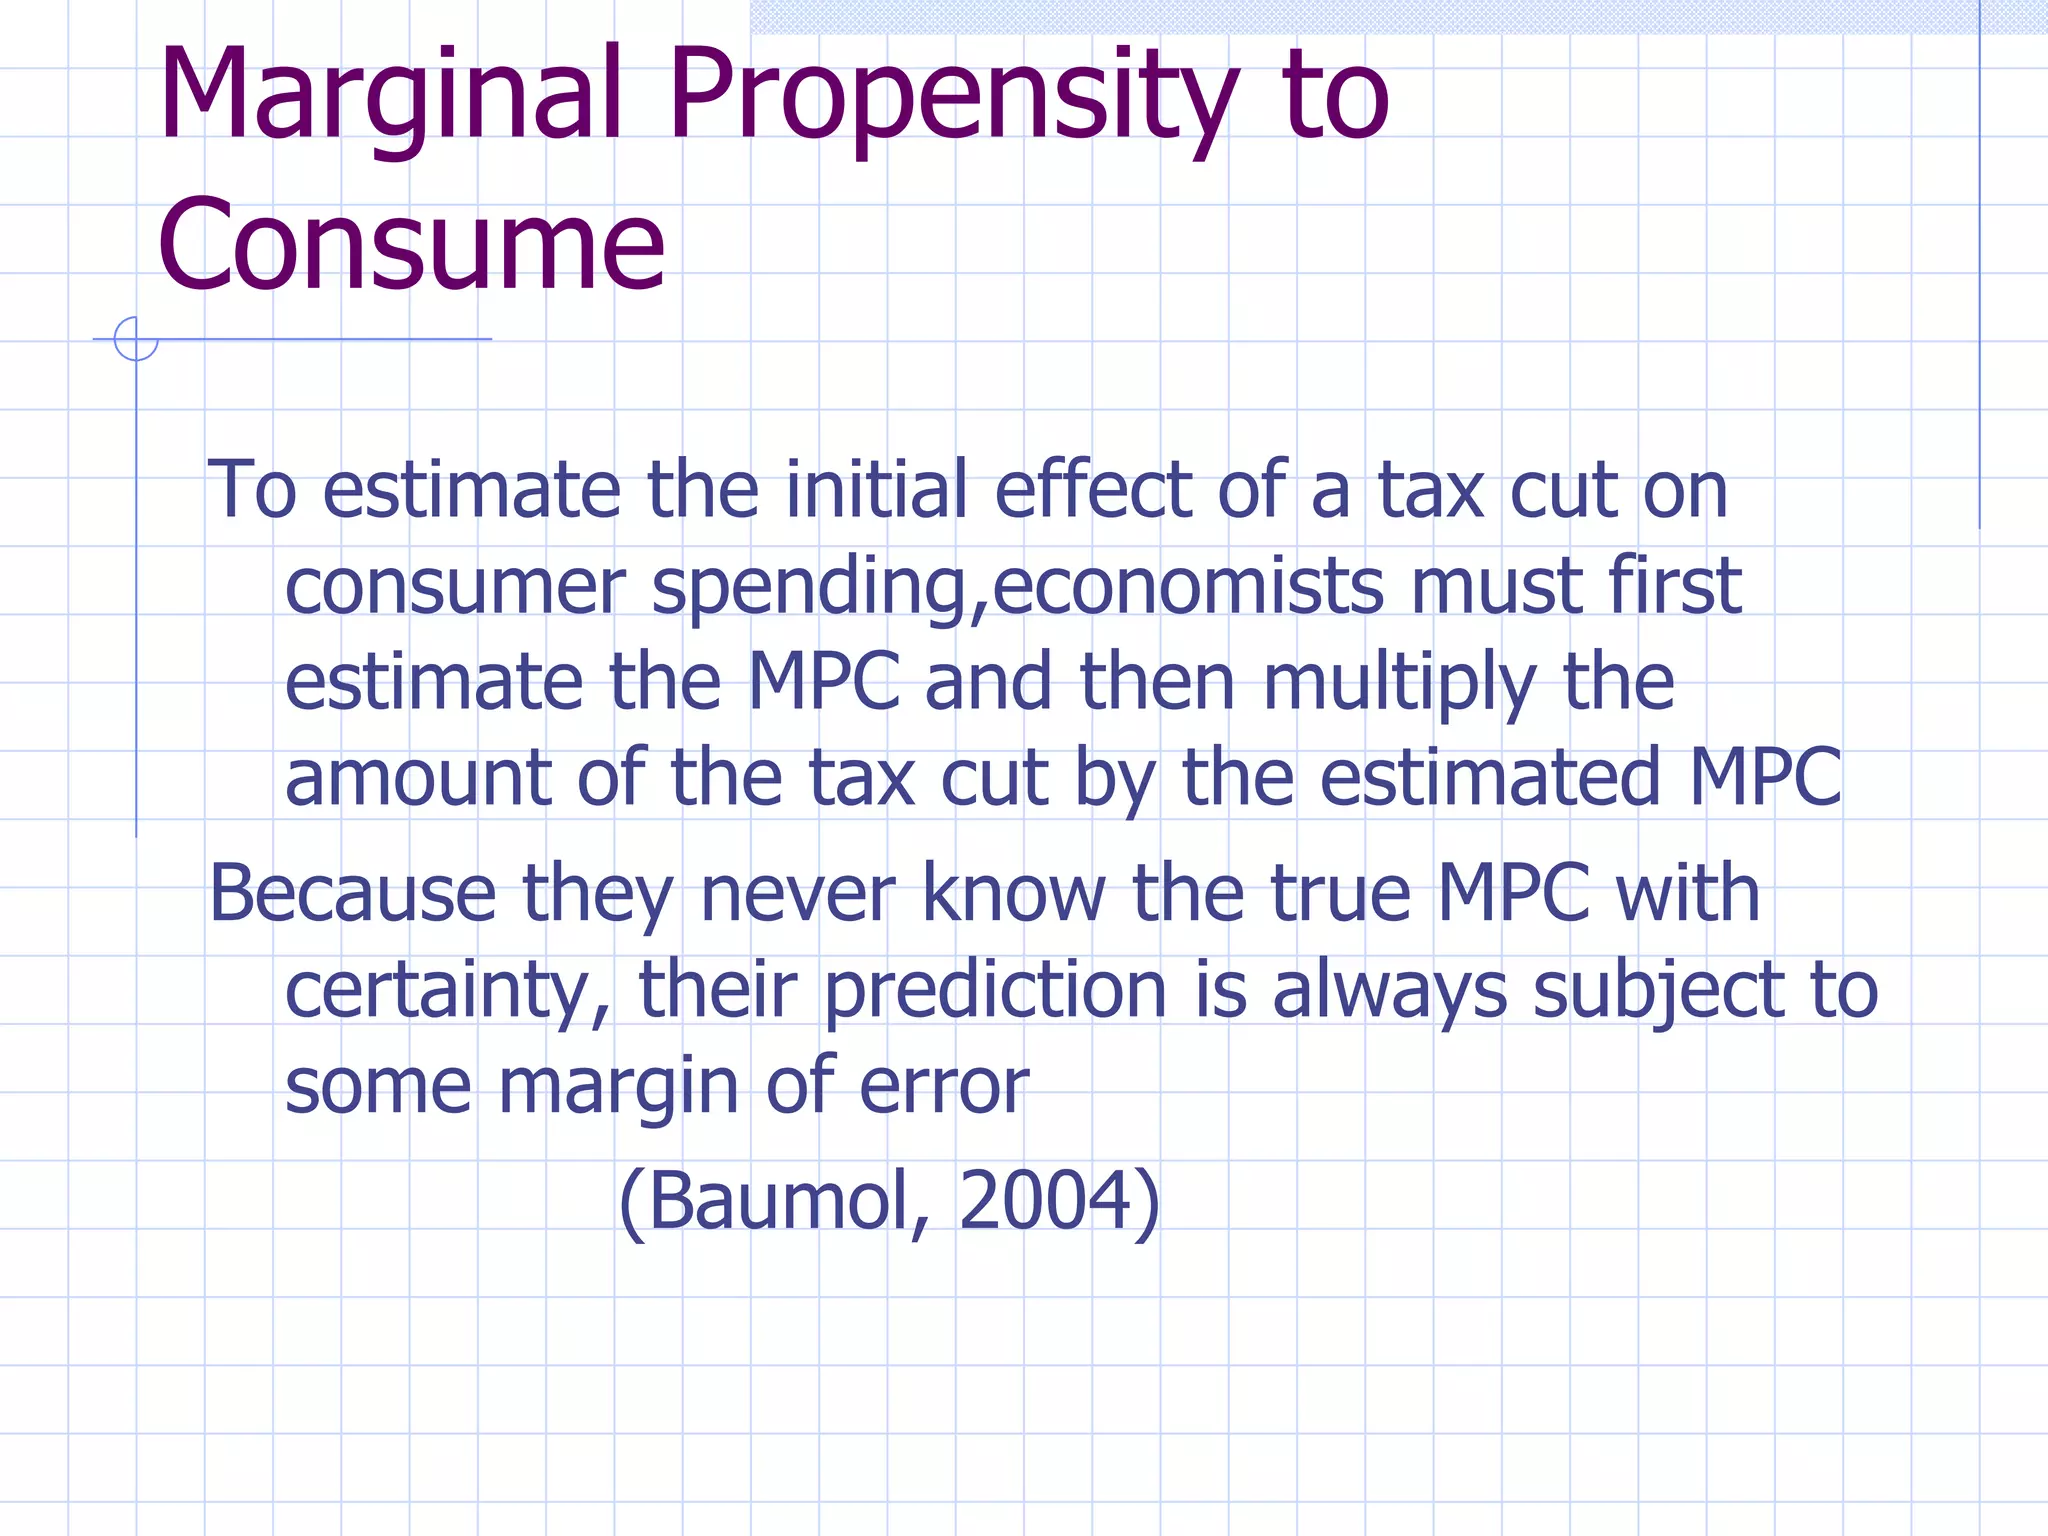
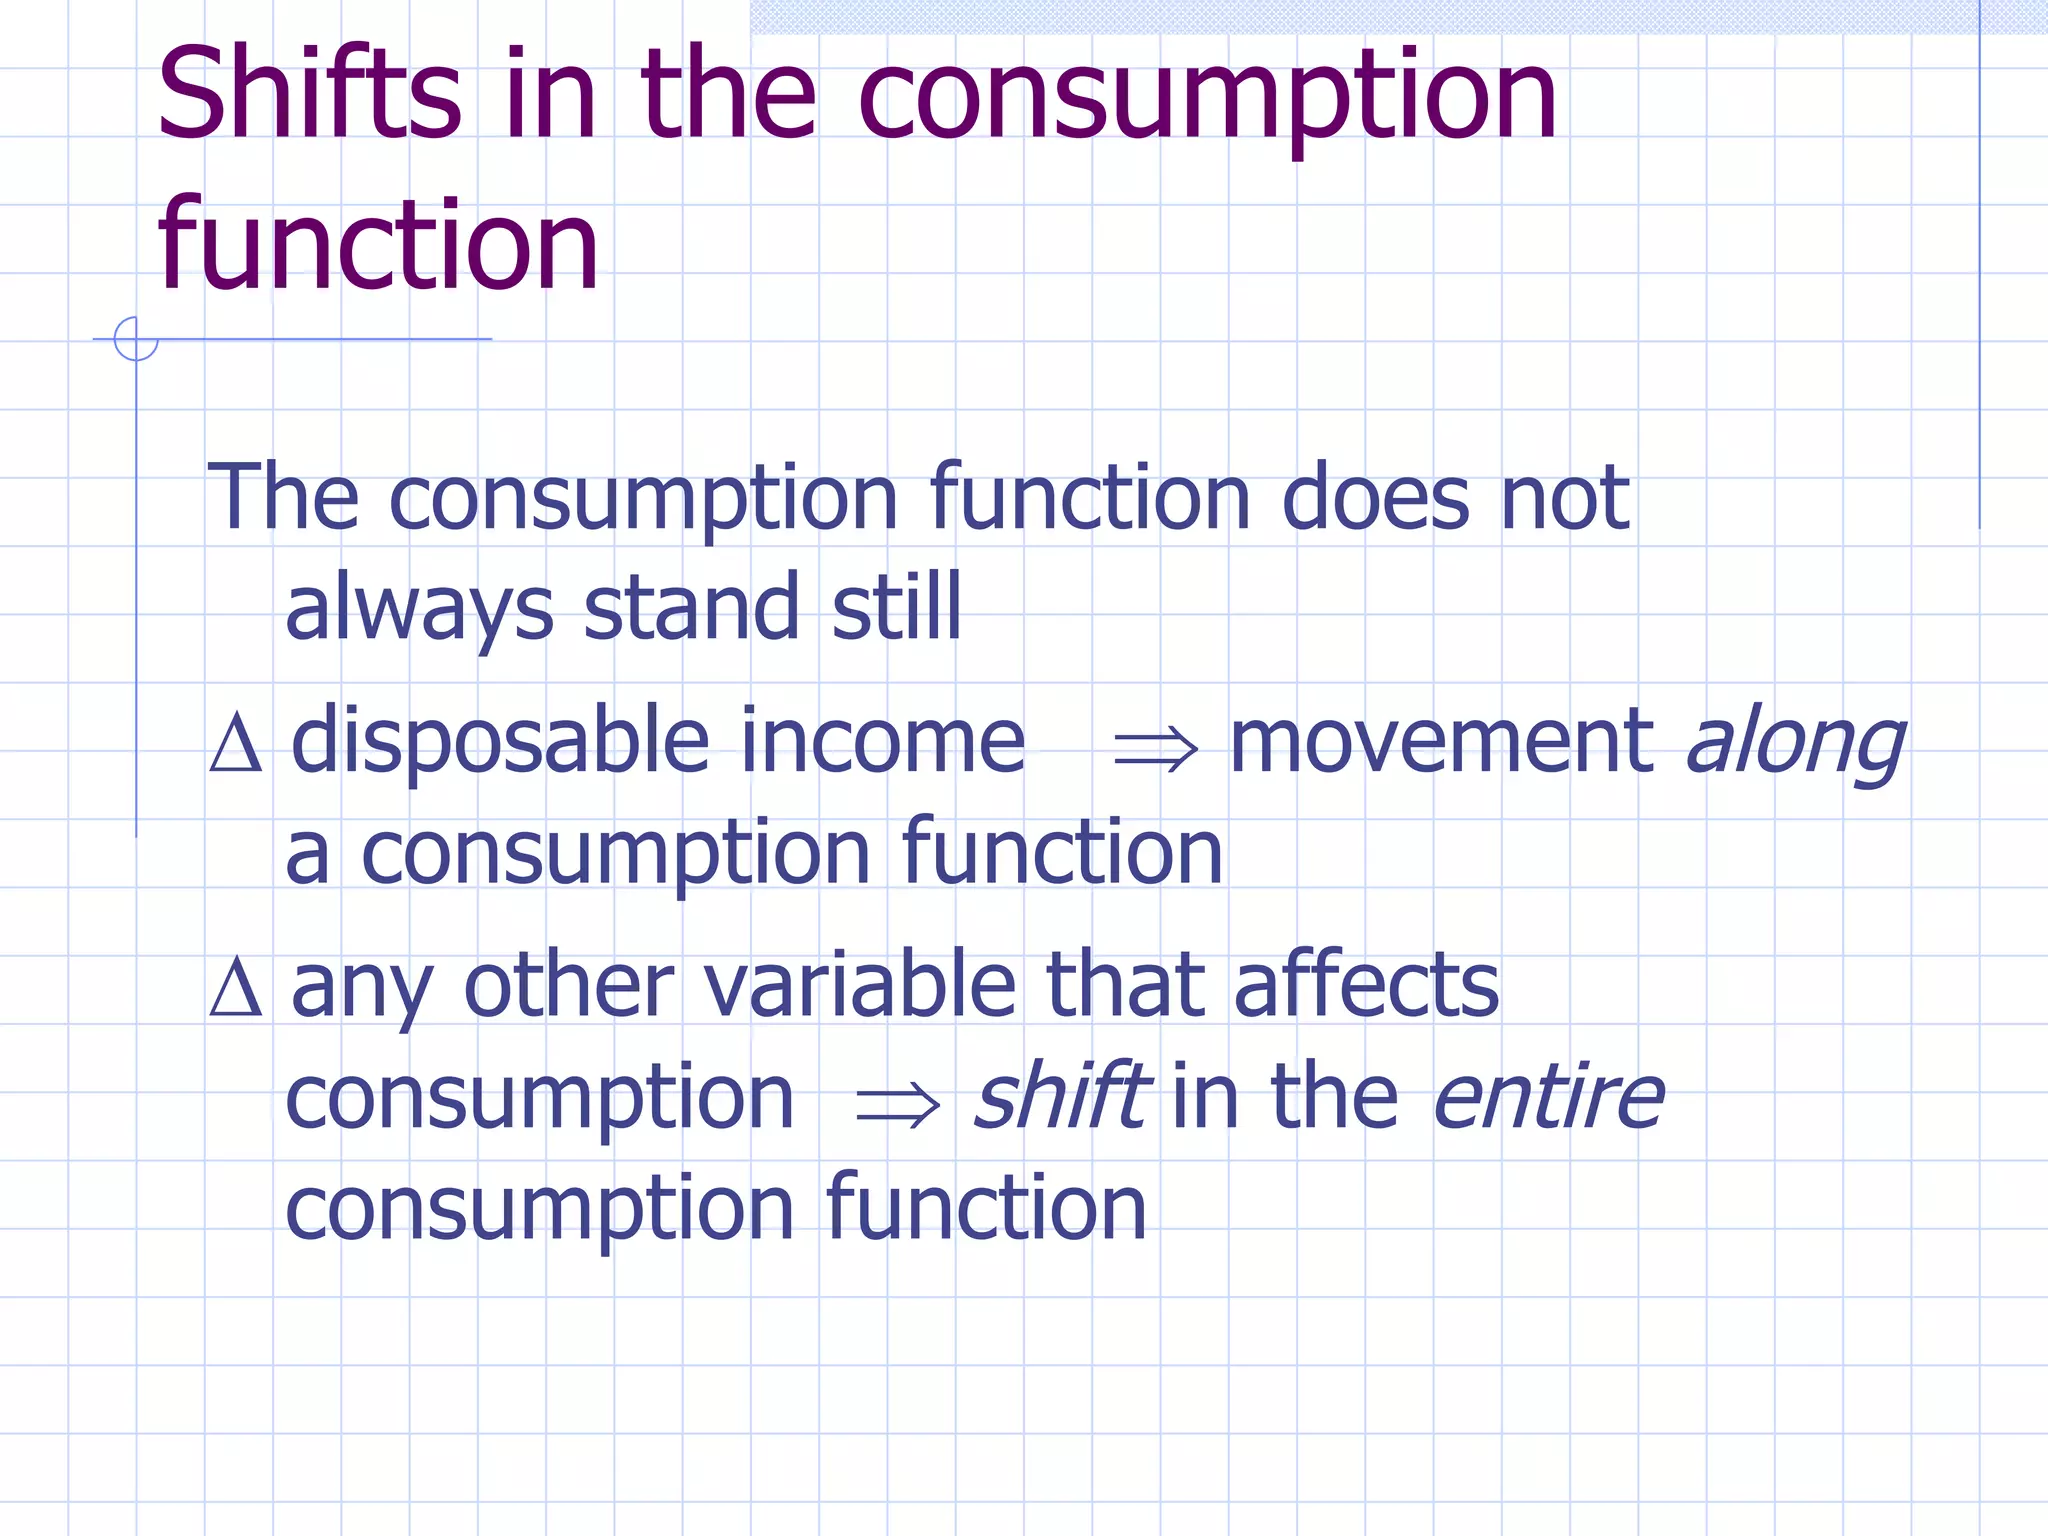
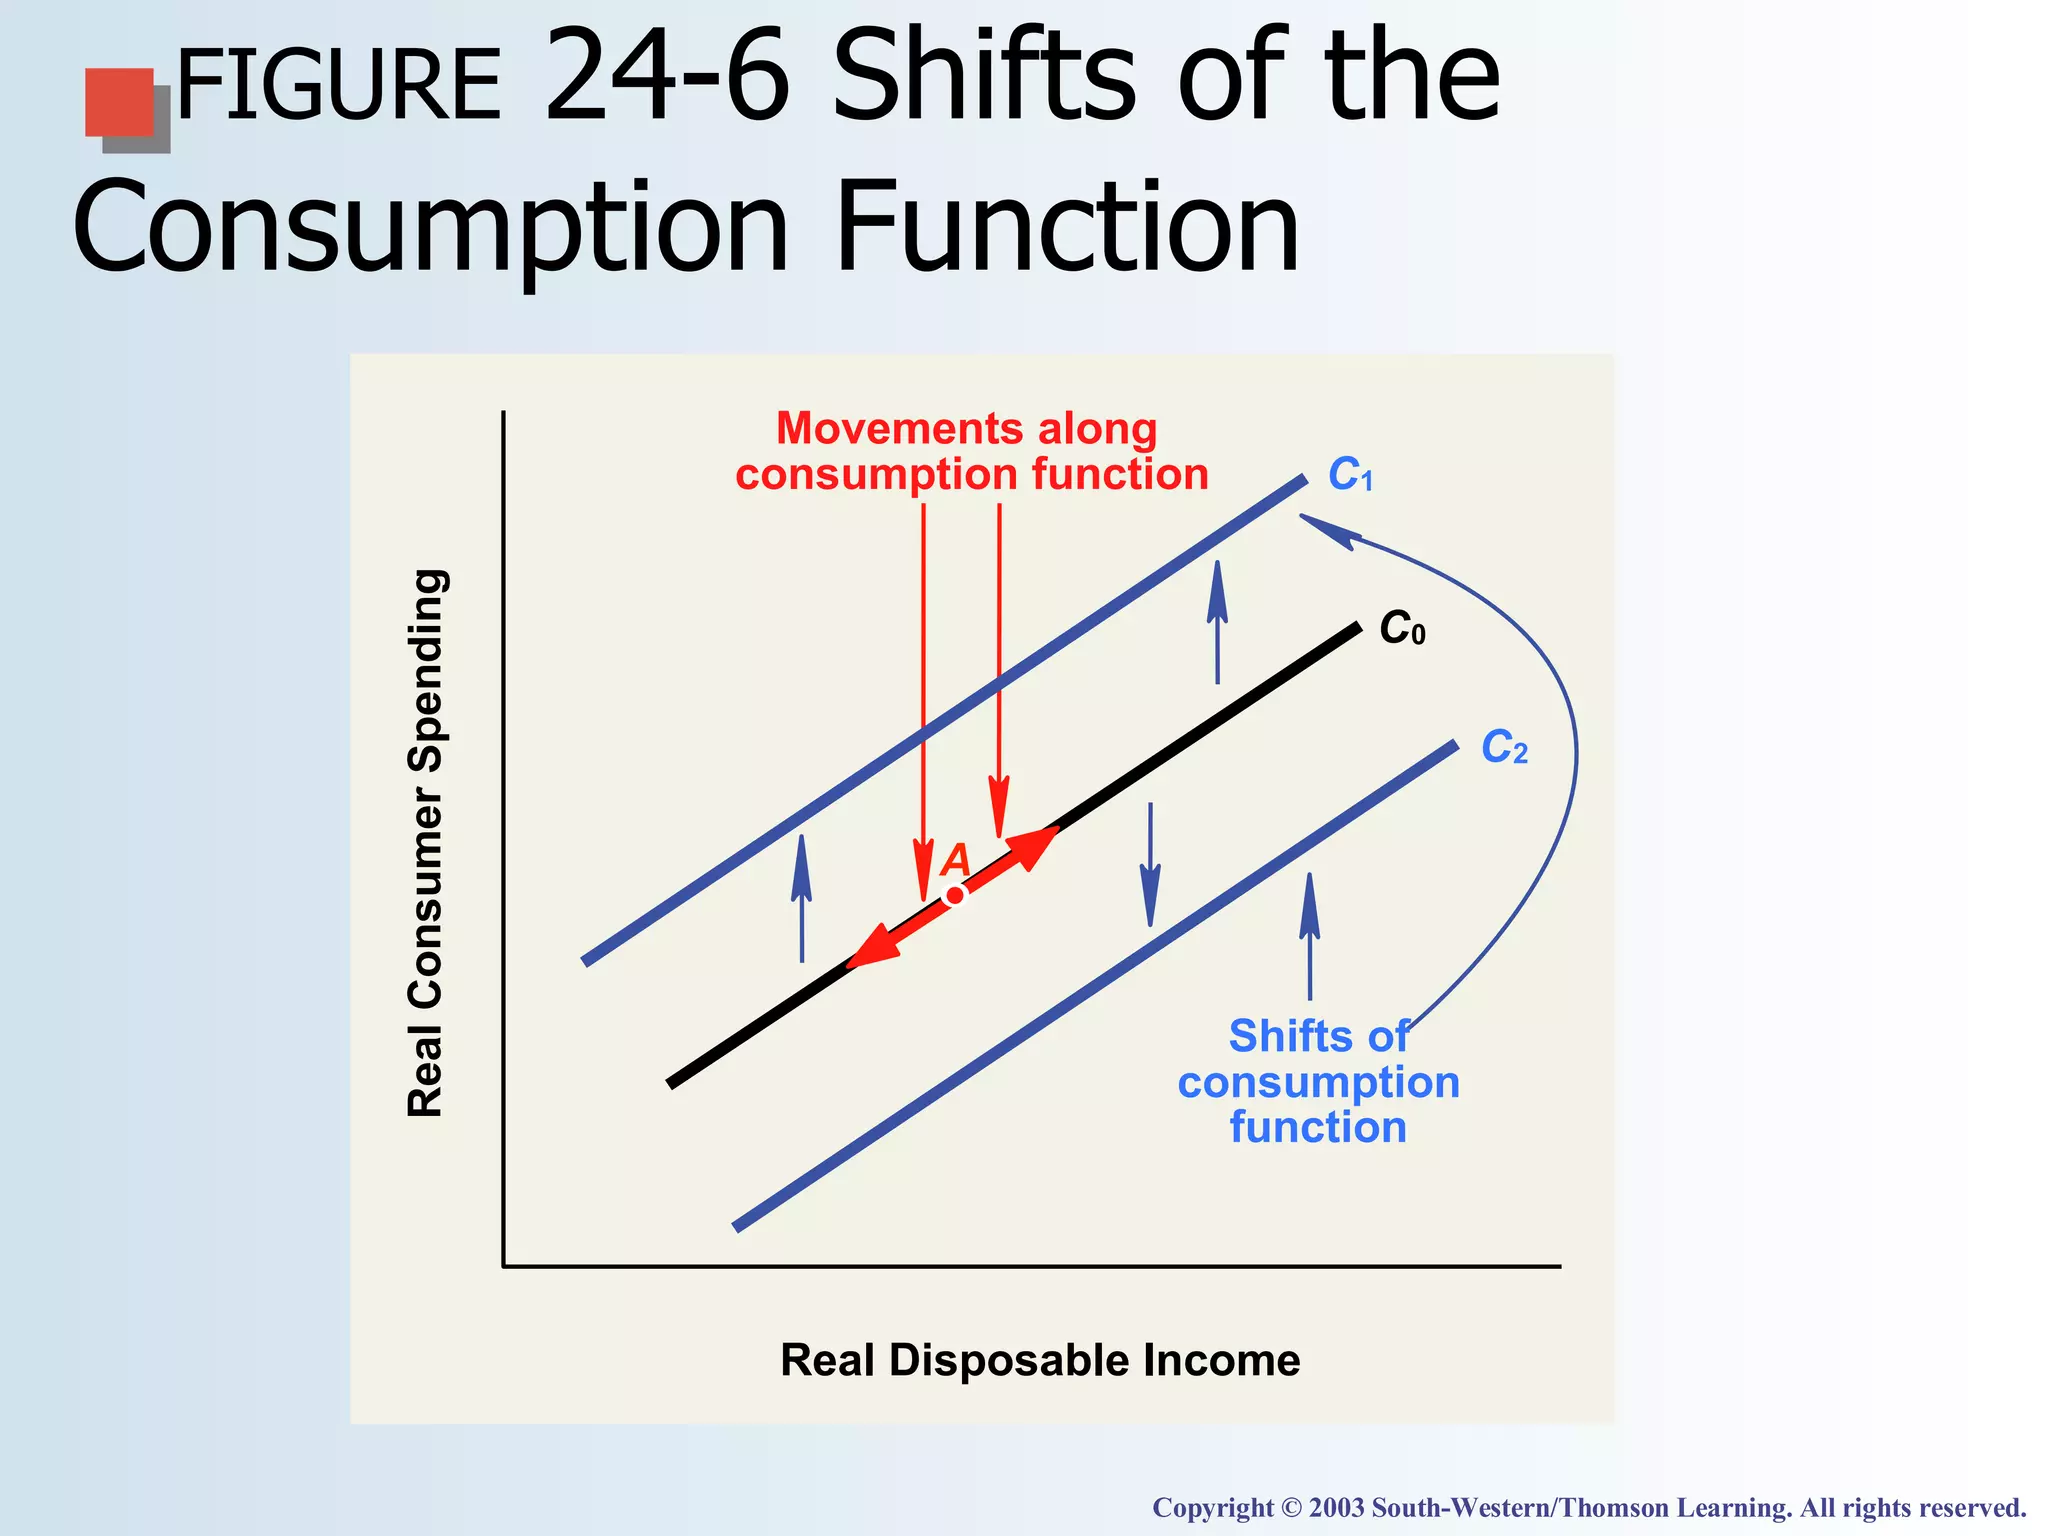
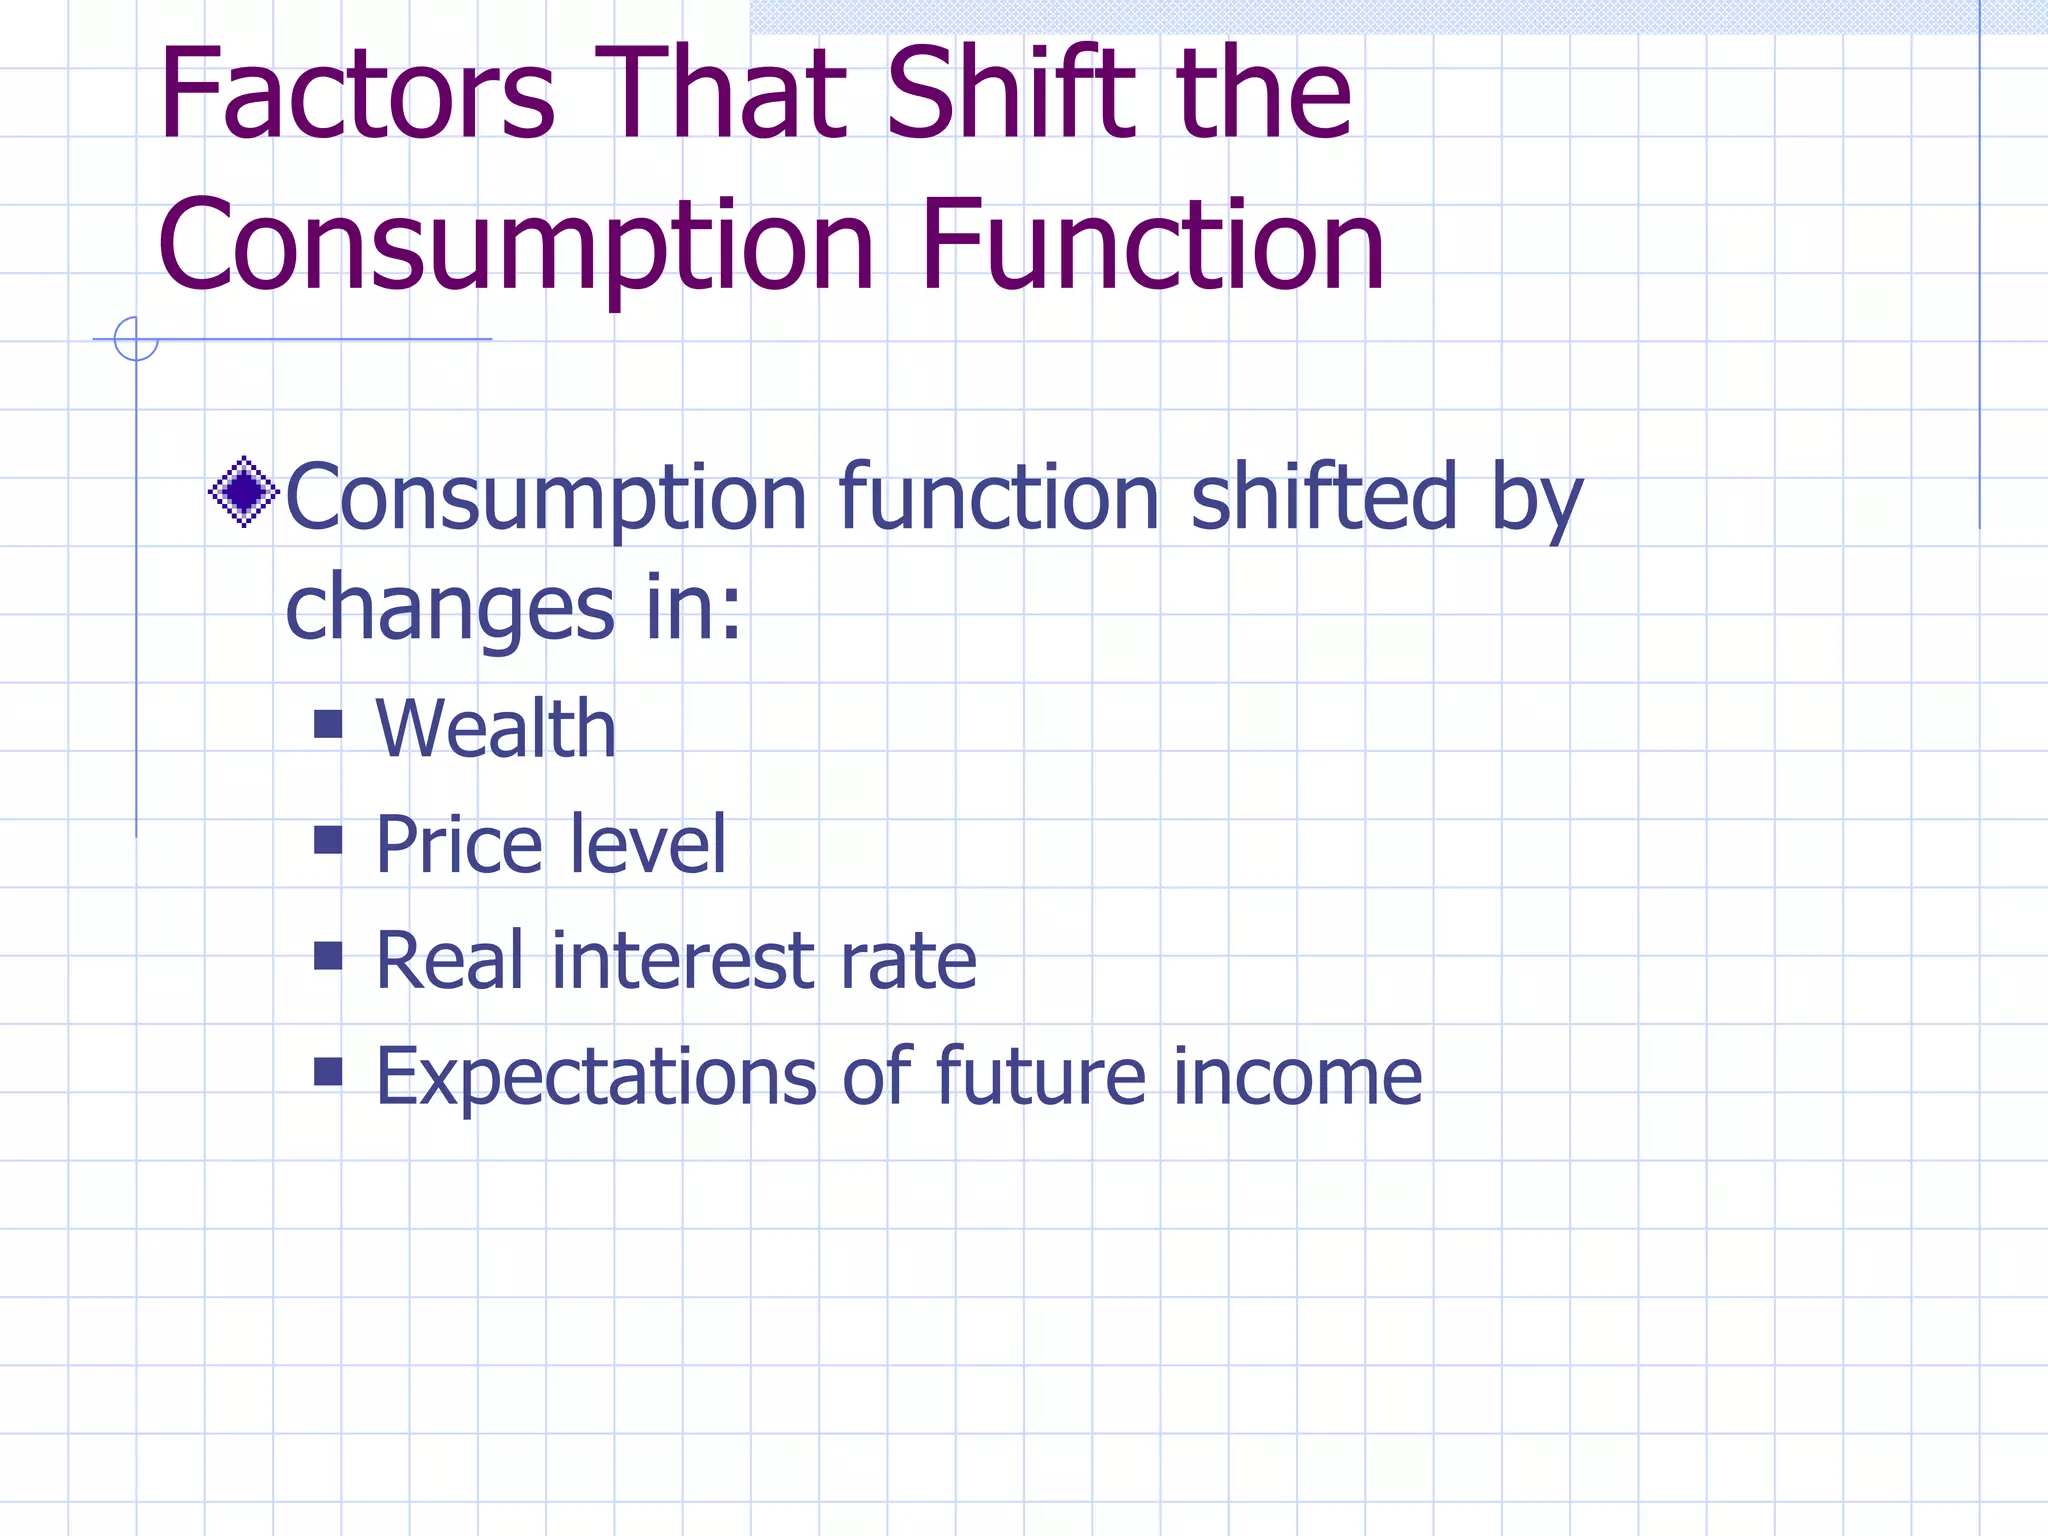
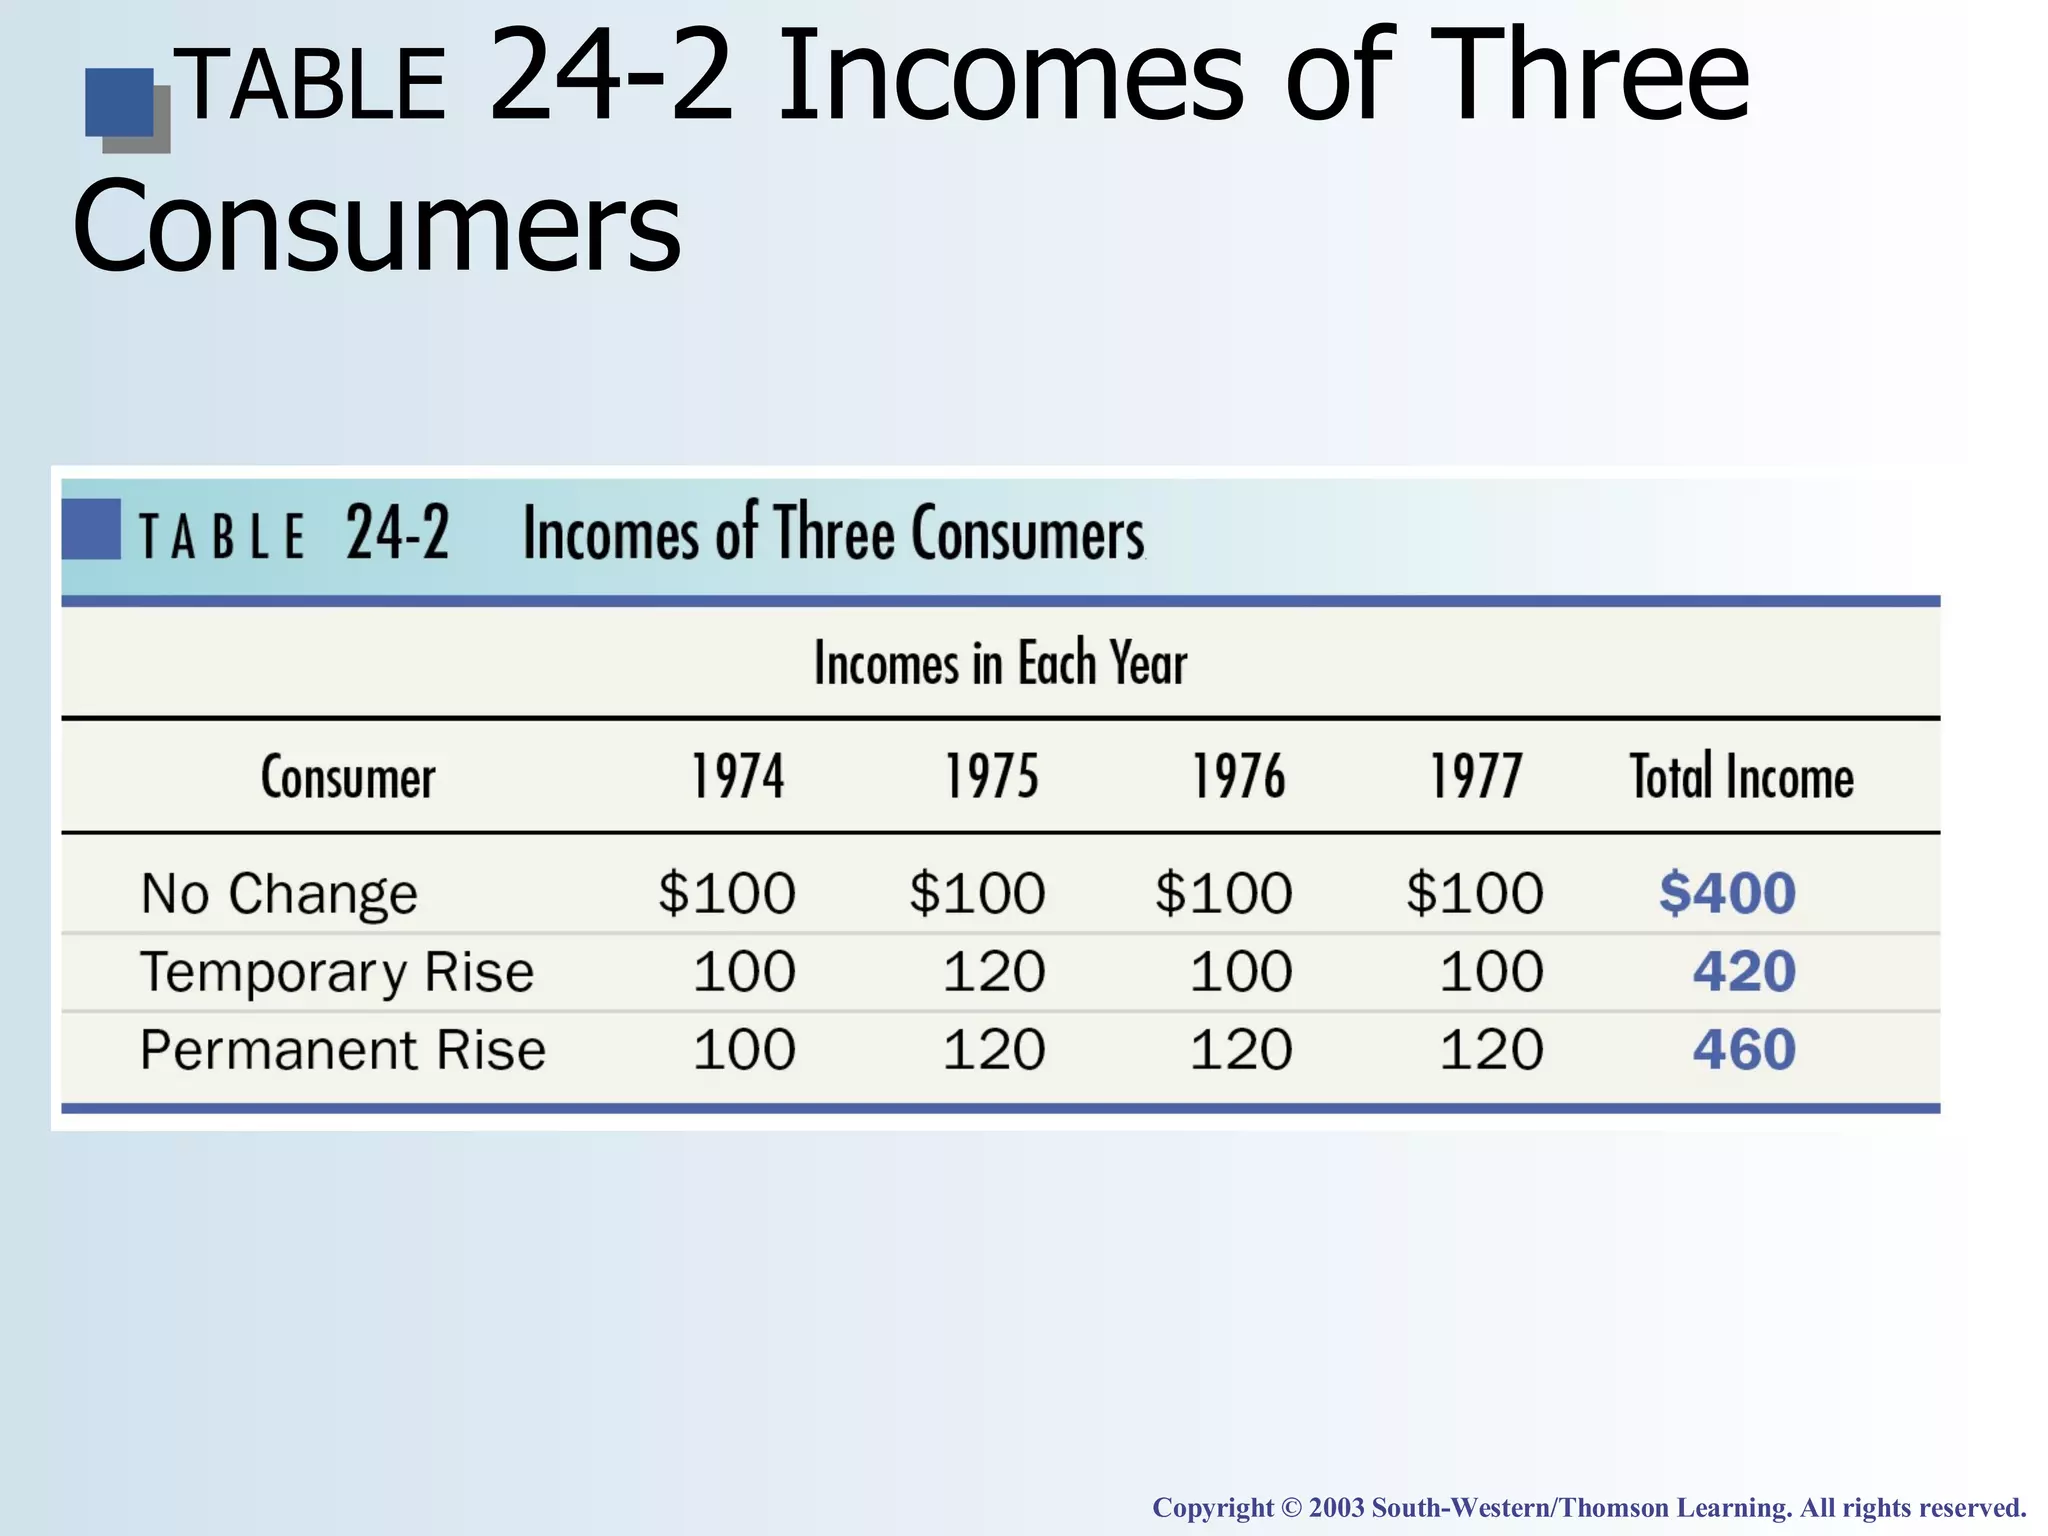
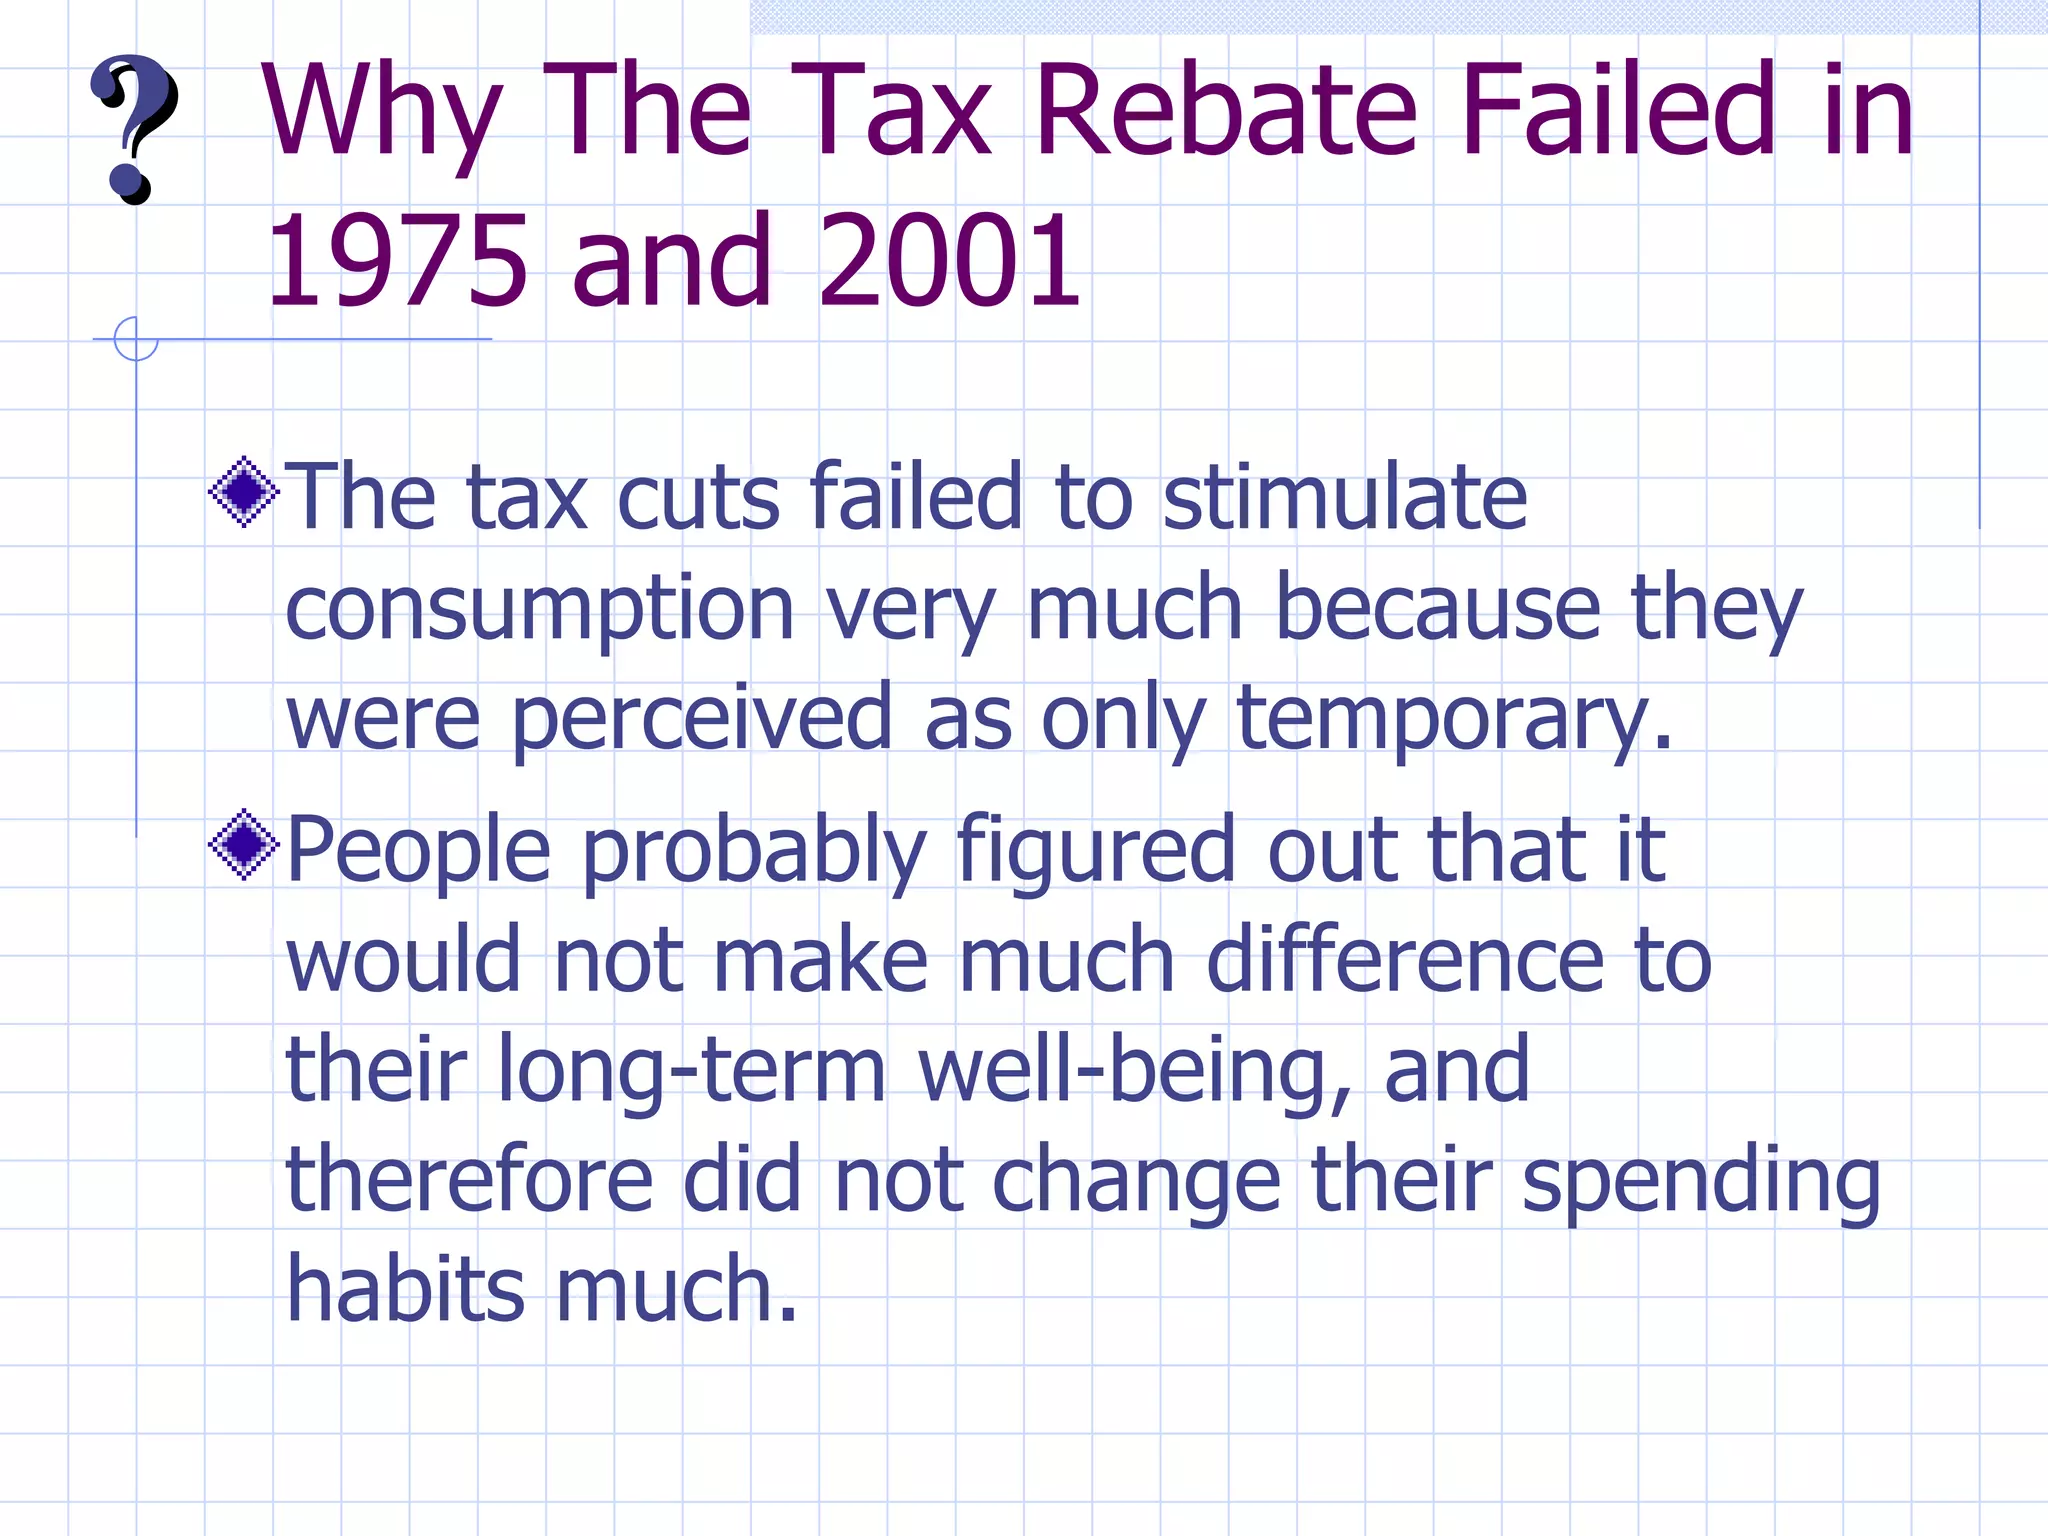
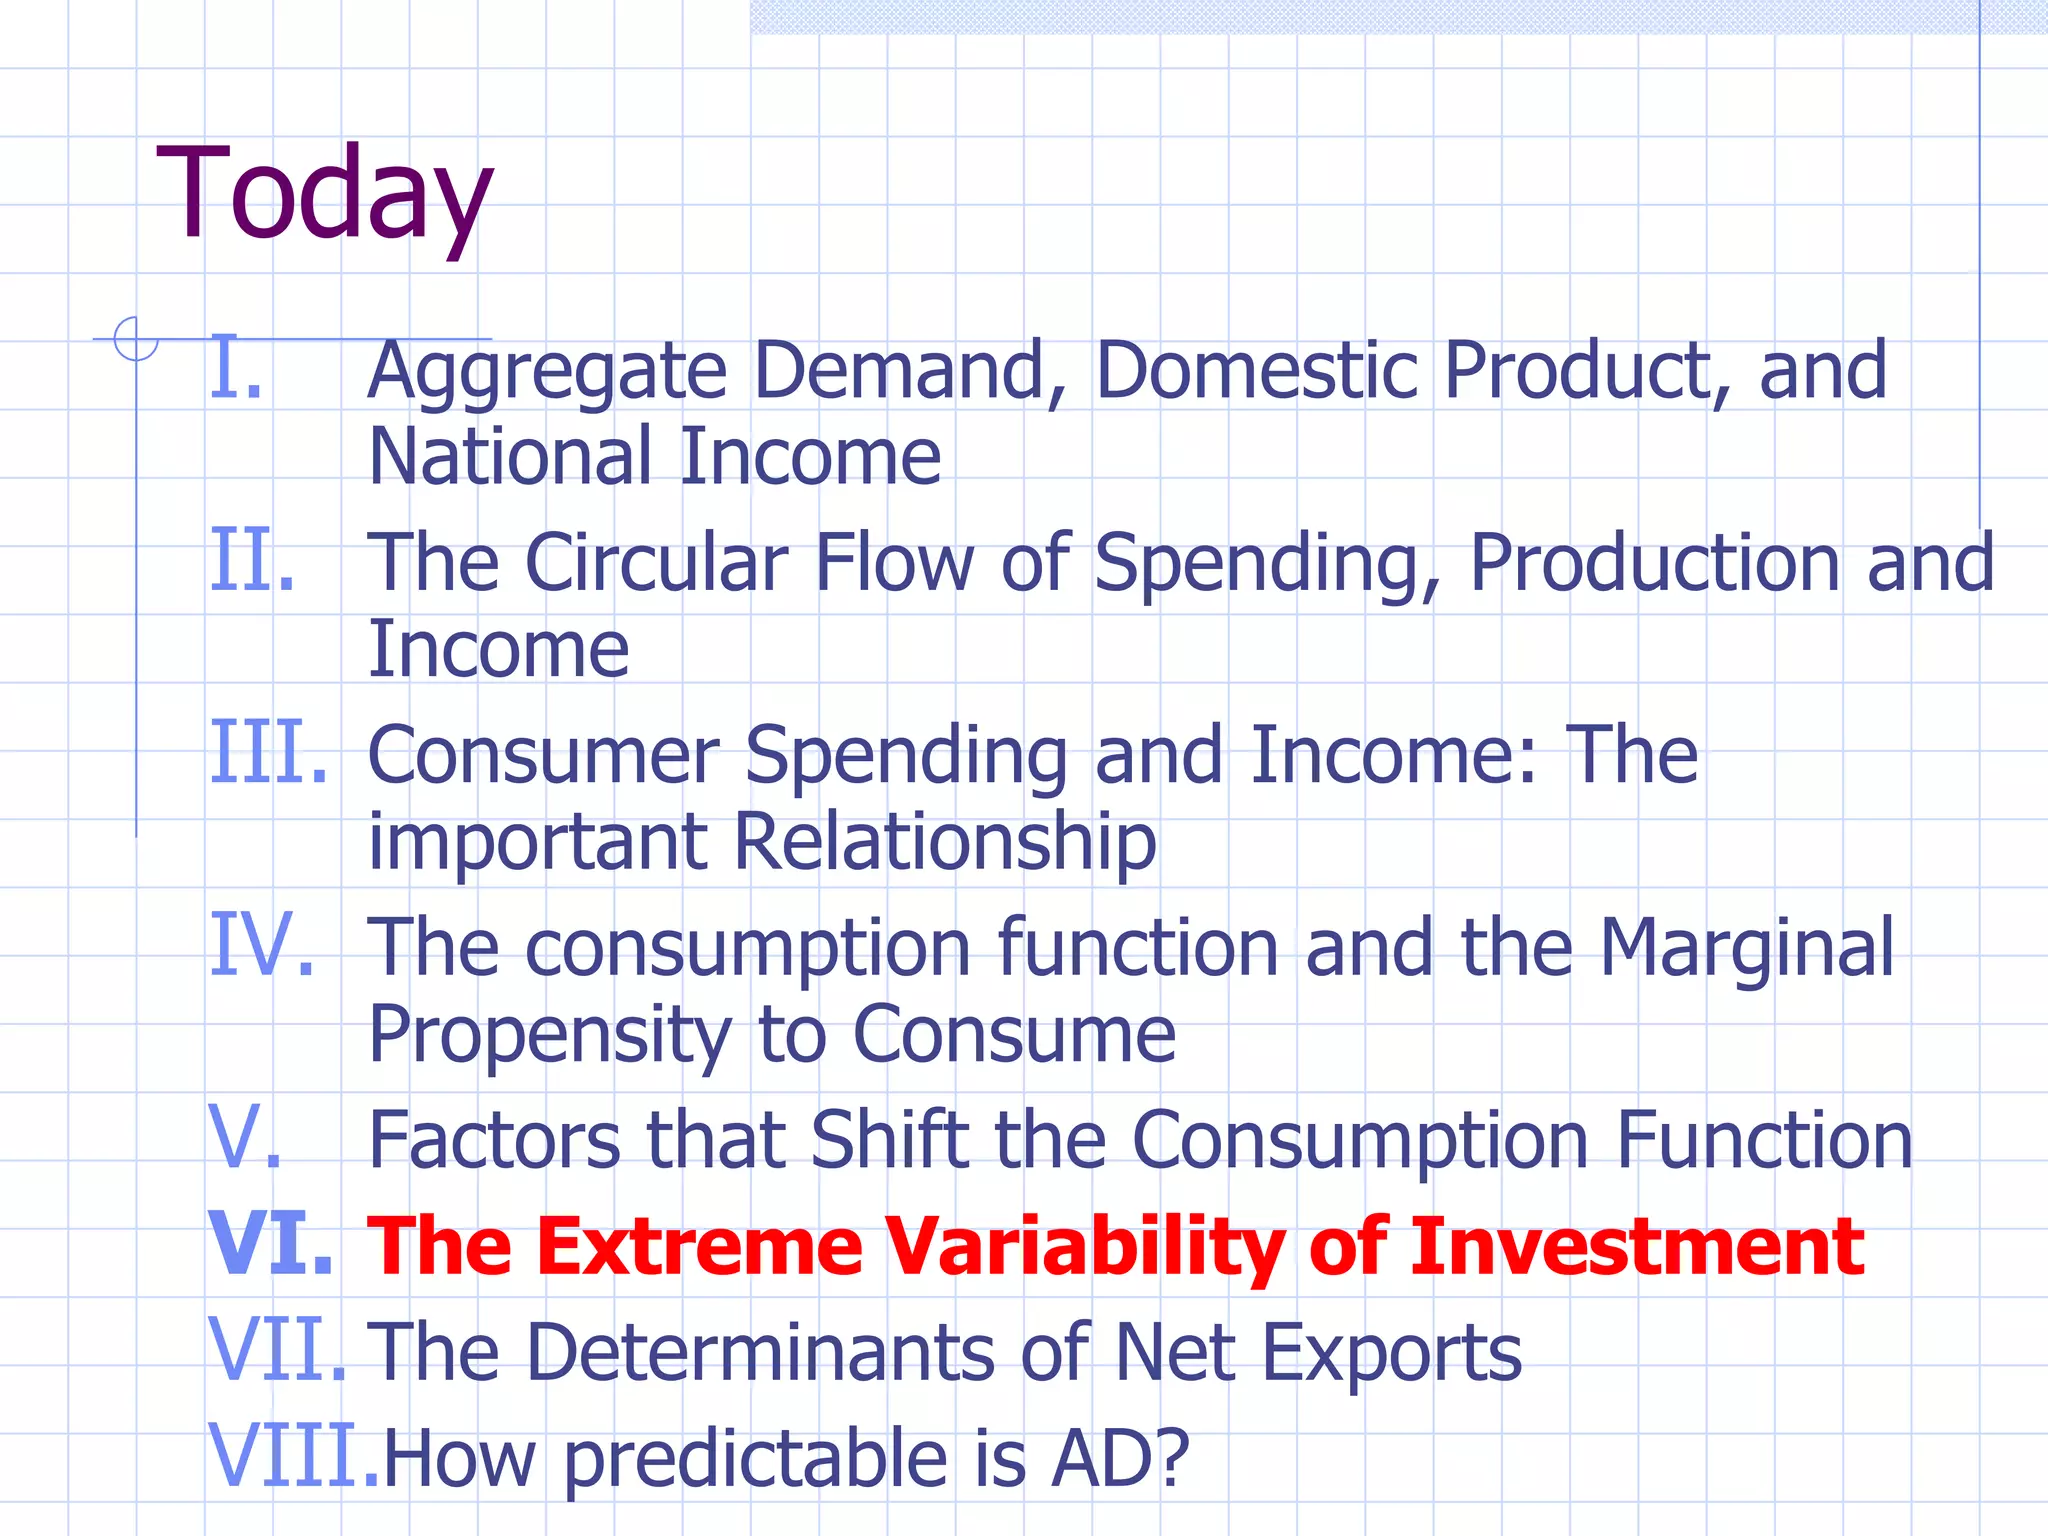
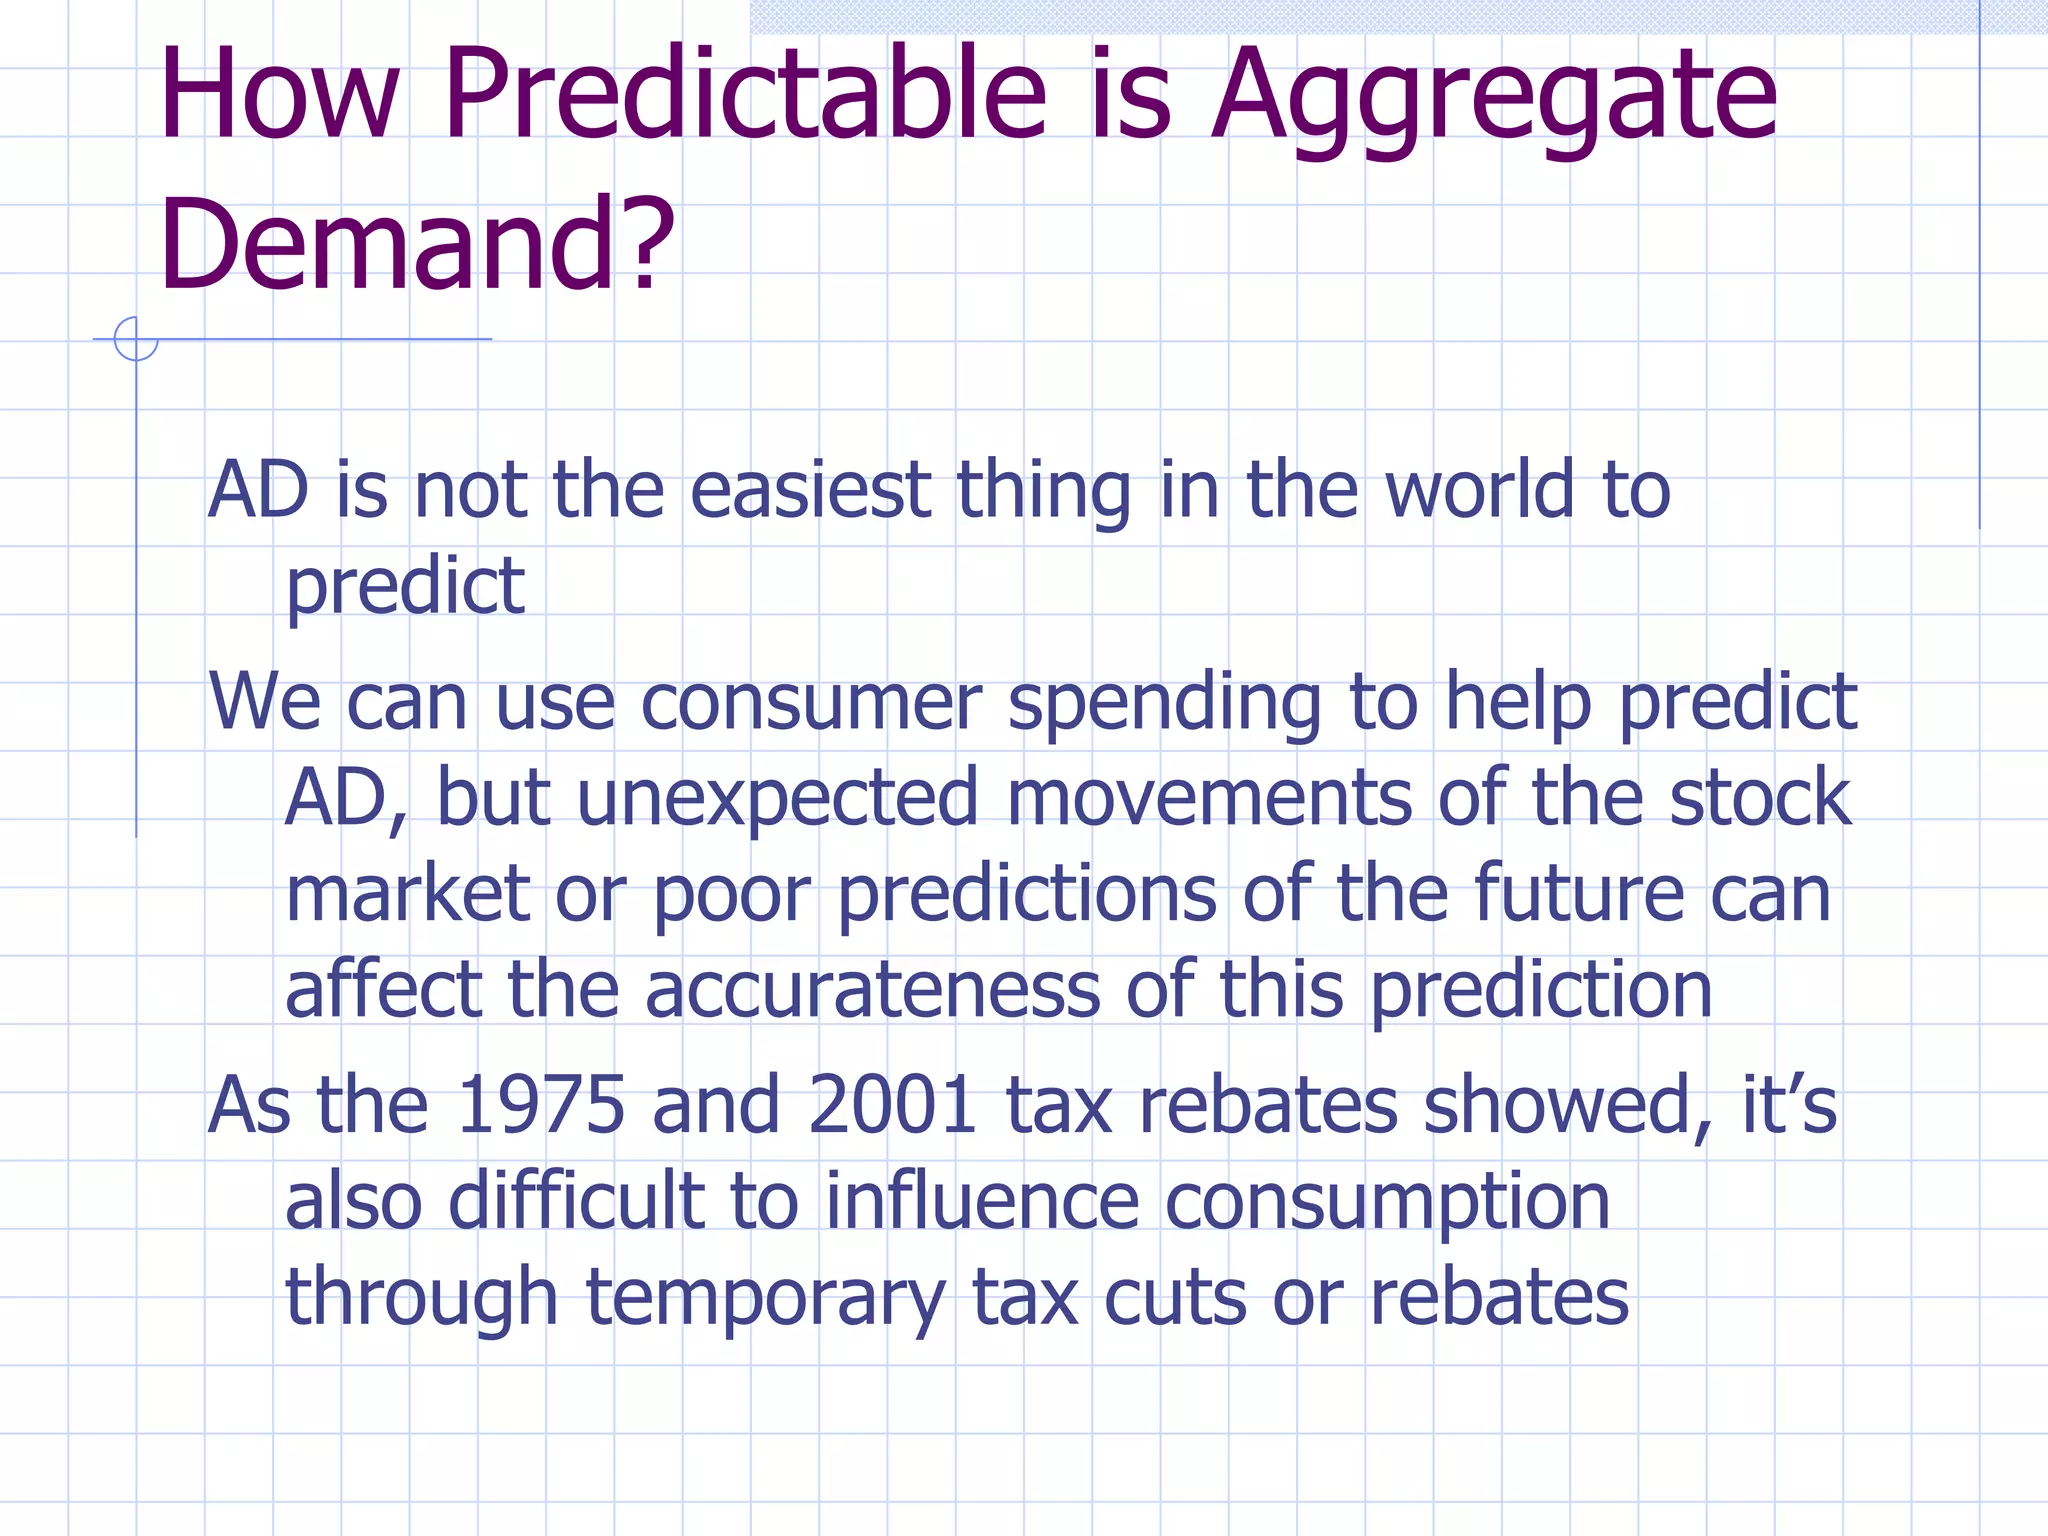
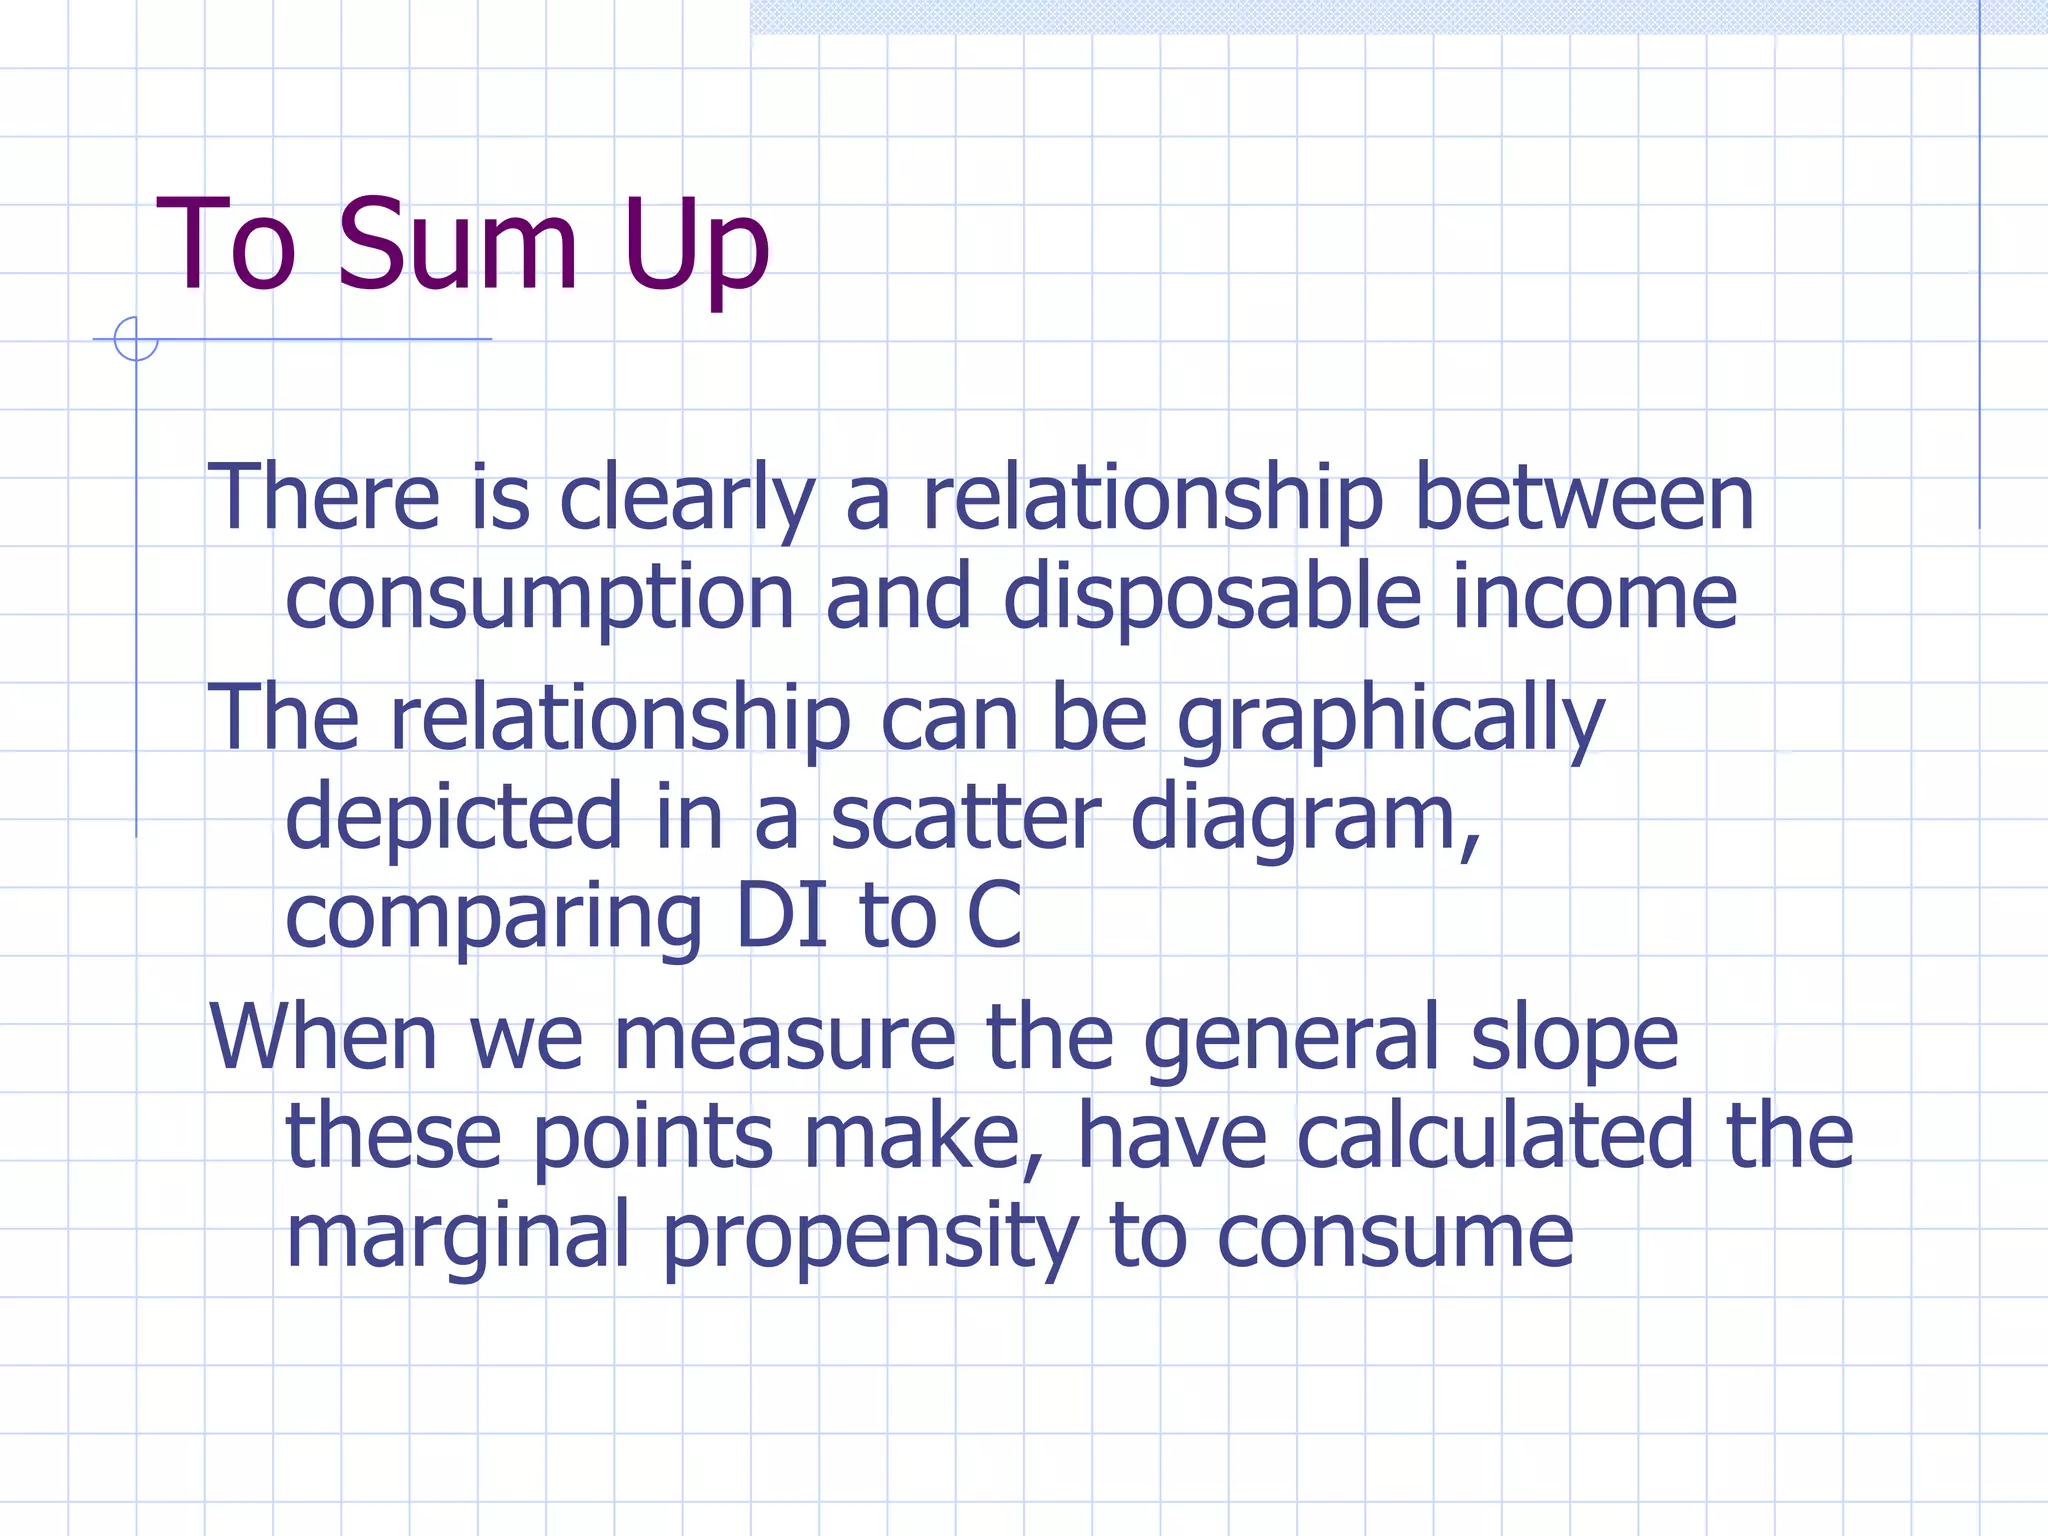
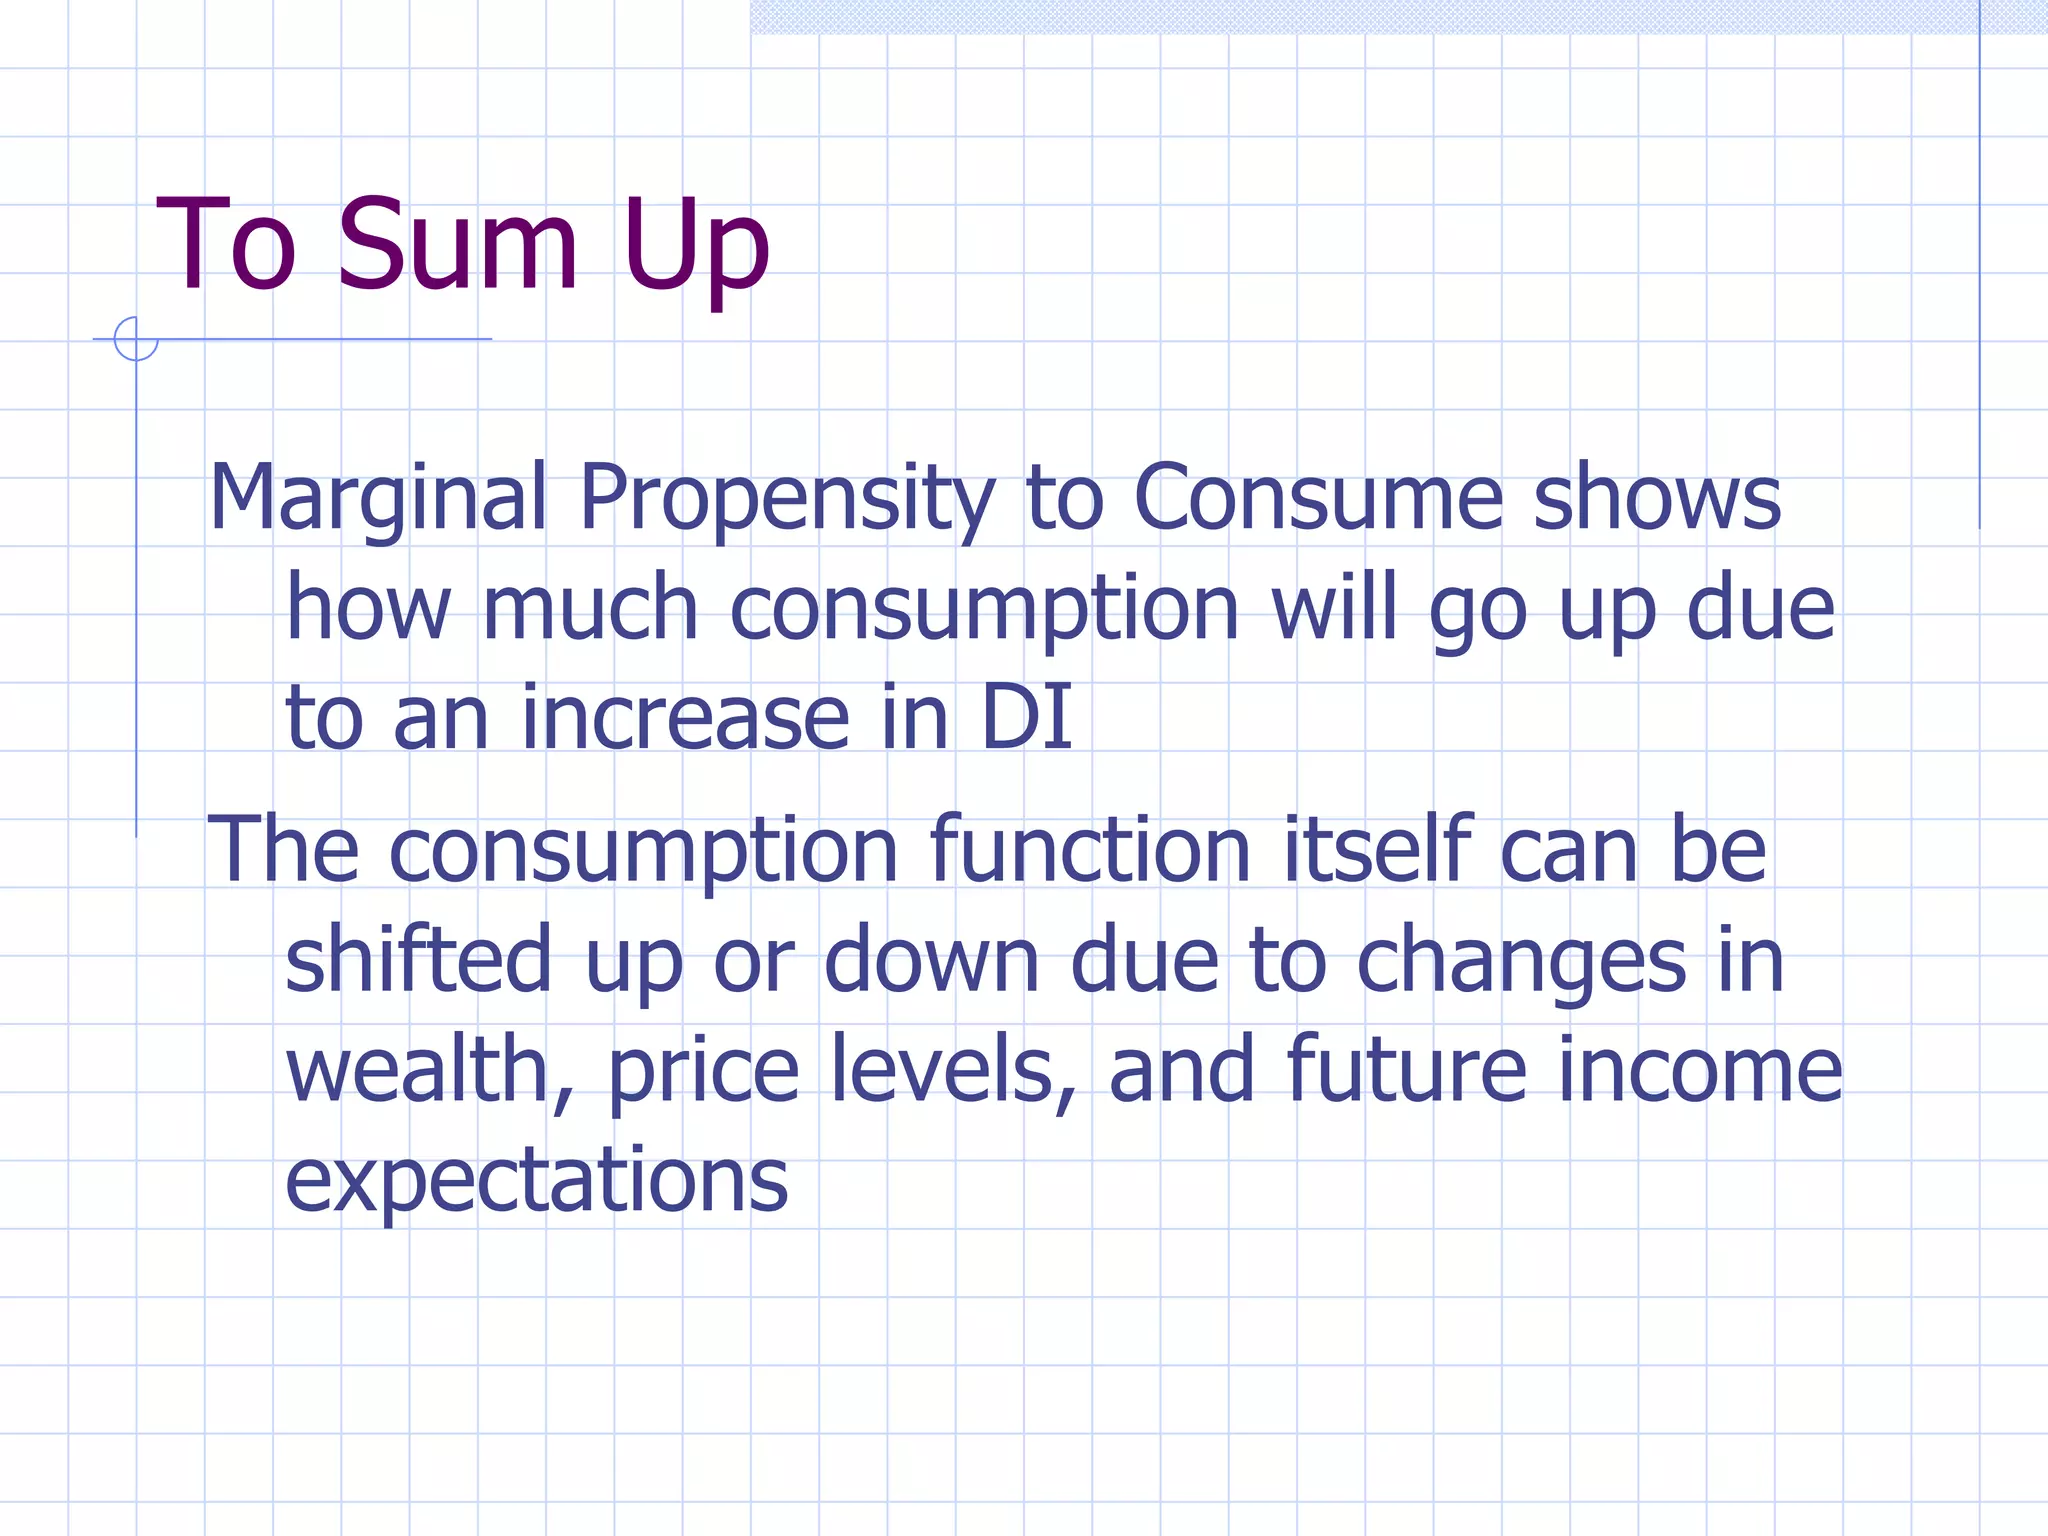
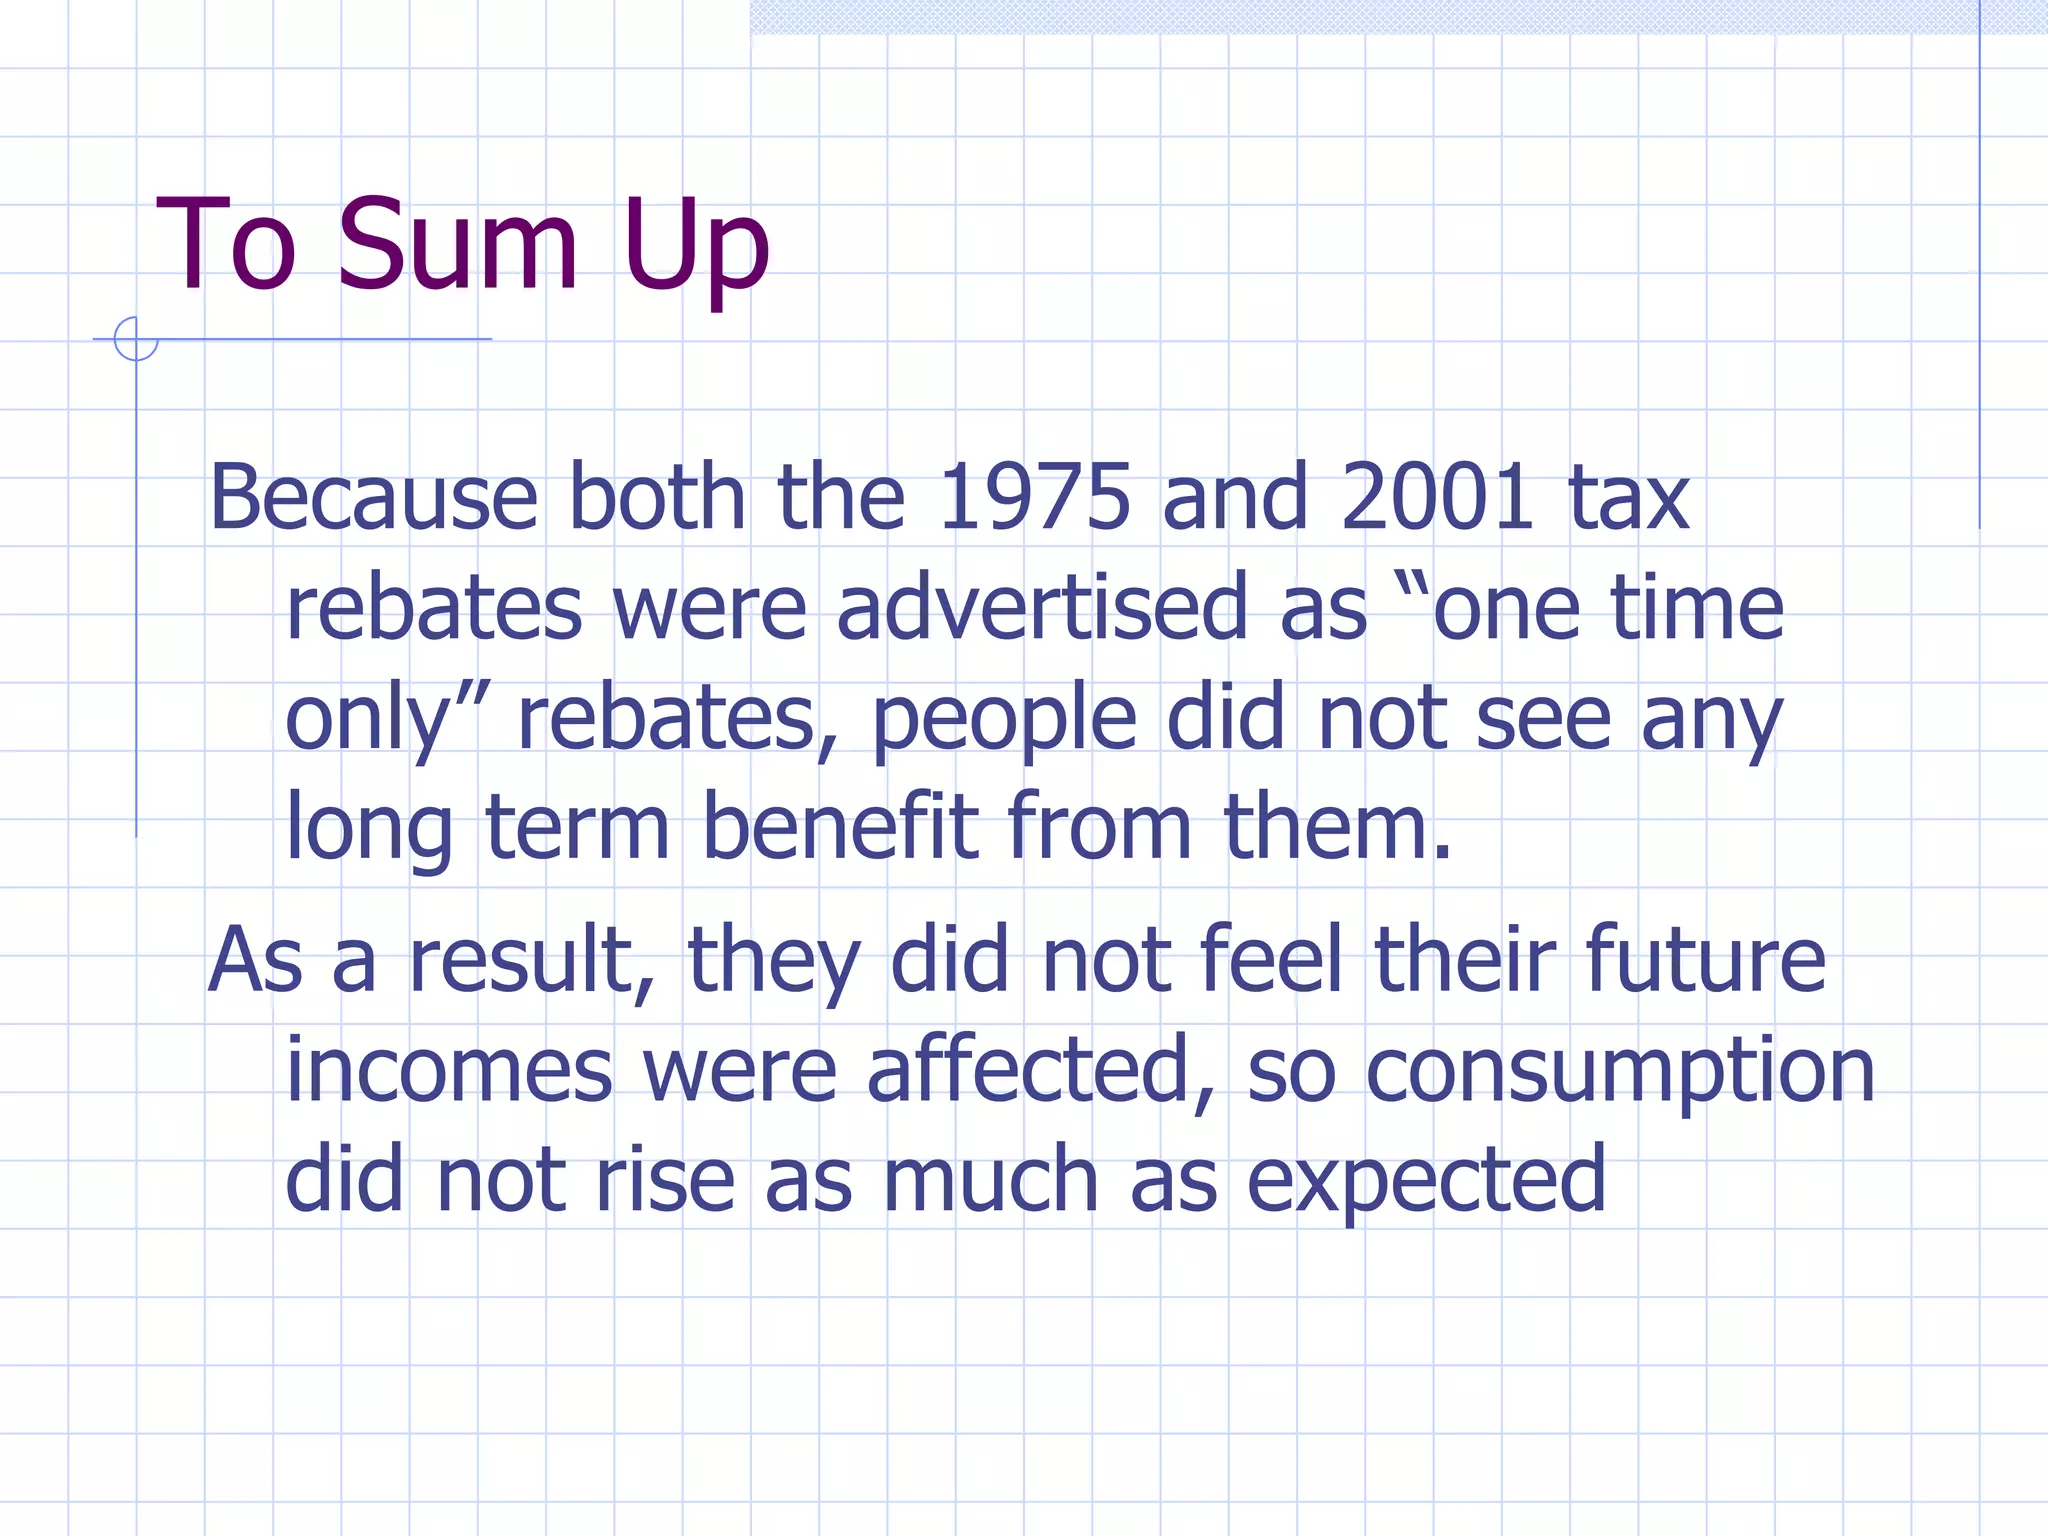
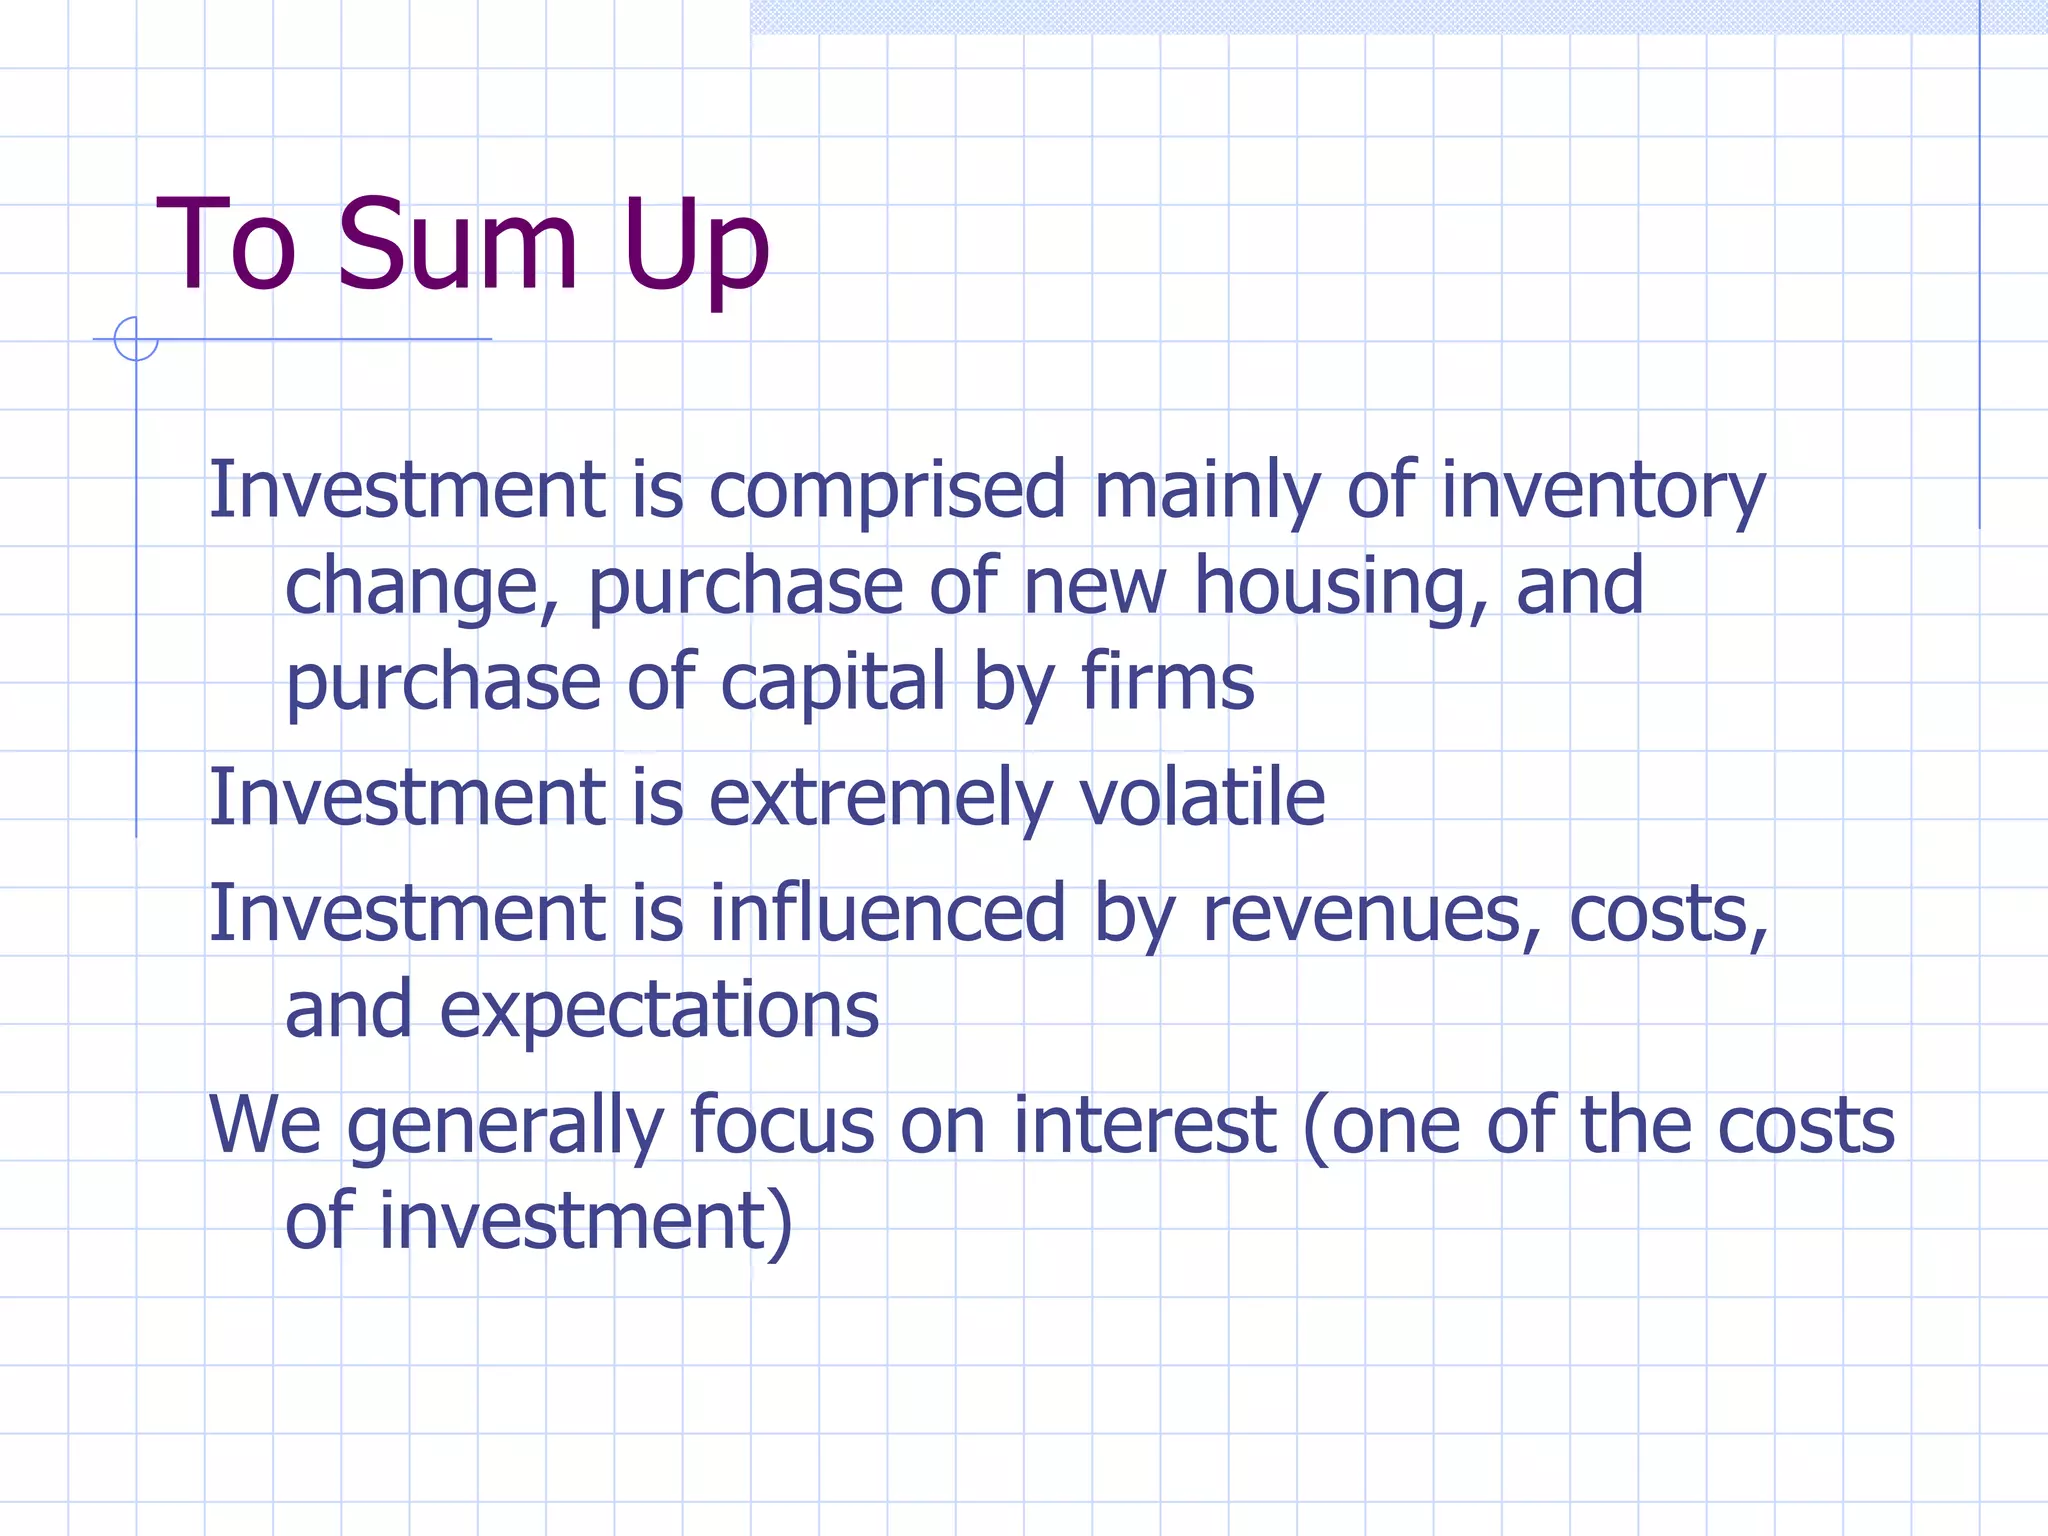
Today Aggregate Demand, Domestic Product, and National Income The Circular Flow of Spending, Production and Income Consumer Spending and Income: The important Relationship The consumption function and the Marginal Propensity to Consume Factors that Shift the Consumption Function The Extreme Variability of Investment The Determinants of Net Exports How predictable is AD?
Demand Management In our first lecture we introduced Aggregate Demand We discussed different ways the government can shift the AD curve 1.  Increase/decrease government spending 2.  Influence private spending through -Tax cuts -Other policy tools
Demand Management In 2000 George W. Bush wanted to increase consumer spending, so they issued a tax rebate But consumers actually wound up saving the large portion of the rebate, rather than using it to buy things. This is similar to what happened when congress issued a tax rebate in 1975 Why did this tax cut fail to achieve the desired goal?
Today Aggregate Demand, Domestic Product, and National Income The Circular Flow of Spending, Production and Income Consumer Spending and Income: The important Relationship The consumption function and the Marginal Propensity to Consume Factors that Shift the Consumption Function The Extreme Variability of Investment The Determinants of Net Exports How predictable is AD?
AD, Domestic Product, and National Income Aggregate Demand the total amount that all consumers, business firms, and government agencies are willing to spend on final goods and services AD is a schedule, not a fixed number: It shows the different quantities of total output demanded at different price levels AD = C Consumer  Expenditure +  I Investment +  G Government Purchases +  NX Net Exports
AD, Domestic Product, and National Income Consumer Expenditure  the total amount spent by consumers on newly produced goods and services (excluding purchases of new homes, which are considered investment goods) Investment Spending the sum of the expenditures of business firms on new plant and equipment and households on new homes. Financial “investments” are not included, nor are resales of existing physical assets.
AD, Domestic Product, and National Income Government Purchases the goods and services purchased by all levels of government. Net Exports the difference between U.S. exports and U.S. imports.  Indicates the difference between what we sell to foreigners and what we buy from them
BUT WAIT!!! This is the exact same formula we used to calculate GDP last week! How can these two be the same? 1.  Logically:  All of the things people are willing to buy must equal all of the things that people make and sell Pictorially
Today Aggregate Demand, Domestic Product, and National Income The Circular Flow of Spending, Production and Income Consumer Spending and Income: The important Relationship The consumption function and the Marginal Propensity to Consume Factors that Shift the Consumption Function The Extreme Variability of Investment The Determinants of Net Exports How predictable is AD?
FIGURE  24-1   The Circular Flow of Expenditures and Income 1 3 6 5 4 2 Investors Government Consumers Financial System Saving ( S ) Consumption (C) Investment (I) C  +  I Government C  +  I  +  G Imports ( IM ) Exports ( X ) C  +  I  +  G  + Transfers Disposable Income ( DI ) Taxes ( X  –  IM )  Purchases ( G ) Firms (produce the domestic product) Rest of the World Gross National Income ( Y )
Circular Flow of Spending, Production, and Income Circular flow diagram:  shows the relationship of the different components of expenditure and income National income=domestic product Wages plus rents plus interest plus  profits  equals output
AD, Domestic Product, and National Income National Income -the sum of the incomes that all individuals in the economy earned in the forms of wages, interest, rents, and profits.  -Excludes government transfer payments  -Pre-tax Not all national income goes directly to consumers!
FIGURE  24-1   The Circular Flow of Expenditures and Income 1 3 6 5 4 2 Investors Government Consumers Financial System Saving ( S ) Consumption (C) Investment (I) C  +  I Government C  +  I  +  G Imports ( IM ) Exports ( X ) C  +  I  +  G  + Transfers Disposable Income ( DI ) Taxes ( X  –  IM )  Purchases ( G ) Firms (produce the domestic product) Rest of the World Gross National Income ( Y )
National Income vs. Disposable Income Not all national income goes directly to consumers Some money is deducted in the form of taxes Some money is added in the form of transfer payments DI =  GDP - Taxes + Transfer Payments = GDP – (Taxes – Transfers) = Y - T
AD, Domestic Product, and National Income Disposable Income the sum of the incomes of all the individuals in the economy after all taxes have been deducted and all transfer payments have been added DI  =  GDP  -  Taxes  +  Transfers  =  Y - T
Some Questions To Think About: Does flow of spending and income grow larger or smaller as we move around the circle? Is the output that firms produce at point 5 (the GDP) equal to aggregate demand?  What makes these two quantities equal if so?  If not, what will happen?
Some Questions To Think About Do the government’s accounts balance so that net of transfers equals government spending?  If not, what happens? Is our international trade balanced so that exports equal imports?  What happens if we experience a trade surplus or trade deficit?
Today Aggregate Demand, Domestic Product, and National Income The Circular Flow of Spending, Production and Income Consumer Spending and Income: The important Relationship The consumption function and the Marginal Propensity to Consume Factors that Shift the Consumption Function The Extreme Variability of Investment The Determinants of Net Exports How predictable is AD?
Consumption Consumption is the single largest component of GDP, about 66% over the last decade Major components of consumption: Cars Food Medical Care
100 5,151 Total Consumption 865 Other 816 Medical Care 205 Transportation 310 Household operation 779 Housing 58 2,974 Services 375 Other 133 Energy 264 Clothing & Apparel 772 Food 30 1,545 Nondurable Goods 125 Other 254 Household Equipment 253 Motor Vehicles 12 632 Durable Goods Percent of total Value of category (1996, $, billion) Category of Consumption
Evolution of Consumption in the 20 th  Century 1918-US households spent 41% of income on food and drink 1999-19% Spending on apparel has fallen from 18% of income to 6% 1918-Americans spent 1% of income on automobiles Now-23% of spending on vehicle related transportation
Evolution of Consumption in the 20 th  Century Housing has risen from 14% to 20% of national income during this period Televisions, cell phones, and VCRs have increased entertainment expenses Biggest increase in consumption spending has been for health care
Consumption, Income, and Saving Consumption, Income, and Saving are all linked Personal saving  is the part of disposable income that is not consumed 4.9% Memo:  Saving as percent of personal DI 272 Equals:  Personal Saving 5,314 Less: Personal outlays (consumption +interest) 5,586 Equals:  Personal Disposable Income 864 Less:  Personal tax and nontax payments 6,450 Personal Income Amount, 1996 ($, billion) Item
Consumption, Saving, and Income 28,360 +1,640 30,000 27,830 +1,170 29,000 27,240 +760 28,000 26,600 +400 27,000 25,850 +150 26,000 25,000 0 25,000 24,110 -110 24,000 (3) Consumption ($) (2)  Net saving (+) or dissaving (-)  ($) (1) Disposable Income  ($)
FIGURE  24-2   Consumer Spending and Disposable Income Copyright © 2003 South-Western/Thomson Learning. All rights reserved. Real consumer spending  Real disposable income  Billions of 1996 Dollars  2000  1990  1980  1970  1960  1950  1940  1930  0  500  1,000  1,500  2,000  2,500  3,000  3,500  4,500  4,000  $6,500  6,000  5,500  5,000  World  War II  The Great  Depression
 
Consumption, Saving, and Income Clearly consumption and DI are related When DI rises, consumption rises When DI falls, consumption falls However we are still unclear on  how   much  DI influences consumption
Today Aggregate Demand, Domestic Product, and National Income The Circular Flow of Spending, Production and Income Consumer Spending and Income: The important Relationship The consumption function and the Marginal Propensity to Consume Factors that Shift the Consumption Function The Extreme Variability of Investment The Determinants of Net Exports How predictable is AD?
Consumption, Saving, and Income To understand the way consumption affects national output, we need some new tools. We need to look at how many extra dollars of consumption are induced by each extra dollar of disposable income This relationship is shown by the  consumption function
Consumer Spending and Income A scatter diagram with U.S. data shows the close relationship between real disposable income and real consumer spending.
FIGURE  24-3   Consumer Spending and Disposable Income Copyright © 2003 South-Western/Thomson Learning. All rights reserved. $3,244  $5,677  $5,237  $2,869  Real Consumer Spending  0  Real Disposable Income  2001  2000  1999  1998  1997  1995  1976  1996  1994  1992  1990  1991  1989  1988  1987  1986  1985  1980  1984  1979  1978  1974  1970  1964  1960  1955  1945  1943  1942  1947  1941  1939  1929
Consumer Spending and Income Assume in 1963 you want to calculate how much an increase in disposable income will increase consumption You could look at a scatter diagram of consumption vs. DI of the years leading up until that year
FIGURE  24-4   Consumer Spending and Disposable Income Copyright © 2003 South-Western/Thomson Learning. All rights reserved. 1900  1700  1500  1360  1300  1180  1100  900  1900  1700  1500  1300  1100  900  Real Disposable Income  Real Consumer Spending  0  B  A  $200  billion  $180 billion  1947  1963
Consumer Spending and Income When the data are converted into a consumption function diagram--with income on one axis and consumption on the other--the relationship between real consumer spending and real disposable income is almost linear, with a slope of about 0.9.
Consumer Spending and Income If there were a tax cut of $10 billion, effectively increasing DI by that amount, according to the graph how much would you expect consumption to increase by? How much would you expect savings to increase by?
The Consumption Function and the MPC Consumption function illustrates the relationship between total consumer expenditures and total disposable income in the economy, holding constant all other determinants of consumer spending. MPC  =    consumption       disposable income Can be used to estimate the initial effect on consumer spending of a tax cut
FIGURE  24-5   A Consumption Function Copyright © 2003 South-Western/Thomson Learning. All rights reserved. 5,200  4,800  4,400  4,000  3,600  3,200  0  2,700  3,000  3,300  3,600  3,900  $4,200  C  $400  $300  Real Disposable Income,  DI
TABLE  24-1   Consumption and Income in Hypothetical Economy Copyright © 2003 South-Western/Thomson Learning. All rights reserved.
A Consumption Function For simplicity, we assume that points of aggregate consumption, when plotted against aggregate income, lie along a straight line. The slope of the consumption function ( b ) is called the  marginal propensity to consume (MPC),  or the fraction of a change in income that is consumed, or spent.
A  Consumption Function Derived from the Equation  C  = 100 + .75 Y At a national income of zero, consumption is $100 billion ( a ). For every $100 billion increase in income (  Y ), consumption rises by $75 billion (  C ).
A Consumption Function Derived from the Equation  C  = 100 + .75 Y 850 1,000 700 800 550 600 400 400 250 200 175 100 160 80 100 0 AGGREGATE CONSUMPTION,  C (BILLIONS OF DOLLARS) AGGREGATE INCOME,  Y (BILLIONS OF DOLLARS)
Consumption and Saving Since there are only two places income can go:  consumption or saving, the fraction of additional income that is not consumed is the fraction saved.  The fraction of a change in income that is saved is called the  marginal propensity to save (MPS). Once we know how much consumption will result from a given level of income, we know how much saving there will be.  Therefore,
Marginal Propensity to Consume: Again MPC =  Change in Consumption _____________________________________________ Change in DI that produces the change in Consumption
An Aggregate Consumption Function Derived from the Equation  C  = 100 + .75 Y 850 1,000 700 800 550 600 400 400 250 200 175 100 160 80 100 0 AGGREGATE CONSUMPTION,  C (BILLIONS OF DOLLARS) AGGREGATE INCOME,  Y (BILLIONS OF DOLLARS)
Marginal Propensity to Consume MPC =  Change in Consumption _____________________________________________ Change in DI that produces the change in Consumption MPC =  $75 _____ $100 = 0.75
Marginal Propensity to Consume To estimate the initial effect of a tax cut on consumer spending,economists must first estimate the MPC and then multiply the amount of the tax cut by the estimated MPC Because they never know the true MPC with certainty, their prediction is always subject to some margin of error (Baumol, 2004)
.80 .85 .90 .95 1.0 Canada United States Netherlands United Kingdom Germany Italy Japan France GLOBAL  PERSPECTIVE Average Propensities to Consume, Selected Nations, 1999 Statistical Abstract of the United States, 2000  .986 .976 .972 .940 .907 .873 .869 .842
Today Aggregate Demand, Domestic Product, and National Income The Circular Flow of Spending, Production and Income Consumer Spending and Income: The important Relationship The consumption function and the Marginal Propensity to Consume Factors that Shift the Consumption Function The Extreme Variability of Investment The Determinants of Net Exports How predictable is AD?
Shifts in the consumption function The consumption function does not always stand still   disposable income    movement  along  a consumption function   any other variable that affects consumption     shift  in the  entire  consumption function
FIGURE  24-6   Shifts of the Consumption Function Copyright © 2003 South-Western/Thomson Learning. All rights reserved. Real Consumer Spending  Real Disposable Income  Shifts of  consumption  function  Movements along  consumption function  C 2  C 1  C 0  A
Factors That Shift the Consumption Function Consumption function shifted by changes in: Wealth Price level Real interest rate Expectations of future income
Shifts in the consumption function:  Wealth Not just income, but total amount of income  accumulated The more money I have, the more I will be willing to spend E.G. stock market booms and busts
Shifts in the consumption function:  Price Level Higher prices lower consumption Lower prices raise consumption Higher price levels = lower level of real wealth Lower price levels = higher level of real wealth
Shifts in the consumption function: The real interest rate High interest rate => lower consumption Low interest rate => raise consumption Makes sense theoretically,  BUT Studies have shown that interest rates have little to no influence on consumption
Shifts in the consumption function: future expectations If people think they will make more money in the future, they will be more willing to consume today If people are not optimistic about the future, they will be more likely to save today
A Return to our Initial Question Why didn’t the tax rebates of 1975 and 2001 result in the intended increase of consumption? Largely due to this concept of expectations of the future Examine three consumers, named “No Change,” “Temporary Rise,” and “Permanent Rise.”
TABLE  24-2   Incomes of Three Consumers Copyright © 2003 South-Western/Thomson Learning. All rights reserved.
Why The Tax Rebate Failed in 1975 and 2001 The tax cuts failed to stimulate consumption very much because they were perceived as only temporary. People probably figured out that it would not make much difference to their long-term well-being, and therefore did not change their spending habits much. ?
Today Aggregate Demand, Domestic Product, and National Income The Circular Flow of Spending, Production and Income Consumer Spending and Income: The important Relationship The consumption function and the Marginal Propensity to Consume Factors that Shift the Consumption Function The Extreme Variability of Investment The Determinants of Net Exports How predictable is AD?
Investment Investment is the most volatile of all AD components Does not follow movements in disposable income like consumption A 3.2 percent drop in growth rate from 2000-2001 was accompanied by a 14.1 percent drop in the growth rate of investment
Investment Because investment is volatile, it can have a major impact on AD, which affects output and employment in the short run Investment also leads to capital accumulation, which also increases potential output and growth in the long run
Investment Volatility of investment is largely attributed to  expectations of the future , which directly affect the  state of business confidence Difficult to measure, much less control Thus, economists concentrate on controlling other determinants of investment
Determinants of Investment The level of investment is determined by: Revenues Costs Expectations
Revenue as a determinant of investment Investment depends upon the revenues that will be generated by the state of overall economic activity Investment is thus very cyclical: Business downturn 1979-82, output fell sharply and investment fell by 22 percent
Costs as a determinant of investment Capital is a durable good (lasts a long time) Costs included in costs of capital: 1.  Price 2.  Interest Rate 3.  Taxes
Expectations as a determinant of investment Investment is a gamble on the future Businesses spend much energy analyzing investments and trying to narrow the uncertainties about their investments If future expectations are positive, businesses will invest more now
Today Aggregate Demand, Domestic Product, and National Income The Circular Flow of Spending, Production and Income Consumer Spending and Income: The important Relationship The consumption function and the Marginal Propensity to Consume Factors that Shift the Consumption Function The Extreme Variability of Investment The Determinants of Net Exports How predictable is AD?
Net Exports Net Exports are the third leg of AD to be discussed NX are also extremely variable Net Exports are determined by: National Incomes 2.  Relative prices and exchange rates
Year 2000 – US Trade with China By 1-digit SITC commodity In millions of dollars  Source: US Census Bureau 1-digit SITC Commodity  Exports  Imports (0) Food and Live Animals  472.95  1,021.17  (1) Beverages and Tobacco  4.93  32.53  (2) Crude Materials, Inedible, Except Fuels  2,566.50  614.03  (3) Mineral Fuels, Lubricants and Related Materials  59.77  729.76  (4) Animal and Vegetable Oils, Fats and Waxes  20.90  7.48  (5) Chemicals and Related Products, N.E.S.  2,325.37  1,809.46  (6) Manufactured Goods Classified Chiefly by Material  1,271.89  10,286.90  (7) Machinery and Transport Equipment  8,067.82  34,946.75  (8) Miscellaneous Manufactured Articles  1,240.14  49,475.39  (9) Commodities and Transactions, N.E.S.  222.76  1,139.49  Total  16,253.03  100,062.96
National Income and Imports Imports are positively related to income and output When GDP rises, US imports increase because some of the C + G + I come from foreign producers, and America uses foreign made inputs (like oil or steel) When GDP falls, imports fall
National Income and Exports Exports depend on foreign nations levels of output and income As foreign output rises, their demand for national products increases, as some of their C + I + G comes from our own nation Thus, as foreign output and income rises, national exports increase As foreign output and income falls, exports fall
National Income and Net Exports When our economy grows faster than economies we trade with, net exports shrink When economies we trade with grow faster than our economy, net exports grow US Economy stagnated 1990-1992 => net exports rose from -$55 billion to -$16 billion,  US Economy grew faster than other economies net exports fell from -$16 billion to -$380 billion
Relative Prices and Net Exports Relative prices are also important in determining net exports When comparing relative prices, we are looking at a rise or decline in the price of goods in two different countries If the prices rise in our country and fall in another country, our goods are now more expensive relative to the other country
Relative Prices and Net Exports A rise in the relative prices of a country’s goods will reduce net exports Foreign countries will be less willing to buy our products, and we will be more willing to buy theirs A drop in the relative prices of a country’s goods will increase net exports We will be less willing to buy foreign country’s products, and they will be more willing to buy ours
Relative Prices and Net Exports A rise in the relative prices of a  foreign  country’s goods will increase net exports We will be less willing to buy their products, and they will be more willing to buy ours A drop in the relative prices in a  foreign  country’s goods will decrease net exports We will be more willing to buy their products, and they will be less willing to buy ours
Relative Prices and Exchange Rates Consider a CharLeenese car that costs 3 million CharLeenese  Chars If 1 dollar = 100  Chars , then: 1 car = $30,000 But if the exchange rate changes 1 dollar = 150  Chars , then: 1 car = $20,000
Today Aggregate Demand, Domestic Product, and National Income The Circular Flow of Spending, Production and Income Consumer Spending and Income: The important Relationship The consumption function and the Marginal Propensity to Consume Factors that Shift the Consumption Function The Extreme Variability of Investment The Determinants of Net Exports How predictable is AD?
How Predictable is Aggregate Demand? AD is not the easiest thing in the world to predict We can use consumer spending to help predict AD, but unexpected movements of the stock market or poor predictions of the future can affect the accurateness of this prediction As the 1975 and 2001 tax rebates showed, it’s also difficult to influence consumption through temporary tax cuts or rebates
How Predictable is Aggregate Demand? Investment is more volatile than consumption, and thus even more difficult to predict This is partly because investment is so strongly related to expectations of the future and confidence, which is next to impossible to calculate, much less control
How Predictable is Aggregate Demand? Net exports are affected both by developments at home, as well as developments abroad. Thus, it’s not easy to predict net exports, as so much of their determination is out of our hands Even government spending is not as predictable as you would think
To Sum Up Aggregate Demand can be viewed as a schedule of different levels of output demanded at different prices levels AD is comprised of consumption, investment, government spending, and net exports
To Sum Up Examining the circular flow of expenditures and income diagram, we can see that national income and domestic product must, for the most part, be equal Disposable income equals national income minus taxes plus transfers
To Sum Up There is clearly a relationship between consumption and disposable income The relationship can be graphically depicted in a scatter diagram, comparing DI to C When we measure the general slope these points make, have calculated the marginal propensity to consume
To Sum Up Marginal Propensity to Consume shows how much consumption will go up due to an increase in DI The consumption function itself can be shifted up or down due to changes in wealth, price levels, and future income expectations
To Sum Up Because both the 1975 and 2001 tax rebates were advertised as “one time only” rebates, people did not see any long term benefit from them. As a result, they did not feel their future incomes were affected, so consumption did not rise as much as expected
To Sum Up Investment is comprised mainly of inventory change, purchase of new housing, and purchase of capital by firms Investment is extremely volatile Investment is influenced by revenues, costs, and expectations We generally focus on interest (one of the costs of investment)
To Sum Up Net exports are determined by national incomes and relative prices NX are determined by both our national incomes, as well as foreign national incomes We have little control over foreign prices as well As a result, NX is not very controllable
To Sum Up AD is not an easy thing to predict Consumption can be affected by unexpected changes in wealth in the future, or plain poor prediction of future market conditions Investment is highly volatile Net exports are partially determined by other countries Government spending is not as predictable as one would have guessed
NOW GO AWAY! Next lecture Chapter 8

Char Lee Econ Lecture 22

  • 1.
    Today Aggregate Demand,Domestic Product, and National Income The Circular Flow of Spending, Production and Income Consumer Spending and Income: The important Relationship The consumption function and the Marginal Propensity to Consume Factors that Shift the Consumption Function The Extreme Variability of Investment The Determinants of Net Exports How predictable is AD?
  • 2.
    Demand Management Inour first lecture we introduced Aggregate Demand We discussed different ways the government can shift the AD curve 1. Increase/decrease government spending 2. Influence private spending through -Tax cuts -Other policy tools
  • 3.
    Demand Management In2000 George W. Bush wanted to increase consumer spending, so they issued a tax rebate But consumers actually wound up saving the large portion of the rebate, rather than using it to buy things. This is similar to what happened when congress issued a tax rebate in 1975 Why did this tax cut fail to achieve the desired goal?
  • 4.
    Today Aggregate Demand,Domestic Product, and National Income The Circular Flow of Spending, Production and Income Consumer Spending and Income: The important Relationship The consumption function and the Marginal Propensity to Consume Factors that Shift the Consumption Function The Extreme Variability of Investment The Determinants of Net Exports How predictable is AD?
  • 5.
    AD, Domestic Product,and National Income Aggregate Demand the total amount that all consumers, business firms, and government agencies are willing to spend on final goods and services AD is a schedule, not a fixed number: It shows the different quantities of total output demanded at different price levels AD = C Consumer Expenditure + I Investment + G Government Purchases + NX Net Exports
  • 6.
    AD, Domestic Product,and National Income Consumer Expenditure the total amount spent by consumers on newly produced goods and services (excluding purchases of new homes, which are considered investment goods) Investment Spending the sum of the expenditures of business firms on new plant and equipment and households on new homes. Financial “investments” are not included, nor are resales of existing physical assets.
  • 7.
    AD, Domestic Product,and National Income Government Purchases the goods and services purchased by all levels of government. Net Exports the difference between U.S. exports and U.S. imports. Indicates the difference between what we sell to foreigners and what we buy from them
  • 8.
    BUT WAIT!!! Thisis the exact same formula we used to calculate GDP last week! How can these two be the same? 1. Logically: All of the things people are willing to buy must equal all of the things that people make and sell Pictorially
  • 9.
    Today Aggregate Demand,Domestic Product, and National Income The Circular Flow of Spending, Production and Income Consumer Spending and Income: The important Relationship The consumption function and the Marginal Propensity to Consume Factors that Shift the Consumption Function The Extreme Variability of Investment The Determinants of Net Exports How predictable is AD?
  • 10.
    FIGURE 24-1 The Circular Flow of Expenditures and Income 1 3 6 5 4 2 Investors Government Consumers Financial System Saving ( S ) Consumption (C) Investment (I) C + I Government C + I + G Imports ( IM ) Exports ( X ) C + I + G + Transfers Disposable Income ( DI ) Taxes ( X – IM ) Purchases ( G ) Firms (produce the domestic product) Rest of the World Gross National Income ( Y )
  • 11.
    Circular Flow ofSpending, Production, and Income Circular flow diagram: shows the relationship of the different components of expenditure and income National income=domestic product Wages plus rents plus interest plus profits equals output
  • 12.
    AD, Domestic Product,and National Income National Income -the sum of the incomes that all individuals in the economy earned in the forms of wages, interest, rents, and profits. -Excludes government transfer payments -Pre-tax Not all national income goes directly to consumers!
  • 13.
    FIGURE 24-1 The Circular Flow of Expenditures and Income 1 3 6 5 4 2 Investors Government Consumers Financial System Saving ( S ) Consumption (C) Investment (I) C + I Government C + I + G Imports ( IM ) Exports ( X ) C + I + G + Transfers Disposable Income ( DI ) Taxes ( X – IM ) Purchases ( G ) Firms (produce the domestic product) Rest of the World Gross National Income ( Y )
  • 14.
    National Income vs.Disposable Income Not all national income goes directly to consumers Some money is deducted in the form of taxes Some money is added in the form of transfer payments DI = GDP - Taxes + Transfer Payments = GDP – (Taxes – Transfers) = Y - T
  • 15.
    AD, Domestic Product,and National Income Disposable Income the sum of the incomes of all the individuals in the economy after all taxes have been deducted and all transfer payments have been added DI = GDP - Taxes + Transfers = Y - T
  • 16.
    Some Questions ToThink About: Does flow of spending and income grow larger or smaller as we move around the circle? Is the output that firms produce at point 5 (the GDP) equal to aggregate demand? What makes these two quantities equal if so? If not, what will happen?
  • 17.
    Some Questions ToThink About Do the government’s accounts balance so that net of transfers equals government spending? If not, what happens? Is our international trade balanced so that exports equal imports? What happens if we experience a trade surplus or trade deficit?
  • 18.
    Today Aggregate Demand,Domestic Product, and National Income The Circular Flow of Spending, Production and Income Consumer Spending and Income: The important Relationship The consumption function and the Marginal Propensity to Consume Factors that Shift the Consumption Function The Extreme Variability of Investment The Determinants of Net Exports How predictable is AD?
  • 19.
    Consumption Consumption isthe single largest component of GDP, about 66% over the last decade Major components of consumption: Cars Food Medical Care
  • 20.
    100 5,151 TotalConsumption 865 Other 816 Medical Care 205 Transportation 310 Household operation 779 Housing 58 2,974 Services 375 Other 133 Energy 264 Clothing & Apparel 772 Food 30 1,545 Nondurable Goods 125 Other 254 Household Equipment 253 Motor Vehicles 12 632 Durable Goods Percent of total Value of category (1996, $, billion) Category of Consumption
  • 21.
    Evolution of Consumptionin the 20 th Century 1918-US households spent 41% of income on food and drink 1999-19% Spending on apparel has fallen from 18% of income to 6% 1918-Americans spent 1% of income on automobiles Now-23% of spending on vehicle related transportation
  • 22.
    Evolution of Consumptionin the 20 th Century Housing has risen from 14% to 20% of national income during this period Televisions, cell phones, and VCRs have increased entertainment expenses Biggest increase in consumption spending has been for health care
  • 23.
    Consumption, Income, andSaving Consumption, Income, and Saving are all linked Personal saving is the part of disposable income that is not consumed 4.9% Memo: Saving as percent of personal DI 272 Equals: Personal Saving 5,314 Less: Personal outlays (consumption +interest) 5,586 Equals: Personal Disposable Income 864 Less: Personal tax and nontax payments 6,450 Personal Income Amount, 1996 ($, billion) Item
  • 24.
    Consumption, Saving, andIncome 28,360 +1,640 30,000 27,830 +1,170 29,000 27,240 +760 28,000 26,600 +400 27,000 25,850 +150 26,000 25,000 0 25,000 24,110 -110 24,000 (3) Consumption ($) (2) Net saving (+) or dissaving (-) ($) (1) Disposable Income ($)
  • 25.
    FIGURE 24-2 Consumer Spending and Disposable Income Copyright © 2003 South-Western/Thomson Learning. All rights reserved. Real consumer spending Real disposable income Billions of 1996 Dollars 2000 1990 1980 1970 1960 1950 1940 1930 0 500 1,000 1,500 2,000 2,500 3,000 3,500 4,500 4,000 $6,500 6,000 5,500 5,000 World War II The Great Depression
  • 26.
  • 27.
    Consumption, Saving, andIncome Clearly consumption and DI are related When DI rises, consumption rises When DI falls, consumption falls However we are still unclear on how much DI influences consumption
  • 28.
    Today Aggregate Demand,Domestic Product, and National Income The Circular Flow of Spending, Production and Income Consumer Spending and Income: The important Relationship The consumption function and the Marginal Propensity to Consume Factors that Shift the Consumption Function The Extreme Variability of Investment The Determinants of Net Exports How predictable is AD?
  • 29.
    Consumption, Saving, andIncome To understand the way consumption affects national output, we need some new tools. We need to look at how many extra dollars of consumption are induced by each extra dollar of disposable income This relationship is shown by the consumption function
  • 30.
    Consumer Spending andIncome A scatter diagram with U.S. data shows the close relationship between real disposable income and real consumer spending.
  • 31.
    FIGURE 24-3 Consumer Spending and Disposable Income Copyright © 2003 South-Western/Thomson Learning. All rights reserved. $3,244 $5,677 $5,237 $2,869 Real Consumer Spending 0 Real Disposable Income 2001 2000 1999 1998 1997 1995 1976 1996 1994 1992 1990 1991 1989 1988 1987 1986 1985 1980 1984 1979 1978 1974 1970 1964 1960 1955 1945 1943 1942 1947 1941 1939 1929
  • 32.
    Consumer Spending andIncome Assume in 1963 you want to calculate how much an increase in disposable income will increase consumption You could look at a scatter diagram of consumption vs. DI of the years leading up until that year
  • 33.
    FIGURE 24-4 Consumer Spending and Disposable Income Copyright © 2003 South-Western/Thomson Learning. All rights reserved. 1900 1700 1500 1360 1300 1180 1100 900 1900 1700 1500 1300 1100 900 Real Disposable Income Real Consumer Spending 0 B A $200 billion $180 billion 1947 1963
  • 34.
    Consumer Spending andIncome When the data are converted into a consumption function diagram--with income on one axis and consumption on the other--the relationship between real consumer spending and real disposable income is almost linear, with a slope of about 0.9.
  • 35.
    Consumer Spending andIncome If there were a tax cut of $10 billion, effectively increasing DI by that amount, according to the graph how much would you expect consumption to increase by? How much would you expect savings to increase by?
  • 36.
    The Consumption Functionand the MPC Consumption function illustrates the relationship between total consumer expenditures and total disposable income in the economy, holding constant all other determinants of consumer spending. MPC =  consumption   disposable income Can be used to estimate the initial effect on consumer spending of a tax cut
  • 37.
    FIGURE 24-5 A Consumption Function Copyright © 2003 South-Western/Thomson Learning. All rights reserved. 5,200 4,800 4,400 4,000 3,600 3,200 0 2,700 3,000 3,300 3,600 3,900 $4,200 C $400 $300 Real Disposable Income, DI
  • 38.
    TABLE 24-1 Consumption and Income in Hypothetical Economy Copyright © 2003 South-Western/Thomson Learning. All rights reserved.
  • 39.
    A Consumption FunctionFor simplicity, we assume that points of aggregate consumption, when plotted against aggregate income, lie along a straight line. The slope of the consumption function ( b ) is called the marginal propensity to consume (MPC), or the fraction of a change in income that is consumed, or spent.
  • 40.
    A ConsumptionFunction Derived from the Equation C = 100 + .75 Y At a national income of zero, consumption is $100 billion ( a ). For every $100 billion increase in income (  Y ), consumption rises by $75 billion (  C ).
  • 41.
    A Consumption FunctionDerived from the Equation C = 100 + .75 Y 850 1,000 700 800 550 600 400 400 250 200 175 100 160 80 100 0 AGGREGATE CONSUMPTION, C (BILLIONS OF DOLLARS) AGGREGATE INCOME, Y (BILLIONS OF DOLLARS)
  • 42.
    Consumption and SavingSince there are only two places income can go: consumption or saving, the fraction of additional income that is not consumed is the fraction saved. The fraction of a change in income that is saved is called the marginal propensity to save (MPS). Once we know how much consumption will result from a given level of income, we know how much saving there will be. Therefore,
  • 43.
    Marginal Propensity toConsume: Again MPC = Change in Consumption _____________________________________________ Change in DI that produces the change in Consumption
  • 44.
    An Aggregate ConsumptionFunction Derived from the Equation C = 100 + .75 Y 850 1,000 700 800 550 600 400 400 250 200 175 100 160 80 100 0 AGGREGATE CONSUMPTION, C (BILLIONS OF DOLLARS) AGGREGATE INCOME, Y (BILLIONS OF DOLLARS)
  • 45.
    Marginal Propensity toConsume MPC = Change in Consumption _____________________________________________ Change in DI that produces the change in Consumption MPC = $75 _____ $100 = 0.75
  • 46.
    Marginal Propensity toConsume To estimate the initial effect of a tax cut on consumer spending,economists must first estimate the MPC and then multiply the amount of the tax cut by the estimated MPC Because they never know the true MPC with certainty, their prediction is always subject to some margin of error (Baumol, 2004)
  • 47.
    .80 .85 .90.95 1.0 Canada United States Netherlands United Kingdom Germany Italy Japan France GLOBAL PERSPECTIVE Average Propensities to Consume, Selected Nations, 1999 Statistical Abstract of the United States, 2000 .986 .976 .972 .940 .907 .873 .869 .842
  • 48.
    Today Aggregate Demand,Domestic Product, and National Income The Circular Flow of Spending, Production and Income Consumer Spending and Income: The important Relationship The consumption function and the Marginal Propensity to Consume Factors that Shift the Consumption Function The Extreme Variability of Investment The Determinants of Net Exports How predictable is AD?
  • 49.
    Shifts in theconsumption function The consumption function does not always stand still  disposable income  movement along a consumption function  any other variable that affects consumption  shift in the entire consumption function
  • 50.
    FIGURE 24-6 Shifts of the Consumption Function Copyright © 2003 South-Western/Thomson Learning. All rights reserved. Real Consumer Spending Real Disposable Income Shifts of consumption function Movements along consumption function C 2 C 1 C 0 A
  • 51.
    Factors That Shiftthe Consumption Function Consumption function shifted by changes in: Wealth Price level Real interest rate Expectations of future income
  • 52.
    Shifts in theconsumption function: Wealth Not just income, but total amount of income accumulated The more money I have, the more I will be willing to spend E.G. stock market booms and busts
  • 53.
    Shifts in theconsumption function: Price Level Higher prices lower consumption Lower prices raise consumption Higher price levels = lower level of real wealth Lower price levels = higher level of real wealth
  • 54.
    Shifts in theconsumption function: The real interest rate High interest rate => lower consumption Low interest rate => raise consumption Makes sense theoretically, BUT Studies have shown that interest rates have little to no influence on consumption
  • 55.
    Shifts in theconsumption function: future expectations If people think they will make more money in the future, they will be more willing to consume today If people are not optimistic about the future, they will be more likely to save today
  • 56.
    A Return toour Initial Question Why didn’t the tax rebates of 1975 and 2001 result in the intended increase of consumption? Largely due to this concept of expectations of the future Examine three consumers, named “No Change,” “Temporary Rise,” and “Permanent Rise.”
  • 57.
    TABLE 24-2 Incomes of Three Consumers Copyright © 2003 South-Western/Thomson Learning. All rights reserved.
  • 58.
    Why The TaxRebate Failed in 1975 and 2001 The tax cuts failed to stimulate consumption very much because they were perceived as only temporary. People probably figured out that it would not make much difference to their long-term well-being, and therefore did not change their spending habits much. ?
  • 59.
    Today Aggregate Demand,Domestic Product, and National Income The Circular Flow of Spending, Production and Income Consumer Spending and Income: The important Relationship The consumption function and the Marginal Propensity to Consume Factors that Shift the Consumption Function The Extreme Variability of Investment The Determinants of Net Exports How predictable is AD?
  • 60.
    Investment Investment isthe most volatile of all AD components Does not follow movements in disposable income like consumption A 3.2 percent drop in growth rate from 2000-2001 was accompanied by a 14.1 percent drop in the growth rate of investment
  • 61.
    Investment Because investmentis volatile, it can have a major impact on AD, which affects output and employment in the short run Investment also leads to capital accumulation, which also increases potential output and growth in the long run
  • 62.
    Investment Volatility ofinvestment is largely attributed to expectations of the future , which directly affect the state of business confidence Difficult to measure, much less control Thus, economists concentrate on controlling other determinants of investment
  • 63.
    Determinants of InvestmentThe level of investment is determined by: Revenues Costs Expectations
  • 64.
    Revenue as adeterminant of investment Investment depends upon the revenues that will be generated by the state of overall economic activity Investment is thus very cyclical: Business downturn 1979-82, output fell sharply and investment fell by 22 percent
  • 65.
    Costs as adeterminant of investment Capital is a durable good (lasts a long time) Costs included in costs of capital: 1. Price 2. Interest Rate 3. Taxes
  • 66.
    Expectations as adeterminant of investment Investment is a gamble on the future Businesses spend much energy analyzing investments and trying to narrow the uncertainties about their investments If future expectations are positive, businesses will invest more now
  • 67.
    Today Aggregate Demand,Domestic Product, and National Income The Circular Flow of Spending, Production and Income Consumer Spending and Income: The important Relationship The consumption function and the Marginal Propensity to Consume Factors that Shift the Consumption Function The Extreme Variability of Investment The Determinants of Net Exports How predictable is AD?
  • 68.
    Net Exports NetExports are the third leg of AD to be discussed NX are also extremely variable Net Exports are determined by: National Incomes 2. Relative prices and exchange rates
  • 69.
    Year 2000 –US Trade with China By 1-digit SITC commodity In millions of dollars Source: US Census Bureau 1-digit SITC Commodity Exports Imports (0) Food and Live Animals 472.95 1,021.17 (1) Beverages and Tobacco 4.93 32.53 (2) Crude Materials, Inedible, Except Fuels 2,566.50 614.03 (3) Mineral Fuels, Lubricants and Related Materials 59.77 729.76 (4) Animal and Vegetable Oils, Fats and Waxes 20.90 7.48 (5) Chemicals and Related Products, N.E.S. 2,325.37 1,809.46 (6) Manufactured Goods Classified Chiefly by Material 1,271.89 10,286.90 (7) Machinery and Transport Equipment 8,067.82 34,946.75 (8) Miscellaneous Manufactured Articles 1,240.14 49,475.39 (9) Commodities and Transactions, N.E.S. 222.76 1,139.49 Total 16,253.03 100,062.96
  • 70.
    National Income andImports Imports are positively related to income and output When GDP rises, US imports increase because some of the C + G + I come from foreign producers, and America uses foreign made inputs (like oil or steel) When GDP falls, imports fall
  • 71.
    National Income andExports Exports depend on foreign nations levels of output and income As foreign output rises, their demand for national products increases, as some of their C + I + G comes from our own nation Thus, as foreign output and income rises, national exports increase As foreign output and income falls, exports fall
  • 72.
    National Income andNet Exports When our economy grows faster than economies we trade with, net exports shrink When economies we trade with grow faster than our economy, net exports grow US Economy stagnated 1990-1992 => net exports rose from -$55 billion to -$16 billion, US Economy grew faster than other economies net exports fell from -$16 billion to -$380 billion
  • 73.
    Relative Prices andNet Exports Relative prices are also important in determining net exports When comparing relative prices, we are looking at a rise or decline in the price of goods in two different countries If the prices rise in our country and fall in another country, our goods are now more expensive relative to the other country
  • 74.
    Relative Prices andNet Exports A rise in the relative prices of a country’s goods will reduce net exports Foreign countries will be less willing to buy our products, and we will be more willing to buy theirs A drop in the relative prices of a country’s goods will increase net exports We will be less willing to buy foreign country’s products, and they will be more willing to buy ours
  • 75.
    Relative Prices andNet Exports A rise in the relative prices of a foreign country’s goods will increase net exports We will be less willing to buy their products, and they will be more willing to buy ours A drop in the relative prices in a foreign country’s goods will decrease net exports We will be more willing to buy their products, and they will be less willing to buy ours
  • 76.
    Relative Prices andExchange Rates Consider a CharLeenese car that costs 3 million CharLeenese Chars If 1 dollar = 100 Chars , then: 1 car = $30,000 But if the exchange rate changes 1 dollar = 150 Chars , then: 1 car = $20,000
  • 77.
    Today Aggregate Demand,Domestic Product, and National Income The Circular Flow of Spending, Production and Income Consumer Spending and Income: The important Relationship The consumption function and the Marginal Propensity to Consume Factors that Shift the Consumption Function The Extreme Variability of Investment The Determinants of Net Exports How predictable is AD?
  • 78.
    How Predictable isAggregate Demand? AD is not the easiest thing in the world to predict We can use consumer spending to help predict AD, but unexpected movements of the stock market or poor predictions of the future can affect the accurateness of this prediction As the 1975 and 2001 tax rebates showed, it’s also difficult to influence consumption through temporary tax cuts or rebates
  • 79.
    How Predictable isAggregate Demand? Investment is more volatile than consumption, and thus even more difficult to predict This is partly because investment is so strongly related to expectations of the future and confidence, which is next to impossible to calculate, much less control
  • 80.
    How Predictable isAggregate Demand? Net exports are affected both by developments at home, as well as developments abroad. Thus, it’s not easy to predict net exports, as so much of their determination is out of our hands Even government spending is not as predictable as you would think
  • 81.
    To Sum UpAggregate Demand can be viewed as a schedule of different levels of output demanded at different prices levels AD is comprised of consumption, investment, government spending, and net exports
  • 82.
    To Sum UpExamining the circular flow of expenditures and income diagram, we can see that national income and domestic product must, for the most part, be equal Disposable income equals national income minus taxes plus transfers
  • 83.
    To Sum UpThere is clearly a relationship between consumption and disposable income The relationship can be graphically depicted in a scatter diagram, comparing DI to C When we measure the general slope these points make, have calculated the marginal propensity to consume
  • 84.
    To Sum UpMarginal Propensity to Consume shows how much consumption will go up due to an increase in DI The consumption function itself can be shifted up or down due to changes in wealth, price levels, and future income expectations
  • 85.
    To Sum UpBecause both the 1975 and 2001 tax rebates were advertised as “one time only” rebates, people did not see any long term benefit from them. As a result, they did not feel their future incomes were affected, so consumption did not rise as much as expected
  • 86.
    To Sum UpInvestment is comprised mainly of inventory change, purchase of new housing, and purchase of capital by firms Investment is extremely volatile Investment is influenced by revenues, costs, and expectations We generally focus on interest (one of the costs of investment)
  • 87.
    To Sum UpNet exports are determined by national incomes and relative prices NX are determined by both our national incomes, as well as foreign national incomes We have little control over foreign prices as well As a result, NX is not very controllable
  • 88.
    To Sum UpAD is not an easy thing to predict Consumption can be affected by unexpected changes in wealth in the future, or plain poor prediction of future market conditions Investment is highly volatile Net exports are partially determined by other countries Government spending is not as predictable as one would have guessed
  • 89.
    NOW GO AWAY!Next lecture Chapter 8