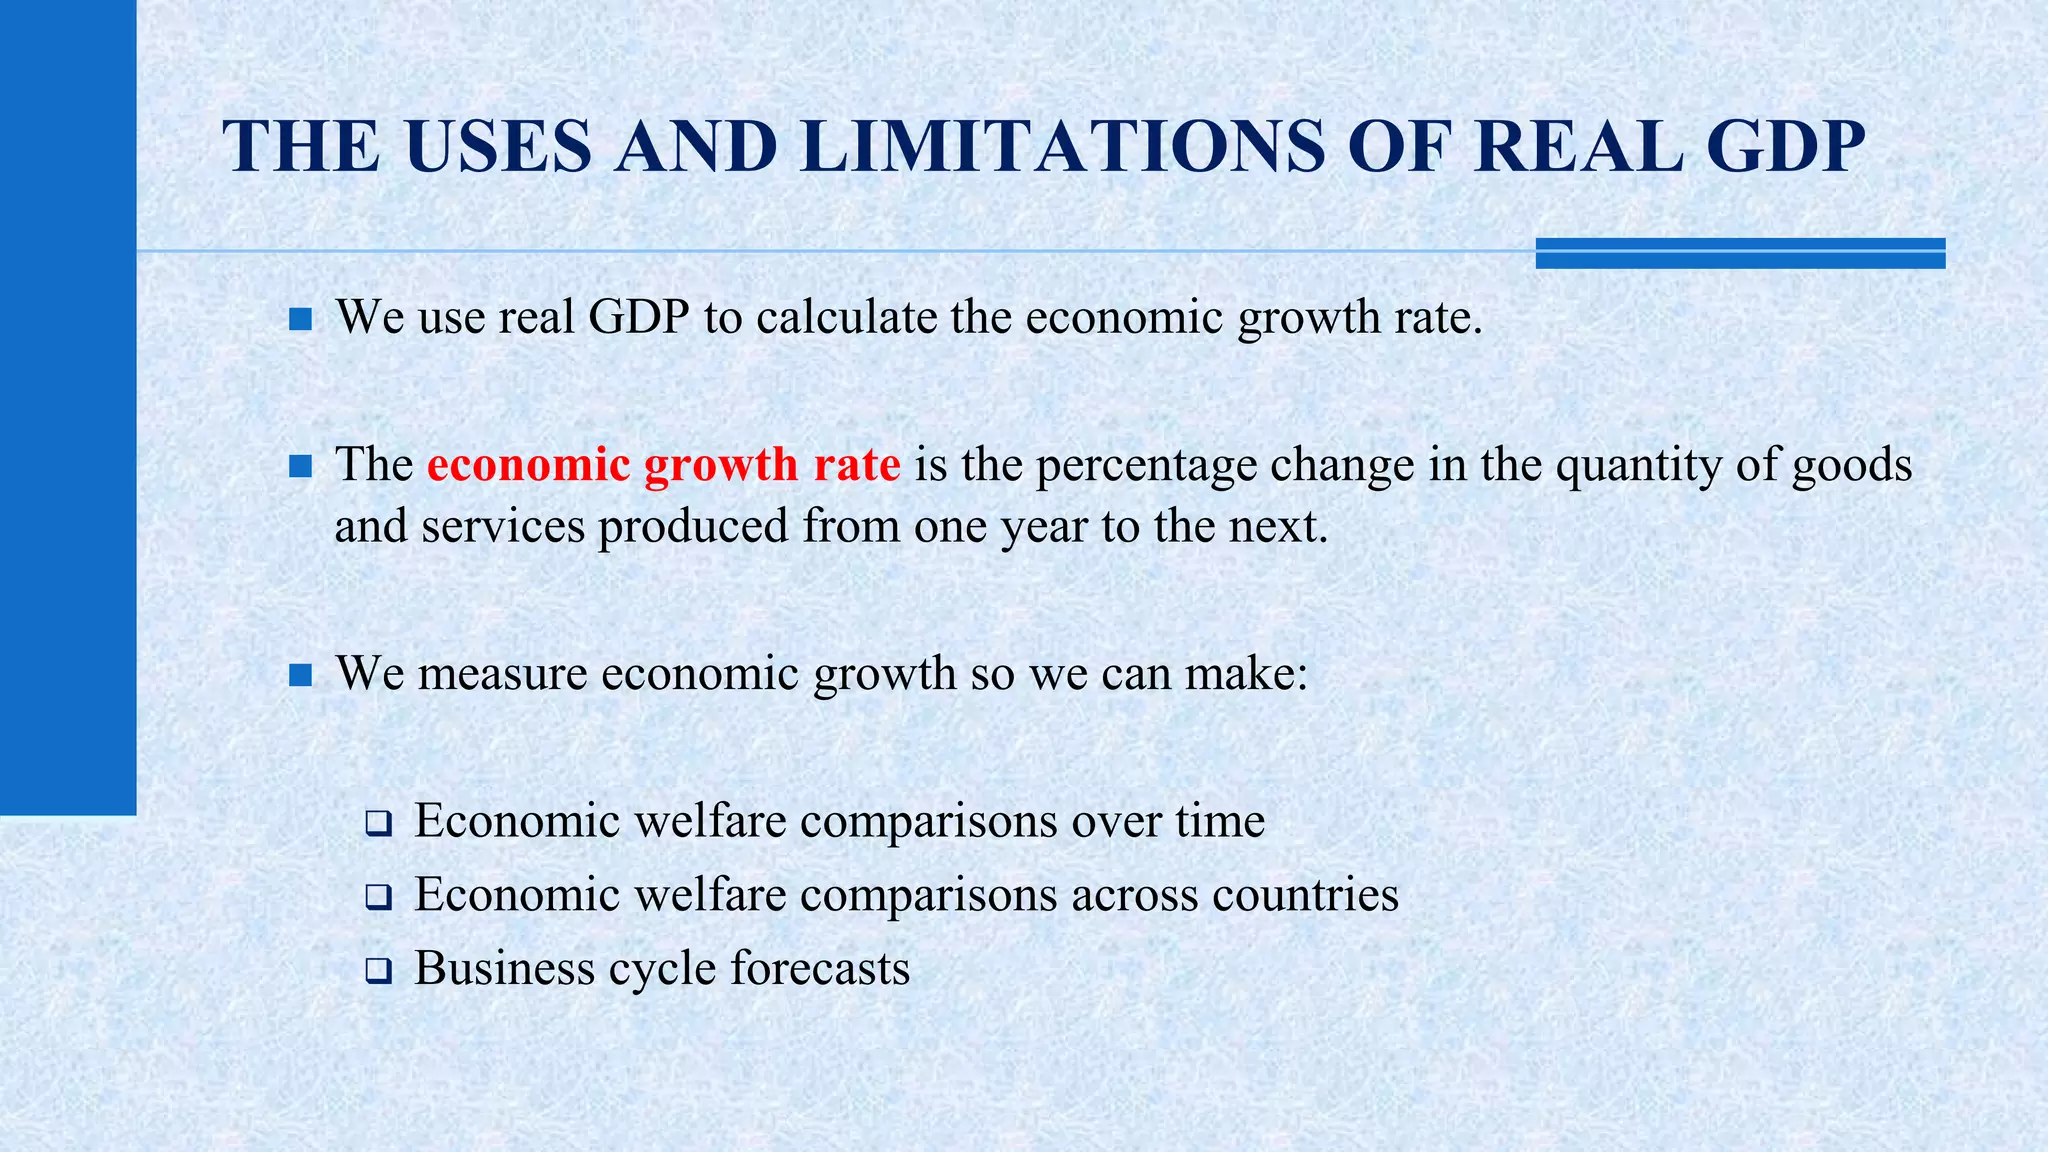
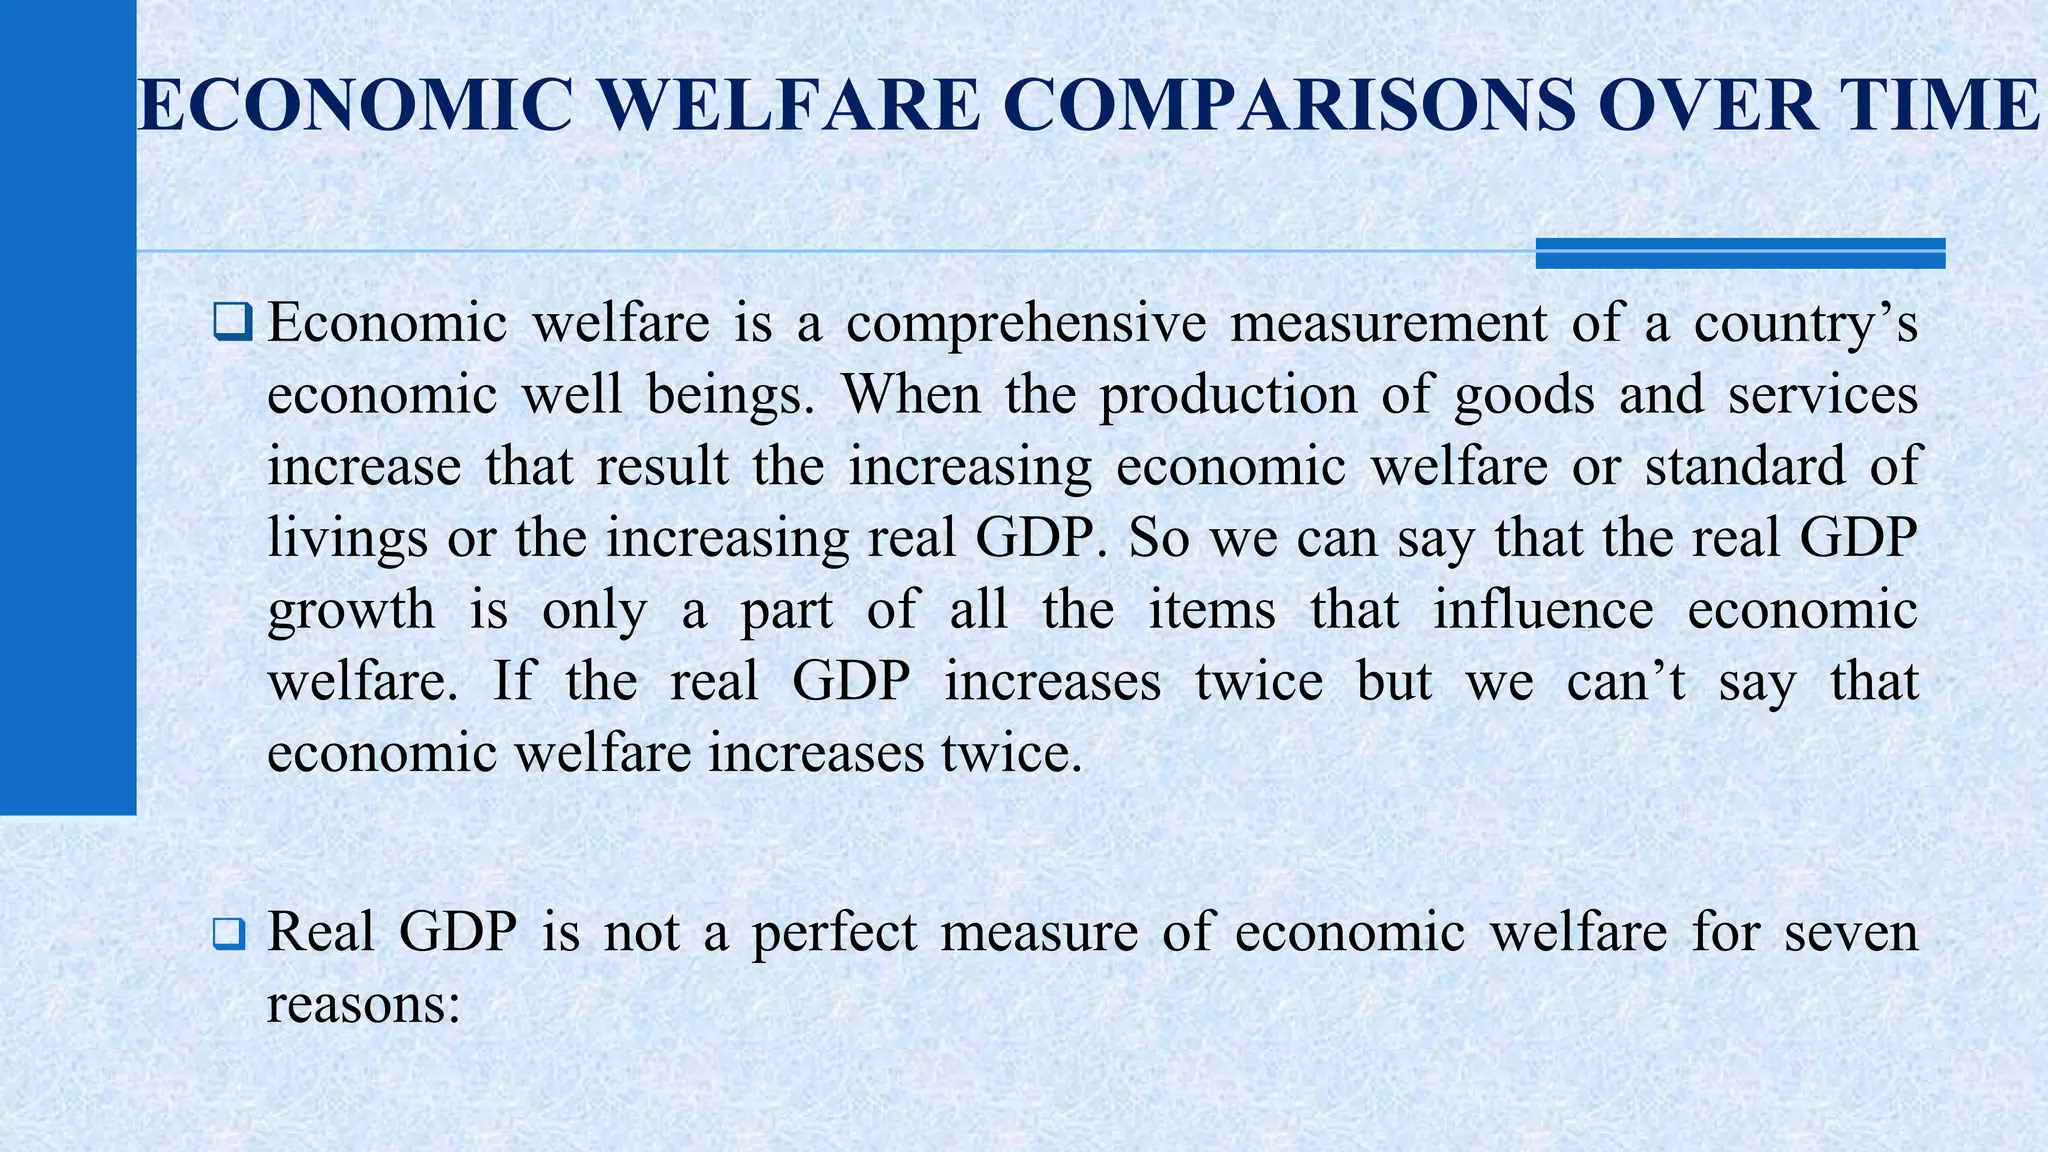
WELCOME 
TO OUR 
PRESENTATION
PRESENTED TO: 
DR. MOHAMMAD BAYEZID ALI 
ASSOCIATE PROFESSOR 
DEPARTMENT OF FINANCE 
JAGANNATH UNIVERSITY, DHAKA. 
PRESENTED BY: 
GROUP-04
GROUP: 4 
SL 
NO. 
ROLL NAME 
1. B-120203032 RAJIB HUSSAIN 
2. B-120203034 ASIBUL ISLAM MILU 
3. B-120203043 TAJRIMA SULTANA SRISTI 
4. B-120203045 MOHAMMADWASHIM 
5. B-120203047 RASELAHAMED 
6. B-120203055 SUJAN BHUIYAN 
7. B-120203071 GAZI RAFSAN SHAHAB 
8. B-120203137 AFRIN KHAN 
9. B-110203091 EHSUN HOQUE
OUR TOPIC 
ON 
THE USES AND LIMITATIONS OF REAL GDP
GAZI RAFSAN SHAHAB 
ID: B-120203071
THE USES AND LIMITATIONS OF REAL GDP 
 We use real GDP to calculate the economic growth rate. 
 The economic growth rate is the percentage change in the quantity of goods 
and services produced from one year to the next. 
 We measure economic growth so we can make: 
 Economic welfare comparisons over time 
 Economic welfare comparisons across countries 
 Business cycle forecasts
ECONOMIC WELFARE COMPARISONS OVER TIME 
 Economic welfare is a comprehensive measurement of a country’s 
economic well beings. When the production of goods and services 
increase that result the increasing economic welfare or standard of 
livings or the increasing real GDP. So we can say that the real GDP 
growth is only a part of all the items that influence economic 
welfare. If the real GDP increases twice but we can’t say that 
economic welfare increases twice. 
 Real GDP is not a perfect measure of economic welfare for seven 
reasons:
ECONOMIC WELFARE COMPARISONS OVER TIME 
1. OVER ADJUSTMENT FOR INFLATION: 
The inflation means the prices of product increase rather than number 
of product. If a company increases its product price that means it has 
increased its product’s quality remaining the production constant. So 
ultimately the real GDP will not change. So we can say that inflation is 
a factor in calculating real GDP.
ECONOMIC WELFARE COMPARISONS OVER TIME 
2. HOUSEHOLD PRODUCTION 
We know that GDP only count the market production not home 
production. But in our country many home production takes place 
every day. If this home production takes the place of market 
production than this production will be counted in real GDP. But 
actually this production is not related in counting real GDP. So there 
will be a problem in counting real GDP.
ECONOMIC WELFARE COMPARISONS OVER TIME 
3. UNDERGROUND ECONOMIC ACTIVITY 
Real GDP, as measured, omits the underground economy, which is 
illegal economic activity or legal economic activity that goes 
unreported for tax avoidance reasons. 
Example as, production and distribution illegal drugs, production that 
uses illegal labor and jobs done for cash to avoid paying income of 
taxes. As these activities are not included in real GDP. So it can’t 
calculate actual real GDP.
ECONOMIC WELFARE COMPARISONS OVER TIME 
4. HEALTH AND LIFE EXPECTANCY 
Health and life expectancy are not directly included in real GDP. But 
we know that where real GDP enables us to spend more money for 
health care. So for that infant death and death in childbirth day by day 
is decreasing. But now-a-days many dangerous diseases like 
CANCER, AIDS are taking young lives that results in decrease real 
GDP. So health and life is a problem in measuring real GDP.
ECONOMIC WELFARE COMPARISONS OVER TIME 
5. LEISURE TIME 
Leisure time, a valuable component of an individual’s welfare, is not 
included in real GDP. Yet from the economic welfare view that leisure 
time must be at least as valuable as the wage we earn last hour worked. 
Over the years , leisure time has steadily increased. The workweek 
become short and vacation days increased. These development in 
economic well-being does not reflected in real GDP.
ECONOMIC WELFARE COMPARISONS OVER TIME 
6. ENVIRONMENT QUALITY 
Environmental damage is not deducted from real GDP. The burning 
of hydrocarbon fuel most notable activity hampers environment. 
Resources that are used to save the nature are valued as part of GDP. 
An industrial society produce more atmospheric pollution than 
agricultural society . But population does not always increase as we 
become wealthier. Wealthy people value a clean environment and 
are willing to pay for one.
ECONOMIC WELFARE COMPARISONS OVER TIME 
7. POLITICAL FREEDOM AND SOCIAL JUSTICE 
Political freedom and social justice are not included in real GDP. A 
country might have a very large real GDP per person but limited 
political freedom and equity. 
For example, a small elite might enjoy political liberty and extreme 
wealth while the vast majority are effectively enslaved and live in 
abject poverty. Such an economy would generally be regarded as 
having less economic welfare than one that had the same amount of 
real GDP but in which political freedom were enjoyed by everyone.
RASEL AHAMED 
ID: B-120203047
ECONOMIC WELFARE COMPARISONS ACROSS 
COUNTRIES 
 Real GDP is used to compare economic welfare in one country with that 
in another. 
 Two problems arise in using real GDP to compare living standards 
across countries: 
1. The real GDP of one country must be converted into the same 
currency units as the real GDP of the other country. 
2. The goods and services in both countries must be valued at the same 
prices.
ECONOMIC WELFARE COMPARISONS ACROSS 
COUNTRIES 
 Using the exchange rate to compare GDP in one country with GDP in 
another country is problematic. 
 Because prices of particular products in one country may be much less 
or much more than in the other country. 
 For example, using the market exchange rate to value Chinese GDP in 
dollars leads to an estimate that in 2008, U.S. real GDP per person was 
19 times Chinese real GDP per person.
ECONOMIC WELFARE COMPARISONS ACROSS 
COUNTRIES 
 Figure 5.4 illustrates the 
problem. 
 Using the market exchange rate 
and domestic prices leads to an 
estimate that China is very poor. 
 Real GDP per person in China is 
5 percent of U.S. real GDP per 
person.
ECONOMIC WELFARE COMPARISONS ACROSS 
COUNTRIES 
 Using purchasing power 
parity prices or PPP prices 
 China’s real GDP per 
person is 12.5 percent of 
U.S. real GDP per person. 
Note: PPP means the expenditure on a similar commodity must be same in both currencies when accounted for exchange rate.
RAJIB HOSSAIN 
ID: B-120203032
BUSINESS CYCLE FORECASTS 
 A business cycle is a periodic but irregular up-and-down movement 
of total production and other measures of economic activity. 
 Every cycle has two phases: 
1. Expansion 
2. Recession 
 and two turning points: 
1. Peak 
2. Trough
BUSINESS CYCLE FORECASTS 
 Figure 4.4 illustrates the 
business cycle. 
 An expansion is a period 
during which real GDP 
increases. 
 Recession is a period 
during which real GDP 
decreases—its growth rate 
is negative—for at least two 
successive quarters.
BUSINESS CYCLE FORECASTS 
 Real GDP is used to measure business cycle fluctuations. 
 These fluctuations are probably accurately timed but the changes 
in real GDP probably overstate the changes in total production 
and people’s welfare caused by business cycles.

The uses and limitations of real gdp

  • 1.
    WELCOME TO OUR PRESENTATION
  • 2.
    PRESENTED TO: DR.MOHAMMAD BAYEZID ALI ASSOCIATE PROFESSOR DEPARTMENT OF FINANCE JAGANNATH UNIVERSITY, DHAKA. PRESENTED BY: GROUP-04
  • 3.
    GROUP: 4 SL NO. ROLL NAME 1. B-120203032 RAJIB HUSSAIN 2. B-120203034 ASIBUL ISLAM MILU 3. B-120203043 TAJRIMA SULTANA SRISTI 4. B-120203045 MOHAMMADWASHIM 5. B-120203047 RASELAHAMED 6. B-120203055 SUJAN BHUIYAN 7. B-120203071 GAZI RAFSAN SHAHAB 8. B-120203137 AFRIN KHAN 9. B-110203091 EHSUN HOQUE
  • 4.
    OUR TOPIC ON THE USES AND LIMITATIONS OF REAL GDP
  • 5.
    GAZI RAFSAN SHAHAB ID: B-120203071
  • 6.
    THE USES ANDLIMITATIONS OF REAL GDP  We use real GDP to calculate the economic growth rate.  The economic growth rate is the percentage change in the quantity of goods and services produced from one year to the next.  We measure economic growth so we can make:  Economic welfare comparisons over time  Economic welfare comparisons across countries  Business cycle forecasts
  • 7.
    ECONOMIC WELFARE COMPARISONSOVER TIME  Economic welfare is a comprehensive measurement of a country’s economic well beings. When the production of goods and services increase that result the increasing economic welfare or standard of livings or the increasing real GDP. So we can say that the real GDP growth is only a part of all the items that influence economic welfare. If the real GDP increases twice but we can’t say that economic welfare increases twice.  Real GDP is not a perfect measure of economic welfare for seven reasons:
  • 8.
    ECONOMIC WELFARE COMPARISONSOVER TIME 1. OVER ADJUSTMENT FOR INFLATION: The inflation means the prices of product increase rather than number of product. If a company increases its product price that means it has increased its product’s quality remaining the production constant. So ultimately the real GDP will not change. So we can say that inflation is a factor in calculating real GDP.
  • 9.
    ECONOMIC WELFARE COMPARISONSOVER TIME 2. HOUSEHOLD PRODUCTION We know that GDP only count the market production not home production. But in our country many home production takes place every day. If this home production takes the place of market production than this production will be counted in real GDP. But actually this production is not related in counting real GDP. So there will be a problem in counting real GDP.
  • 10.
    ECONOMIC WELFARE COMPARISONSOVER TIME 3. UNDERGROUND ECONOMIC ACTIVITY Real GDP, as measured, omits the underground economy, which is illegal economic activity or legal economic activity that goes unreported for tax avoidance reasons. Example as, production and distribution illegal drugs, production that uses illegal labor and jobs done for cash to avoid paying income of taxes. As these activities are not included in real GDP. So it can’t calculate actual real GDP.
  • 11.
    ECONOMIC WELFARE COMPARISONSOVER TIME 4. HEALTH AND LIFE EXPECTANCY Health and life expectancy are not directly included in real GDP. But we know that where real GDP enables us to spend more money for health care. So for that infant death and death in childbirth day by day is decreasing. But now-a-days many dangerous diseases like CANCER, AIDS are taking young lives that results in decrease real GDP. So health and life is a problem in measuring real GDP.
  • 12.
    ECONOMIC WELFARE COMPARISONSOVER TIME 5. LEISURE TIME Leisure time, a valuable component of an individual’s welfare, is not included in real GDP. Yet from the economic welfare view that leisure time must be at least as valuable as the wage we earn last hour worked. Over the years , leisure time has steadily increased. The workweek become short and vacation days increased. These development in economic well-being does not reflected in real GDP.
  • 13.
    ECONOMIC WELFARE COMPARISONSOVER TIME 6. ENVIRONMENT QUALITY Environmental damage is not deducted from real GDP. The burning of hydrocarbon fuel most notable activity hampers environment. Resources that are used to save the nature are valued as part of GDP. An industrial society produce more atmospheric pollution than agricultural society . But population does not always increase as we become wealthier. Wealthy people value a clean environment and are willing to pay for one.
  • 14.
    ECONOMIC WELFARE COMPARISONSOVER TIME 7. POLITICAL FREEDOM AND SOCIAL JUSTICE Political freedom and social justice are not included in real GDP. A country might have a very large real GDP per person but limited political freedom and equity. For example, a small elite might enjoy political liberty and extreme wealth while the vast majority are effectively enslaved and live in abject poverty. Such an economy would generally be regarded as having less economic welfare than one that had the same amount of real GDP but in which political freedom were enjoyed by everyone.
  • 15.
    RASEL AHAMED ID:B-120203047
  • 16.
    ECONOMIC WELFARE COMPARISONSACROSS COUNTRIES  Real GDP is used to compare economic welfare in one country with that in another.  Two problems arise in using real GDP to compare living standards across countries: 1. The real GDP of one country must be converted into the same currency units as the real GDP of the other country. 2. The goods and services in both countries must be valued at the same prices.
  • 17.
    ECONOMIC WELFARE COMPARISONSACROSS COUNTRIES  Using the exchange rate to compare GDP in one country with GDP in another country is problematic.  Because prices of particular products in one country may be much less or much more than in the other country.  For example, using the market exchange rate to value Chinese GDP in dollars leads to an estimate that in 2008, U.S. real GDP per person was 19 times Chinese real GDP per person.
  • 18.
    ECONOMIC WELFARE COMPARISONSACROSS COUNTRIES  Figure 5.4 illustrates the problem.  Using the market exchange rate and domestic prices leads to an estimate that China is very poor.  Real GDP per person in China is 5 percent of U.S. real GDP per person.
  • 19.
    ECONOMIC WELFARE COMPARISONSACROSS COUNTRIES  Using purchasing power parity prices or PPP prices  China’s real GDP per person is 12.5 percent of U.S. real GDP per person. Note: PPP means the expenditure on a similar commodity must be same in both currencies when accounted for exchange rate.
  • 20.
    RAJIB HOSSAIN ID:B-120203032
  • 21.
    BUSINESS CYCLE FORECASTS  A business cycle is a periodic but irregular up-and-down movement of total production and other measures of economic activity.  Every cycle has two phases: 1. Expansion 2. Recession  and two turning points: 1. Peak 2. Trough
  • 22.
    BUSINESS CYCLE FORECASTS  Figure 4.4 illustrates the business cycle.  An expansion is a period during which real GDP increases.  Recession is a period during which real GDP decreases—its growth rate is negative—for at least two successive quarters.
  • 23.
    BUSINESS CYCLE FORECASTS  Real GDP is used to measure business cycle fluctuations.  These fluctuations are probably accurately timed but the changes in real GDP probably overstate the changes in total production and people’s welfare caused by business cycles.