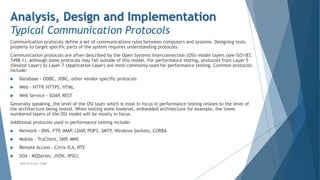
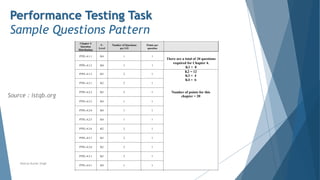
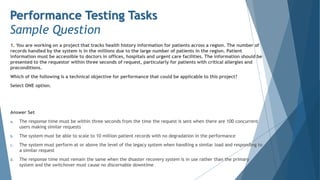
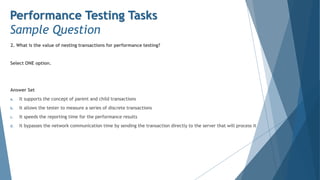
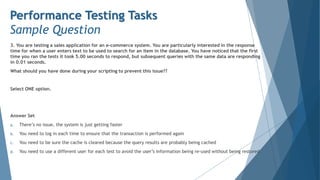
Performance Testing Tasks
1 Basic Concepts
2 Performance
Measurements
3 Performance
Testing in SDLC
Software Testing - ISTQB Specialist
Performance Tester Exam Preparation
Chapter 4
Neeraj Kumar Singh
4 Performance
Testing Tasks
5 Tools
Performance Testing Tasks
Contents
4.1 Planning
4.2 Analysis, Design and Implementation
4.3 Execution
4.4 Analyzing Results and Reporting
Neeraj Kumar Singh
Planning
Deriving Performance Test Objectives
Stakeholders may include users and people with a business or technical background. They may have different
objectives relating to performance testing. Stakeholders set the objectives, the terminology to be used and the
criteria for determining whether the objective has been achieved
Objectives for performance tests relate back to these different types of stakeholders. It is a good practice to
distinguish between user-based and technical objectives. User-based objectives focus primarily on end-user
satisfaction and business goals. Generally, users are less concerned about feature types or how a product gets
delivered. They just want to be able to do what they need to do.
Technical objectives, on the other hand, focus on operational aspects and providing answers to questions regarding
a system’s ability to scale, or under what conditions degraded performance may become apparent.
Key objectives of performance testing include identifying potential risks, finding opportunities for improvement,
and identifying necessary changes.
When gathering information from the various stakeholders, the following questions should be answered:
 What transactions will be executed in the performance test and what average response time is expected?
 What system metrics are to be captured (e.g., memory usage, network throughput) and what values are
expected?
 What performance improvements are expected from these tests compared to previous test cycles?
Neeraj Kumar Singh
Planning
The Performance Test Plan
The Performance Test Plan (PTP) is a document created prior to any performance testing occurring. The PTP should
be referred to by the Test Plan which also includes relevant scheduling information.
It continues to be updated once performance testing begins. The following information should be supplied in a
PTP:
Objective - The PTP objective describes the goals, strategies and methods for the performance test. It enables a
quantifiable answer to the central question of the adequacy and the readiness of the system to perform under
load.
Test Objectives - Overall test objectives for performance efficiency to be achieved by the System Under Test (SUT)
are listed for each type of stakeholder
System Overview - A brief description of the SUT will provide the context for the measurement of the
performance test parameters. The overview should include a high-level description of the functionality being
tested under load.
Types of Performance Testing to be Conducted - The types of performance testing to be conducted are listed (see
Section 1.2) along with a description of the purpose of each type.
Neeraj Kumar Singh
Planning
The Performance Test Plan
Acceptance Criteria - Performance testing is intended to determine the responsiveness, throughput, reliability
and/or scalability of the system under a given workload. In general, response time is a user concern, throughput is
a business concern, and resource utilization is a system concern. Acceptance criteria should be set for all relevant
measures and related back to the following as applicable:
 Overall performance test objectives
 Service Level Agreements (SLAs)
 Baseline values – A baseline is a set of metrics used to compare current and previously achieved performance
measurements. This enables particular performance improvements to be demonstrated and/or the
achievement of test acceptance criteria to be confirmed. It may be necessary to first create the baseline using
sanitized data from a database, where possible.
Test Data - Test data includes a broad range of data that needs to be specified for a performance test. This data
can include the following:
 User account data (e.g., user accounts available for simultaneous log in)
 User input data (e.g., the data a user would enter into the application in order to perform a business process)
 Database (e.g., the pre-populated database that is populated with data for use in testing)
Neeraj Kumar Singh
Planning
The Performance Test Plan
The test data creation process should address the following aspects:
 Data extraction from production data
 Importing data into the SUT
 Creation of new data creation of backups that can be used to restore the data when new cycles of testing are
performed
 Data masking or anonymizing. This practice is used on production data that contains personally identifiable
information, and is mandatory under General Data Protection Regulations (GDPR). However, in performance
testing, data masking adds risk to the performance tests as it may not have the same data characteristics as
seen in real-world use.
Neeraj Kumar Singh
Planning
The Performance Test Plan
System Configuration - The system configuration section of the PTP includes the following technical information:
 A description of the specific system architecture, including servers (e.g., web, database, load balancer)
 Definition of multiple tiers
 Specific details of computing hardware (e.g., CPU cores, RAM, Solid State Disks (SSD), Hard Drive Disks (HDD) )
including versions
 Specific details of software (e.g., applications, operating systems, databases, services used to support the
enterprise) including versions
 External systems that operates with the SUT and their configuration and version (e.g., Ecommerce system with
integration to NetSuite)
 SUT build / version identifier
Test Environment - The test environment is often a separate environment that mimics production, but at a
smaller scale. This section of the PTP should include how the results from the performance testing will be
extrapolated to apply to the larger production environment. With some systems, the production environment
becomes the only viable option for testing, but in this case the specific risks of this type of testing must be
discussed.
Neeraj Kumar Singh
Planning
The Performance Test Plan
Test Tools - This section includes a description of which test tools (and versions) will be used in scripting,
executing and monitoring the performance tests (see Chapter 5). This list normally includes:
 Tool(s) used to simulate user transactions
 Tools to provide load from multiple points within the system architecture (points of presence)
 Tools to monitor system performance, including those described above under system configuration
Profiles - Operational profiles provide a repeatable step-by-step flow through the application for a particular
usage of the system. Aggregating these operational profiles results in a load profile (commonly referred to as a
scenario).
Relevant Metrics - A large number of measurements and metrics can be collected during a performance test
execution (see Chapter 2). However, taking too many measurements can make analysis difficult as well as
negatively impact the application’s actual performance. For these reasons, it is important to identify the
measurements and metrics that are most relevant to accomplish the objectives of the performance test.
Neeraj Kumar Singh
Planning
The Performance Test Plan
The following table, shows a typical set of metrics for performance testing and monitoring. Test objectives for
performance should be defined for these metrics, where required, for the project:
Neeraj Kumar Singh
Type Metric
Virtual User Status # Passed # Failed
Transaction Response
Time
Minimum, Maximum, Average, 90% Percentile
Transaction per Second # Passed / second # Failed / second # Total / second
Hits Hits / second (Minimum, Maximum, Average, Total)
Throughput Bits / second (Minimum, Maximum, Average, Total)
HTTP Responses Per
Second
• Responses / second (Minimum, Maximum, Average, Total)
• Response by HTTP response codes
Performance Metrics
Type Metric
CPU Usage % of available CPU used
Memory Usage % of available memory used
Performance Monitoring
Planning
The Performance Test Plan
Risks
Risks can include areas not measured as part of the performance testing as well as limitations to the performance
testing (e.g., external interfaces that cannot be simulated, insufficient load, inability to monitor servers).
Limitations of the test environment may also produce risks (e.g., insufficient data, scaled down environment).
Neeraj Kumar Singh
Planning
Communicating About Performance Testing
The tester must be capable of communicating to all stakeholders the rationale behind the performance testing approach
and the activities to be undertaken (as detailed in the Performance Test Plan). The subjects to be addressed in this
communication may vary considerably between stakeholders depending on whether they have a “business / user-facing”
interest or a more “technology / operations-facing” focus.
Stakeholders with a Business Focus
The following factors should be considered when communicating with stakeholders with a business focus:
 Stakeholders with a business focus are less interested in the distinctions between functional and non-functional quality
characteristics.
 Technical issues concerning tooling, scripting and load generation are generally of secondary interest.
 The connection between product risks and performance test objectives must be clearly stated.
 Stakeholders must be made aware of the balance between the cost of planned performance tests and how
representative the performance testing results will be, compared to production conditions.
 The repeatability of planned performance tests must be communicated. Will the test be difficult to repeat or can it be
repeated with a minimum of effort?
 Project risks must be communicated. These include constraints and dependencies concerning the setup of the tests,
infrastructure requirements (e.g., hardware, tools, data, bandwidth, test environment, resources) and dependencies
on key staff.
 The high-level activities must be communicated together with a broad plan containing costs, time schedule and
milestones.
Neeraj Kumar Singh
Planning
Communicating About Performance Testing
Stakeholders with a Technology Focus
The following factors must be considered when communicating with stakeholders with a technology focus:
 The planned approach to generating required load profiles must be explained and the expected involvement of
technical stakeholders made clear.
 Detailed steps in the setup and execution of the performance tests must be explained to show the relation of
the testing to the architectural risks.
 Steps required to make performance tests repeatable must be communicated. These may include
organizational aspects (e.g., participation of key staff) as well as technical issues.
 Where test environments are to be shared, the scheduling of performance tests must be communicated to
ensure the test results will not be adversely impacted.
 Mitigations of the potential impact on actual users if performance testing needs to be executed in the
production environment must be communicated and accepted.
 Technical stakeholders must be clear about their tasks and when they are scheduled.
Neeraj Kumar Singh
Performance Testing Tasks
Contents
4.1 Planning
4.2 Analysis, Design and Implementation
4.3 Execution
4.4 Analyzing Results and Reporting
Neeraj Kumar Singh
Performance Testing Tasks
Contents
4.2.1 Typical Communication Protocols
4.2.2 Transactions
4.2.3 Identifying Operational Profiles
4.2.4 Creating Load Profiles
4.2.5 Analyzing Throughput and Concurrency
4.2.6 Basic Structure of a Performance Test Script
4.2.7 Implementing Performance Test Scripts
4.2.8 Preparing for Performance Test Execution
Neeraj Kumar Singh
Analysis, Design and Implementation
Typical Communication Protocols
Communication protocols define a set of communications rules between computers and systems. Designing tests
properly to target specific parts of the system requires understanding protocols.
Communication protocols are often described by the Open Systems Interconnection (OSI) model layers (see ISO/IEC
7498-1), although some protocols may fall outside of this model. For performance testing, protocols from Layer 5
(Session Layer) to Layer 7 (Application Layer) are most commonly used for performance testing. Common protocols
include:
 Database - ODBC, JDBC, other vendor-specific protocols
 Web - HTTP, HTTPS, HTML
 Web Service - SOAP
, REST
Generally speaking, the level of the OSI layer which is most in focus in performance testing relates to the level of
the architecture being tested. When testing some lowlevel, embedded architecture for example, the lower
numbered layers of the OSI model will be mostly in focus.
Additional protocols used in performance testing include:
 Network - DNS, FTP
, IMAP
, LDAP
, POP3, SMTP
, Windows Sockets, CORBA
 Mobile - TruClient, SMP
, MMS
 Remote Access - Citrix ICA, RTE
 SOA - MQSeries, JSON, WSCL
Neeraj Kumar Singh
Performance Testing Tasks
Contents
4.2.1 Typical Communication Protocols
4.2.2 Transactions
4.2.3 Identifying Operational Profiles
4.2.4 Creating Load Profiles
4.2.5 Analyzing Throughput and Concurrency
4.2.6 Basic Structure of a Performance Test Script
4.2.7 Implementing Performance Test Scripts
4.2.8 Preparing for Performance Test Execution
Neeraj Kumar Singh
Analysis, Design and Implementation
Transactions
Transactions describe the set of activities performed by a system from the point of initiation to when one or more
processes (requests, operations, or operational processes) have been completed. The response time of transactions
can be measured for the purpose of evaluating system performance. During a performance test these
measurements are used to identify any components that require correction or optimization.
Simulated transactions can include think time to better reflect the timing of a real user taking an action (e.g.,
pressing the “SEND” button). The transaction response time plus the think time equals the elapsed time for that
transaction.
The transaction response times collected during the performance test show how this measurement changes under
different loads imposed on the system. Analysis may show no degradation under load while other measurements
may show severe degradation. By ramping up load and measuring the underlying transaction times, it is possible to
correlate the cause of degradation with the response times of one or more transactions.
Transactions can also be nested so that individual and aggregate activities can be measured. This can be helpful,
for example, when understanding the performance efficiency of an online ordering system. The tester may want to
measure the discrete steps in the order process (e.g., search for item, add item to cart, pay for item, confirm
order) as well as the order process as a whole. By nesting transactions, both sets of information can be gathered in
one test.
Neeraj Kumar Singh
Performance Testing Tasks
Contents
4.2.1 Typical Communication Protocols
4.2.2 Transactions
4.2.3 Identifying Operational Profiles
4.2.4 Creating Load Profiles
4.2.5 Analyzing Throughput and Concurrency
4.2.6 Basic Structure of a Performance Test Script
4.2.7 Implementing Performance Test Scripts
4.2.8 Preparing for Performance Test Execution
Neeraj Kumar Singh
Analysis, Design and Implementation
Identifying Operational Profiles
Operational profiles specify distinct patterns of interaction with an application such as from users or other system
components. Multiple operational profiles may be specified for a given application. They may be combined to
create a desired load profile for achieving particular performance test objectives (see Section 4.2.4). The
following principal steps for identifying operational profiles are described in this section:
1. Identify the data to be gathered
2. Gather the data using one or more sources
3. Evaluate the data to construct the operational profiles
Identify Data
Where users interact with the system under test the following data is gathered or estimated in order to model
their operational profiles (i.e., how they interact with the system):
 Different types of user personas and their roles (e.g., standard user, registered member, administrator, user
groups with specific privileges).
 Different generic tasks performed by those users/roles (e.g., browsing a web site for information, searching a
web site for a particular product, performing role-specific activities). Note that these tasks are generally best
modeled at a high level of abstraction (e.g., at the level of business processes or major user stories).
 Estimated numbers of users for each role/task per unit of time over a given time period. This information will
also be useful for subsequently building load profiles
Neeraj Kumar Singh
Analysis, Design and Implementation
Identifying Operational Profiles
Gather Data
The data mentioned above can be gathered from a number of different sources:
 Conducting interviews or workshops with stakeholders, such as product owners, sales managers and (potential)
end users. These discussions often reveal the principal operational profiles of users and provide answers to the
fundamental question “Who is this application intended for”.
 Functional specifications and requirements (where available) are a valuable source of information about
intended usage patterns which can also help identify user types and their operational profiles. Where
functional specifications are expressed as user stories, the standard format directly enables types of users to
be identified (i.e., As a , I want so that ). Similarly, UML Use Case diagrams and descriptions identify the
“actor” for the use case.
 Evaluating usage data and metrics gained from similar applications may support identification of user types
and provide some initial indications of the expected numbers of users. Access to automatically monitored data
(e.g., from a web master’s administration tool) is recommended. This will include monitoring logs and data
taken from usage of the current operational system where an update to that system is planned
 Monitoring the behavior of users when performing predefined tasks with the application may give insights into
the types of operational profiles to be modeled for performance testing. Coordinating this task with any
planned usability tests (especially if a usability lab is available) is recommended.
Neeraj Kumar Singh
Analysis, Design and Implementation
Identifying Operational Profiles
Construct Operational Profiles
The following steps are followed for identifying and constructing operational profiles for users:
 A top-down approach is taken. Relatively simple broad operational profiles are initially created and only
broken down further if this is needed to achieve performance test objectives (see Section 4.1.1)
 Particular user profiles may be singled out as relevant for performance testing if they involve tasks which are
executed frequently, require critical (high risk) or frequent transactions between different system
components, or potentially demand large volumes of data to be transferred.
 Operational profiles are reviewed and refined with the principal stakeholders before being used for the
creation of load profiles (see Section 4.2.4).
Neeraj Kumar Singh
Analysis, Design and Implementation
Identifying Operational Profiles
The system under test is not always subjected to loads imposed by the user. Operational profiles may also be
required for performance testing of the following types of system (please note this list is not exhaustive):
Off-line Batch Processing Systems
The focus here lies principally on the throughput of the batch processing system (see Section 4.2.5) and its ability
to complete within a given time period. Operational profiles focus on the types of processing which are demanded
of the batch processes. For example, the operational profiles for a stock trading system (which typically includes
online and batch-based transaction processing) may include those relating to payment transactions, verifying
credentials, and checking compliance of legal conditions for particular types of stock transactions. Each of these
operational profiles would result in different paths being taken through the overall batch process for a stock. The
steps outlined above for identifying the operational profiles of online user-based systems can also be applied in the
batch processing context.
Systems of Systems
Components within a multi-system (which may also be embedded) environment respond to different types of input
from other systems or components. Depending on the nature of the system under test, this may require modeling
of several different operational profiles to effectively represent the types of input provided by those supplier
systems. This may involve detailed analysis (e.g., of buffers and queues) together with the system architects and
based on system and interface specifications.
Neeraj Kumar Singh
Performance Testing Tasks
Contents
4.2.1 Typical Communication Protocols
4.2.2 Transactions
4.2.3 Identifying Operational Profiles
4.2.4 Creating Load Profiles
4.2.5 Analyzing Throughput and Concurrency
4.2.6 Basic Structure of a Performance Test Script
4.2.7 Implementing Performance Test Scripts
4.2.8 Preparing for Performance Test Execution
Neeraj Kumar Singh
Analysis, Design and Implementation
Creating Load Profiles
A load profile specifies the activity which a component or system being tested may experience in production. It
consists of a designated number of instances that will perform the actions of predefined operational profiles over a
specified time period. Where the instances are users, the term “virtual users” is commonly applied.
The principal information required to create a realistic and repeatable load profile is:
 The performance testing objective (e.g., to evaluate system behavior under stress loads)
 Operational profiles which accurately represent individual usage patterns (see Section 4.2.3)
 Known throughput and concurrency issues (see Section 4.2.5)
 The quantity and time distribution with which the operational profiles are to be executed such that the SUT
experiences the desired load. Typical examples are:
 Ramp-ups: Steadily increasing load (e.g., add one virtual user per minute)
 Ramp-downs: Steadily decreasing load
 Steps: Instantaneous changes in load (e.g., add 100 virtual users every five minutes)
 Predefined distributions (e.g., volume mimics daily or seasonal business cycles)
The following example shows the construction of a load profile with the objective of generating stress conditions
(at or above the expected maximum for a system to handle) for the system under test.
Neeraj Kumar Singh
Analysis, Design and Implementation
Creating Load Profiles
Neeraj Kumar Singh
Performance Testing Tasks
Contents
4.2.1 Typical Communication Protocols
4.2.2 Transactions
4.2.3 Identifying Operational Profiles
4.2.4 Creating Load Profiles
4.2.5 Analyzing Throughput and Concurrency
4.2.6 Basic Structure of a Performance Test Script
4.2.7 Implementing Performance Test Scripts
4.2.8 Preparing for Performance Test Execution
Neeraj Kumar Singh
Analysis, Design and Implementation
Analyzing Throughput and Concurrency
It is important to understand different aspects of workload: throughput and concurrency. To model operational and
load profiles properly, both aspects should be taken into consideration.
System Throughput
System throughput is a measure of the number of transactions of a given type that the system processes in a unit
of time. For example, the number of orders per hour or the number of HTTP requests per second. System
throughput should be distinguished from network throughput, which is the amount of data moved over the network
Workload modeling is usually done by considering the number of virtual users (execution threads) and the think
time (delays between user actions). However, system throughput is also defined by processing time, and that time
may increase as load increases.
System throughput = [number of virtual users] / ([processing time] + [think time])
So when the processing time increases, throughput may significantly decrease even if everything else stays the
same.
System throughput is an important aspect when testing batch processing systems. In this case, the throughput is
typically measured according to the number of transactions that can be accomplished within a given time frame
(e.g., a nightly batch processing window).
Neeraj Kumar Singh
Analysis, Design and Implementation
Analyzing Throughput and Concurrency
Concurrency
Concurrency is a measure of the number of simultaneous / parallel threads of execution. For interactive systems,
it may be a number of simultaneous / parallel users. Concurrency is usually modeled in load testing tools by setting
the number of virtual users.
Concurrency is an important measure. It represents the number of parallel sessions, each of which may use its own
resources. Even if throughput is the same, the amount of resources used may differ depending on concurrency.
Typical test setups are closed systems (from the queuing theory point of view), where the number of users in the
system is set (fixed population). If all users are waiting for the system’s response in a closed system, no new users
can arrive. Many public systems are open systems – new users are arriving all the time even if all the current users
are waiting for the system’s response.
Neeraj Kumar Singh
Performance Testing Tasks
Contents
4.2.1 Typical Communication Protocols
4.2.2 Transactions
4.2.3 Identifying Operational Profiles
4.2.4 Creating Load Profiles
4.2.5 Analyzing Throughput and Concurrency
4.2.6 Basic Structure of a Performance
Test Script
4.2.7 Implementing Performance Test Scripts
4.2.8 Preparing for Performance Test Execution
Neeraj Kumar Singh
Analysis, Design and Implementation
Basic Structure of a Performance Test Script
A performance test script should simulate a user or component activity that contributes to the load on the system
under test (which may be the whole system or one of its components). It initiates requests to the server in a
proper order and at a given pace.
The best way to create performance test scripts depends on the load generation approach used (Section 4.1).
 The traditional way is to record communication between the client and the system or component on the
protocol level and then play it back after the script has been parameterized and documented. The
parameterization results in a scalable and maintainable script, but the task of parameterization may be time
consuming.
 Recording at the GUI level typically involves capturing GUI actions of a single client with a test execution tool
and running that script with the load generation tool to represent multiple clients.
 Programming may be done using protocol requests (e.g., HTTP requests), GUI actions, or API calls. In the case
of programming scripts, the exact sequence of requests sent to and received from the real system must be
determined, which may be not trivial.
Neeraj Kumar Singh
Analysis, Design and Implementation
Basic Structure of a Performance Test Script
Overall Structure
Often the script has an initialization section (where everything gets prepared for the main part), main sections
that may be executed multiple times, and a clean-up section (where necessary steps are taken to finish the test
properly).
Data Collection
To collect response times, timers should be added to the script to measure how long a request or a combination of
requests takes. The timed requests should match a meaningful unit of logical work–for example, a business
transaction for adding an item to an order or submitting an order.
It is important to understand what exactly is measured: in the case of protocol-level scripts it is server and
network response time only, while GUI scripts measure end-toend time (although what exactly is measured
depends on the technology used).
Neeraj Kumar Singh
Analysis, Design and Implementation
Basic Structure of a Performance Test Script
Result Verification and Error Handling
An important part of the script is result verification and error handling. Even in the best load testing tools, default
error handling tends to be minimal (such as checking the HTTP request return code), so it is recommended to add
additional checks to verify what the requests actually return. Also if any cleanup is required in case of an error, it
likely will need to be implemented manually. A good practice is to verify that the script is doing what it is supposed
to do using indirect methods–for example, checking the database to verify that the proper information was added.
Scripts may include other logic specifying rules concerning when and how server requests will be made. One
example is setting synchronization points, which is done by specifying that the script should wait for an event at
that point before proceeding. The synchronization points may be used to ensure that a specific action is invoked
concurrently or to coordinate work between several scripts.
Performance testing scripts are software, so creating a performance testing script is a software development
activity. It should include quality assurance and tests to verify that the script works as expected with the whole
range of input data.
Neeraj Kumar Singh
Performance Testing Tasks
Contents
4.2.1 Typical Communication Protocols
4.2.2 Transactions
4.2.3 Identifying Operational Profiles
4.2.4 Creating Load Profiles
4.2.5 Analyzing Throughput and Concurrency
4.2.6 Basic Structure of a Performance Test Script
4.2.7 Implementing Performance Test Scripts
4.2.8 Preparing for Performance Test Execution
Neeraj Kumar Singh
Analysis, Design and Implementation
Implementing Performance Test Scripts
Performance test scripts are implemented based on the PTP and the load profiles. While technical details of
implementation will differ depending on the approach and tool(s) used, the overall process remains the same. A
performance script is created using an Integrated Development Environment (IDE) or script editor, to simulate a
user or component behavior.
As the sequence of requests is determined, the script may be recorded or programmed depending on the approach.
Recording usually ensures that it exactly simulates the real system, while programming relies on knowledge of the
proper request sequence.
If recording on the protocol level is used, an essential step after recording in most cases is replacing all recorded
internal identifiers that define context. These identifiers must be made into variables that can be changed
between runs with appropriate values that are extracted from the request responses.
Running multiple virtual users with the same user name and accessing the same set of data (as usually happens
during playback of a recorded script without any further modification beyond necessary correlation) is an easy way
to get misleading results. The data could be completely cached (copied from disk to memory for faster access) and
results would be much better than in production (where such data may be read from a disk).
There are cases where some data must be parameterized for the test to work more than once–for example, when
an order is created and the order name must be unique. Unless the order’s name is parameterized, the test will
fail as soon as it tries to create an order with an existing (recorded) name.
To match operational profiles, think times should be inserted and/or adjusted (if recorded) to generate a proper
number of requests / throughput
Neeraj Kumar Singh
Performance Testing Tasks
Contents
4.2.1 Typical Communication Protocols
4.2.2 Transactions
4.2.3 Identifying Operational Profiles
4.2.4 Creating Load Profiles
4.2.5 Analyzing Throughput and Concurrency
4.2.6 Basic Structure of a Performance Test Script
4.2.7 Implementing Performance Test Scripts
4.2.8 Preparing for Performance Test Execution
Neeraj Kumar Singh
Analysis, Design and Implementation
Preparing for Performance Test Execution
The main activities for preparing to execute the performance tests include:
 Setting up the system under test
 Deploying the environment
 Setting up the load generation and monitoring tools and making sure that all the necessary information will be
collected
It is important to ensure the test environment is as close to the production environment as possible. If this is not
possible, then there must be a clear understanding of the differences and how the test results will be projected on
the production environment. Ideally, the true production environment and data would be used, but testing in a
scaled-down environment still may help mitigate a number of performance risks.
It is important to remember that performance is a non-linear function of the environment, so the further the
environment is from production standard, the more difficult it becomes to make accurate projections for
production performance. The lack of reliability of the projections and the increased risk level grow as the test
system looks less like production.
If data is generated or altered during the test, it may be necessary to restore the original data before the next test
cycle to ensure that the system is in the proper state.
If some parts of the system or some of the data is unavailable for performance tests for whatever reason, a
workaround should be implemented.
Neeraj Kumar Singh
Analysis, Design and Implementation
Preparing for Performance Test Execution
There are many ways to deploy environments. For example, options may include using any of the following:
 Traditional internal (and external) test labs
 Cloud as an environment using Infrastructure as a Service (IaaS), when some parts of the system or all of the
system is deployed to the cloud
 Cloud as an environment using Software as a Service (SaaS), when vendors provide the load testing service
Depending on the specific goals and the systems to test, one test environment may be preferred over another. For
example,
 To test the effect of a performance improvement (performance optimization), using an isolated lab
environment may be a better option to see even small variations introduced by the change.
 To load test the whole production environment end-to-end to make sure the system will handle the load
without any major issues, testing from the cloud or a service may be more appropriate. (Note that this only
works for SUTs that can be reached from a cloud).
 To minimize costs when performance testing is limited in time, creating a test environment in the cloud may
be a more economical solution.
Neeraj Kumar Singh
Performance Testing Tasks
Contents
4.1 Planning
4.2 Analysis, Design and Implementation
4.3 Execution
4.4 Analyzing Results and Reporting
Neeraj Kumar Singh
Performance Testing Tasks
Execution
Performance test execution involves generation of a load against the SUT according to a load profile (usually
implemented by performance testing scripts invoked according to a given scenario), monitoring all parts of the
environment, and collecting and keeping all results and information related to the test. Usually advanced load
testing tools / harnesses perform these tasks automatically (after, of course, proper configuration).
Performance tests are usually focused on a steady state of the system, i.e., when the system’s behavior is stable.
For example, when all simulated users / threads are initiated and are performing work as designed. When the load
is changing (for example, when new users are added), the system’s behavior is changing and it becomes more
difficult to monitor and analyze test results. The stage of getting to the steady state is often referred to as the
ramp-up, and the stage of finishing the test is often referred to as the ramp-down.
During the ramp-up it is advisable to implement incremental load states to monitor the impact of the steadily
increasing load on the system’s response. This ensures that sufficient time is allocated for the ramp-up and that
the system is able to handle the load. Once the steady state has been reached, it is a good practice to monitor
that both the load and the system’s responses are stable and that random variations (which always exist) are not
substantial.
It is important to specify how failures should be handled to make sure that no system issues are introduced. For
example, it may be important for the user to logout when a failure occurs to ensure that all resources associated
with that user are released.
Neeraj Kumar Singh
Performance Testing Tasks
Execution
If monitoring is built into the load testing tool and it is properly configured, it usually starts at the same time as
the test execution. However, if stand-alone monitoring tools are used, monitoring should be started separately and
the necessary information collected such that subsequent analysis can be carried out together with the test
results.
Test execution is often monitored using the performance test tool’s console and realtime log analysis to check for
issues and errors in both the test and the SUT. This helps to avoid needlessly continuing with running large-scale
tests, which might even impact other systems if things go wrong (e.g., if failure occur, components fail or the
generated loads are too low or high). These tests can be expensive to run and it may be necessary to stop the test
or make some on-the-fly adjustments to the performance test or the system configuration if the test deviates from
the expected behavior.
In some cases when running performance testing in an automated way (for example, as a part of Continuous
Integration, as discussed in Section 3.4) checks must be done automatically, since manual monitoring and
intervention may not be possible. In this case, the test set up should be able to recognize any deviations or
problems and issue an alert (usually while properly completing the test).
This approach is easier to implement for regression performance tests when the system’s behavior is generally
known, but may be more difficult with exploratory performance tests or large-scale expensive performance tests
that may need adjustments to be made dynamically during the test.
Neeraj Kumar Singh
Performance Testing Tasks
Contents
4.1 Planning
4.2 Analysis, Design and Implementation
4.3 Execution
4.4 Analyzing Results and Reporting
Neeraj Kumar Singh
Performance Testing Tasks
Analyzing Results and Reporting
We discussed the various metrics in a performance test plan. Defining these up front determines what must be
measured for each test run. After completion of a test cycle, data should be collected for the defined metrics.
When analyzing the data it is first compared to the performance test objective. Once the behavior is understood,
conclusions can be drawn which provide a meaningful summary report that includes recommended actions. These
actions may include changing physical components (e.g., hardware, routers), changing software (e.g., optimizing
applications and database calls), and altering the network (e.g., load balancing, routing).
The following data is typically analyzed:
 Status of simulated (e.g., virtual) users. This needs to be examined first. It is normally expected that all
simulated users have been able to accomplish the tasks specified in the operational profile. Any interruption to
this activity would mimic what an actual user may experience. This makes it very important to first see that
all user activity is completed since any errors encountered may influence the other performance data.
 Transaction response time. This can be measured in multiple ways, including minimum, maximum, average,
and a percentile (e.g., 90th). The minimum and maximum readings show the extremes of the system
performance. The average performance is not necessarily indicative of anything other than the mathematical
average and can often be skewed by outliers. The 90th percentile is often used as a goal since it represents
the majority of users attaining a specific performance threshold. It is not recommended to require 100%
compliance with the performance objectives as the resources required may be too large and the net effect to
the users will often be minor.
Neeraj Kumar Singh
Performance Testing Tasks
Analyzing Results and Reporting
 Transactions per second. This provides information on how much work was done by the system (system
throughput).
 Transaction failures. This data is used when analyzing transactions per second. Failures indicate the expected
event or process did not complete, or did not execute. Any failures encountered are a cause for concern and
the root cause must be investigated. Failed transactions may also result in invalid transactions per second data
since a failed transaction will take far less time than a completed one.
 Hits (or requests) per second. This provides a sense of the number of hits to a server by the simulated users
during each second of the test.
 Network throughput. This is usually measured in bits by time interval, as in bits per second. This represents
the amount of data the simulated users receive from the server every second.
 HTTP responses. These are measured per second and include possible response codes such as: 200, 302, 304,
404, the latter indicating that a page is not found.
Neeraj Kumar Singh
Performance Testing Tasks
Analyzing Results and Reporting
Techniques used in analyzing data can include:
 Comparing results to stated requirements
 Observing trends in results
 Statistical quality control techniques
 Identifying errors
 Comparing expected and actual results
 Comparing the results to prior test results
 Verifying proper functioning of components (e.g., servers, networks)
Identifying correlation between metrics can help us understand at what point system performance begins to
degrade. For example, what number of transactions per second were processed when the CPU reached 90%
capacity and the system slowed?
Analysis can help identify the root cause of the performance degradation or failure, which in turn will facilitate
correction. Confirmation testing will help determine if the corrective action addressed the root cause.
Neeraj Kumar Singh
Performance Testing Tasks
Analyzing Results and Reporting
Reporting
Analysis results are consolidated and compared against the objectives stated in the performance test plan. These
may be reported in the overall test status report together with other test results, or included in a dedicated report
for performance testing. The level of detail reported should match the needs of the stakeholders. The
recommendations based on these results typically address software release criteria (including target environment)
or required performance improvements.
A typical performance testing report may include:
Executive Summary
This section is completed once all performance testing has been done and all results have been analyzed and
understood. The goal is to present concise and understandable conclusions, findings, and recommendations for
management with the goal of an actionable outcome.
Neeraj Kumar Singh
Performance Testing Tasks
Analyzing Results and Reporting
Test Results
Test results may include some or all of the following information:
 A summary providing an explanation and elaboration of the results.
 Results of a baseline test that serves as “snapshot” of system performance at a given time and forms the basis
of comparison with subsequent tests. The results should include the date/time the test started, the concurrent
user goal, the throughput measured, and key findings. Key findings may include overall error rate measured,
response time and average throughput.
 A high-level diagram showing any architectural components that could (or did) impact test objectives.
 A detailed analysis (tables and charts) of the test results showing response times, transaction rates, error rates
and performance analysis. The analysis also includes a description of what was observed, such as at what point
a stable application became unstable and the source of failures (e.g., web server, database server).
Neeraj Kumar Singh
Performance Testing Tasks
Analyzing Results and Reporting
Test Logs/Information Recorded
A log of each test run should be recorded. The log typically includes the following:
 Date/time of test start
 Test duration
 Scripts used for test (including script mix if multiple scripts are used) and relevant script configuration data
 Test data file(s) used by the test
 Name and location of data/log files created during test
 HW/SW configuration tested (especially any changes between runs)
 Average and peak CPU and RAM utilization on web and database servers
 Notes on achieved performance
 Defects identified
Neeraj Kumar Singh
Performance Testing Tasks
Analyzing Results and Reporting
Recommendations
Recommendations resulting from the tests may include the following:
 Technical changes recommended, such as reconfiguring hardware or software or network infrastructure
 Areas identified for further analysis (e.g., analysis of web server logs to help identify root causes of issues
and/or errors)
 Additional monitoring required of gateways, servers, and networks so that more detailed data can be obtained
for measuring performance characteristics and trends (e.g., degradation)
Neeraj Kumar Singh
Performance Testing Tasks
1 Basic Concepts
2 Performance
Measurements
3 Performance
Testing in SDLC
Software Testing - ISTQB Specialist
Performance Tester Exam Preparation
Chapter 4
Neeraj Kumar Singh
4 Performance
Testing Tasks
5 Tools
Neeraj Kumar Singh
Performance Testing Task
Sample Questions Pattern
Source : istqb.org
1. You are working on a project that tracks health history information for patients across a region. The number of
records handled by the system is in the millions due to the large number of patients in the region. Patient
information must be accessible to doctors in offices, hospitals and urgent care facilities. The information should be
presented to the requestor within three seconds of request, particularly for patients with critical allergies and
preconditions.
Which of the following is a technical objective for performance that could be applicable to this project?
Select ONE option.
Answer Set
a. The response time must be within three seconds from the time the request is sent when there are 100 concurrent
users making similar requests
b. The system must be able to scale to 10 million patient records with no degradation in the performance
c. The system must perform at or above the level of the legacy system when handling a similar load and responding to
a similar request
d. The response time must remain the same when the disaster recovery system is in use rather than the primary
system and the switchover must cause no discernable downtime
Performance Testing Tasks
Sample Question
2. What is the value of nesting transactions for performance testing?
Select ONE option.
Answer Set
a. It supports the concept of parent and child transactions
b. It allows the tester to measure a series of discrete transactions
c. It speeds the reporting time for the performance results
d. It bypasses the network communication time by sending the transaction directly to the server that will process it
Performance Testing Tasks
Sample Question
3. You are testing a sales application for an e-commerce system. You are particularly interested in the response
time for when a user enters text to be used to search for an item in the database. You have noticed that the first
time you ran the tests it took 5.00 seconds to respond, but subsequent queries with the same data are responding
in 0.01 seconds.
What should you have done during your scripting to prevent this issue??
Select ONE option.
Answer Set
a. There’s no issue, the system is just getting faster
b. You need to log in each time to ensure that the transaction is performed again
c. You need to be sure the cache is cleared because the query results are probably being cached
d. You need to use a different user for each test to avoid the user’s information being re-used without being restored
Performance Testing Tasks
Sample Question

Chapter 4 - Performance Testing Tasks

  • 1.
    Performance Testing Tasks 1Basic Concepts 2 Performance Measurements 3 Performance Testing in SDLC Software Testing - ISTQB Specialist Performance Tester Exam Preparation Chapter 4 Neeraj Kumar Singh 4 Performance Testing Tasks 5 Tools
  • 2.
    Performance Testing Tasks Contents 4.1Planning 4.2 Analysis, Design and Implementation 4.3 Execution 4.4 Analyzing Results and Reporting Neeraj Kumar Singh
  • 3.
    Planning Deriving Performance TestObjectives Stakeholders may include users and people with a business or technical background. They may have different objectives relating to performance testing. Stakeholders set the objectives, the terminology to be used and the criteria for determining whether the objective has been achieved Objectives for performance tests relate back to these different types of stakeholders. It is a good practice to distinguish between user-based and technical objectives. User-based objectives focus primarily on end-user satisfaction and business goals. Generally, users are less concerned about feature types or how a product gets delivered. They just want to be able to do what they need to do. Technical objectives, on the other hand, focus on operational aspects and providing answers to questions regarding a system’s ability to scale, or under what conditions degraded performance may become apparent. Key objectives of performance testing include identifying potential risks, finding opportunities for improvement, and identifying necessary changes. When gathering information from the various stakeholders, the following questions should be answered:  What transactions will be executed in the performance test and what average response time is expected?  What system metrics are to be captured (e.g., memory usage, network throughput) and what values are expected?  What performance improvements are expected from these tests compared to previous test cycles? Neeraj Kumar Singh
  • 4.
    Planning The Performance TestPlan The Performance Test Plan (PTP) is a document created prior to any performance testing occurring. The PTP should be referred to by the Test Plan which also includes relevant scheduling information. It continues to be updated once performance testing begins. The following information should be supplied in a PTP: Objective - The PTP objective describes the goals, strategies and methods for the performance test. It enables a quantifiable answer to the central question of the adequacy and the readiness of the system to perform under load. Test Objectives - Overall test objectives for performance efficiency to be achieved by the System Under Test (SUT) are listed for each type of stakeholder System Overview - A brief description of the SUT will provide the context for the measurement of the performance test parameters. The overview should include a high-level description of the functionality being tested under load. Types of Performance Testing to be Conducted - The types of performance testing to be conducted are listed (see Section 1.2) along with a description of the purpose of each type. Neeraj Kumar Singh
  • 5.
    Planning The Performance TestPlan Acceptance Criteria - Performance testing is intended to determine the responsiveness, throughput, reliability and/or scalability of the system under a given workload. In general, response time is a user concern, throughput is a business concern, and resource utilization is a system concern. Acceptance criteria should be set for all relevant measures and related back to the following as applicable:  Overall performance test objectives  Service Level Agreements (SLAs)  Baseline values – A baseline is a set of metrics used to compare current and previously achieved performance measurements. This enables particular performance improvements to be demonstrated and/or the achievement of test acceptance criteria to be confirmed. It may be necessary to first create the baseline using sanitized data from a database, where possible. Test Data - Test data includes a broad range of data that needs to be specified for a performance test. This data can include the following:  User account data (e.g., user accounts available for simultaneous log in)  User input data (e.g., the data a user would enter into the application in order to perform a business process)  Database (e.g., the pre-populated database that is populated with data for use in testing) Neeraj Kumar Singh
  • 6.
    Planning The Performance TestPlan The test data creation process should address the following aspects:  Data extraction from production data  Importing data into the SUT  Creation of new data creation of backups that can be used to restore the data when new cycles of testing are performed  Data masking or anonymizing. This practice is used on production data that contains personally identifiable information, and is mandatory under General Data Protection Regulations (GDPR). However, in performance testing, data masking adds risk to the performance tests as it may not have the same data characteristics as seen in real-world use. Neeraj Kumar Singh
  • 7.
    Planning The Performance TestPlan System Configuration - The system configuration section of the PTP includes the following technical information:  A description of the specific system architecture, including servers (e.g., web, database, load balancer)  Definition of multiple tiers  Specific details of computing hardware (e.g., CPU cores, RAM, Solid State Disks (SSD), Hard Drive Disks (HDD) ) including versions  Specific details of software (e.g., applications, operating systems, databases, services used to support the enterprise) including versions  External systems that operates with the SUT and their configuration and version (e.g., Ecommerce system with integration to NetSuite)  SUT build / version identifier Test Environment - The test environment is often a separate environment that mimics production, but at a smaller scale. This section of the PTP should include how the results from the performance testing will be extrapolated to apply to the larger production environment. With some systems, the production environment becomes the only viable option for testing, but in this case the specific risks of this type of testing must be discussed. Neeraj Kumar Singh
  • 8.
    Planning The Performance TestPlan Test Tools - This section includes a description of which test tools (and versions) will be used in scripting, executing and monitoring the performance tests (see Chapter 5). This list normally includes:  Tool(s) used to simulate user transactions  Tools to provide load from multiple points within the system architecture (points of presence)  Tools to monitor system performance, including those described above under system configuration Profiles - Operational profiles provide a repeatable step-by-step flow through the application for a particular usage of the system. Aggregating these operational profiles results in a load profile (commonly referred to as a scenario). Relevant Metrics - A large number of measurements and metrics can be collected during a performance test execution (see Chapter 2). However, taking too many measurements can make analysis difficult as well as negatively impact the application’s actual performance. For these reasons, it is important to identify the measurements and metrics that are most relevant to accomplish the objectives of the performance test. Neeraj Kumar Singh
  • 9.
    Planning The Performance TestPlan The following table, shows a typical set of metrics for performance testing and monitoring. Test objectives for performance should be defined for these metrics, where required, for the project: Neeraj Kumar Singh Type Metric Virtual User Status # Passed # Failed Transaction Response Time Minimum, Maximum, Average, 90% Percentile Transaction per Second # Passed / second # Failed / second # Total / second Hits Hits / second (Minimum, Maximum, Average, Total) Throughput Bits / second (Minimum, Maximum, Average, Total) HTTP Responses Per Second • Responses / second (Minimum, Maximum, Average, Total) • Response by HTTP response codes Performance Metrics Type Metric CPU Usage % of available CPU used Memory Usage % of available memory used Performance Monitoring
  • 10.
    Planning The Performance TestPlan Risks Risks can include areas not measured as part of the performance testing as well as limitations to the performance testing (e.g., external interfaces that cannot be simulated, insufficient load, inability to monitor servers). Limitations of the test environment may also produce risks (e.g., insufficient data, scaled down environment). Neeraj Kumar Singh
  • 11.
    Planning Communicating About PerformanceTesting The tester must be capable of communicating to all stakeholders the rationale behind the performance testing approach and the activities to be undertaken (as detailed in the Performance Test Plan). The subjects to be addressed in this communication may vary considerably between stakeholders depending on whether they have a “business / user-facing” interest or a more “technology / operations-facing” focus. Stakeholders with a Business Focus The following factors should be considered when communicating with stakeholders with a business focus:  Stakeholders with a business focus are less interested in the distinctions between functional and non-functional quality characteristics.  Technical issues concerning tooling, scripting and load generation are generally of secondary interest.  The connection between product risks and performance test objectives must be clearly stated.  Stakeholders must be made aware of the balance between the cost of planned performance tests and how representative the performance testing results will be, compared to production conditions.  The repeatability of planned performance tests must be communicated. Will the test be difficult to repeat or can it be repeated with a minimum of effort?  Project risks must be communicated. These include constraints and dependencies concerning the setup of the tests, infrastructure requirements (e.g., hardware, tools, data, bandwidth, test environment, resources) and dependencies on key staff.  The high-level activities must be communicated together with a broad plan containing costs, time schedule and milestones. Neeraj Kumar Singh
  • 12.
    Planning Communicating About PerformanceTesting Stakeholders with a Technology Focus The following factors must be considered when communicating with stakeholders with a technology focus:  The planned approach to generating required load profiles must be explained and the expected involvement of technical stakeholders made clear.  Detailed steps in the setup and execution of the performance tests must be explained to show the relation of the testing to the architectural risks.  Steps required to make performance tests repeatable must be communicated. These may include organizational aspects (e.g., participation of key staff) as well as technical issues.  Where test environments are to be shared, the scheduling of performance tests must be communicated to ensure the test results will not be adversely impacted.  Mitigations of the potential impact on actual users if performance testing needs to be executed in the production environment must be communicated and accepted.  Technical stakeholders must be clear about their tasks and when they are scheduled. Neeraj Kumar Singh
  • 13.
    Performance Testing Tasks Contents 4.1Planning 4.2 Analysis, Design and Implementation 4.3 Execution 4.4 Analyzing Results and Reporting Neeraj Kumar Singh
  • 14.
    Performance Testing Tasks Contents 4.2.1Typical Communication Protocols 4.2.2 Transactions 4.2.3 Identifying Operational Profiles 4.2.4 Creating Load Profiles 4.2.5 Analyzing Throughput and Concurrency 4.2.6 Basic Structure of a Performance Test Script 4.2.7 Implementing Performance Test Scripts 4.2.8 Preparing for Performance Test Execution Neeraj Kumar Singh
  • 15.
    Analysis, Design andImplementation Typical Communication Protocols Communication protocols define a set of communications rules between computers and systems. Designing tests properly to target specific parts of the system requires understanding protocols. Communication protocols are often described by the Open Systems Interconnection (OSI) model layers (see ISO/IEC 7498-1), although some protocols may fall outside of this model. For performance testing, protocols from Layer 5 (Session Layer) to Layer 7 (Application Layer) are most commonly used for performance testing. Common protocols include:  Database - ODBC, JDBC, other vendor-specific protocols  Web - HTTP, HTTPS, HTML  Web Service - SOAP , REST Generally speaking, the level of the OSI layer which is most in focus in performance testing relates to the level of the architecture being tested. When testing some lowlevel, embedded architecture for example, the lower numbered layers of the OSI model will be mostly in focus. Additional protocols used in performance testing include:  Network - DNS, FTP , IMAP , LDAP , POP3, SMTP , Windows Sockets, CORBA  Mobile - TruClient, SMP , MMS  Remote Access - Citrix ICA, RTE  SOA - MQSeries, JSON, WSCL Neeraj Kumar Singh
  • 16.
    Performance Testing Tasks Contents 4.2.1Typical Communication Protocols 4.2.2 Transactions 4.2.3 Identifying Operational Profiles 4.2.4 Creating Load Profiles 4.2.5 Analyzing Throughput and Concurrency 4.2.6 Basic Structure of a Performance Test Script 4.2.7 Implementing Performance Test Scripts 4.2.8 Preparing for Performance Test Execution Neeraj Kumar Singh
  • 17.
    Analysis, Design andImplementation Transactions Transactions describe the set of activities performed by a system from the point of initiation to when one or more processes (requests, operations, or operational processes) have been completed. The response time of transactions can be measured for the purpose of evaluating system performance. During a performance test these measurements are used to identify any components that require correction or optimization. Simulated transactions can include think time to better reflect the timing of a real user taking an action (e.g., pressing the “SEND” button). The transaction response time plus the think time equals the elapsed time for that transaction. The transaction response times collected during the performance test show how this measurement changes under different loads imposed on the system. Analysis may show no degradation under load while other measurements may show severe degradation. By ramping up load and measuring the underlying transaction times, it is possible to correlate the cause of degradation with the response times of one or more transactions. Transactions can also be nested so that individual and aggregate activities can be measured. This can be helpful, for example, when understanding the performance efficiency of an online ordering system. The tester may want to measure the discrete steps in the order process (e.g., search for item, add item to cart, pay for item, confirm order) as well as the order process as a whole. By nesting transactions, both sets of information can be gathered in one test. Neeraj Kumar Singh
  • 18.
    Performance Testing Tasks Contents 4.2.1Typical Communication Protocols 4.2.2 Transactions 4.2.3 Identifying Operational Profiles 4.2.4 Creating Load Profiles 4.2.5 Analyzing Throughput and Concurrency 4.2.6 Basic Structure of a Performance Test Script 4.2.7 Implementing Performance Test Scripts 4.2.8 Preparing for Performance Test Execution Neeraj Kumar Singh
  • 19.
    Analysis, Design andImplementation Identifying Operational Profiles Operational profiles specify distinct patterns of interaction with an application such as from users or other system components. Multiple operational profiles may be specified for a given application. They may be combined to create a desired load profile for achieving particular performance test objectives (see Section 4.2.4). The following principal steps for identifying operational profiles are described in this section: 1. Identify the data to be gathered 2. Gather the data using one or more sources 3. Evaluate the data to construct the operational profiles Identify Data Where users interact with the system under test the following data is gathered or estimated in order to model their operational profiles (i.e., how they interact with the system):  Different types of user personas and their roles (e.g., standard user, registered member, administrator, user groups with specific privileges).  Different generic tasks performed by those users/roles (e.g., browsing a web site for information, searching a web site for a particular product, performing role-specific activities). Note that these tasks are generally best modeled at a high level of abstraction (e.g., at the level of business processes or major user stories).  Estimated numbers of users for each role/task per unit of time over a given time period. This information will also be useful for subsequently building load profiles Neeraj Kumar Singh
  • 20.
    Analysis, Design andImplementation Identifying Operational Profiles Gather Data The data mentioned above can be gathered from a number of different sources:  Conducting interviews or workshops with stakeholders, such as product owners, sales managers and (potential) end users. These discussions often reveal the principal operational profiles of users and provide answers to the fundamental question “Who is this application intended for”.  Functional specifications and requirements (where available) are a valuable source of information about intended usage patterns which can also help identify user types and their operational profiles. Where functional specifications are expressed as user stories, the standard format directly enables types of users to be identified (i.e., As a , I want so that ). Similarly, UML Use Case diagrams and descriptions identify the “actor” for the use case.  Evaluating usage data and metrics gained from similar applications may support identification of user types and provide some initial indications of the expected numbers of users. Access to automatically monitored data (e.g., from a web master’s administration tool) is recommended. This will include monitoring logs and data taken from usage of the current operational system where an update to that system is planned  Monitoring the behavior of users when performing predefined tasks with the application may give insights into the types of operational profiles to be modeled for performance testing. Coordinating this task with any planned usability tests (especially if a usability lab is available) is recommended. Neeraj Kumar Singh
  • 21.
    Analysis, Design andImplementation Identifying Operational Profiles Construct Operational Profiles The following steps are followed for identifying and constructing operational profiles for users:  A top-down approach is taken. Relatively simple broad operational profiles are initially created and only broken down further if this is needed to achieve performance test objectives (see Section 4.1.1)  Particular user profiles may be singled out as relevant for performance testing if they involve tasks which are executed frequently, require critical (high risk) or frequent transactions between different system components, or potentially demand large volumes of data to be transferred.  Operational profiles are reviewed and refined with the principal stakeholders before being used for the creation of load profiles (see Section 4.2.4). Neeraj Kumar Singh
  • 22.
    Analysis, Design andImplementation Identifying Operational Profiles The system under test is not always subjected to loads imposed by the user. Operational profiles may also be required for performance testing of the following types of system (please note this list is not exhaustive): Off-line Batch Processing Systems The focus here lies principally on the throughput of the batch processing system (see Section 4.2.5) and its ability to complete within a given time period. Operational profiles focus on the types of processing which are demanded of the batch processes. For example, the operational profiles for a stock trading system (which typically includes online and batch-based transaction processing) may include those relating to payment transactions, verifying credentials, and checking compliance of legal conditions for particular types of stock transactions. Each of these operational profiles would result in different paths being taken through the overall batch process for a stock. The steps outlined above for identifying the operational profiles of online user-based systems can also be applied in the batch processing context. Systems of Systems Components within a multi-system (which may also be embedded) environment respond to different types of input from other systems or components. Depending on the nature of the system under test, this may require modeling of several different operational profiles to effectively represent the types of input provided by those supplier systems. This may involve detailed analysis (e.g., of buffers and queues) together with the system architects and based on system and interface specifications. Neeraj Kumar Singh
  • 23.
    Performance Testing Tasks Contents 4.2.1Typical Communication Protocols 4.2.2 Transactions 4.2.3 Identifying Operational Profiles 4.2.4 Creating Load Profiles 4.2.5 Analyzing Throughput and Concurrency 4.2.6 Basic Structure of a Performance Test Script 4.2.7 Implementing Performance Test Scripts 4.2.8 Preparing for Performance Test Execution Neeraj Kumar Singh
  • 24.
    Analysis, Design andImplementation Creating Load Profiles A load profile specifies the activity which a component or system being tested may experience in production. It consists of a designated number of instances that will perform the actions of predefined operational profiles over a specified time period. Where the instances are users, the term “virtual users” is commonly applied. The principal information required to create a realistic and repeatable load profile is:  The performance testing objective (e.g., to evaluate system behavior under stress loads)  Operational profiles which accurately represent individual usage patterns (see Section 4.2.3)  Known throughput and concurrency issues (see Section 4.2.5)  The quantity and time distribution with which the operational profiles are to be executed such that the SUT experiences the desired load. Typical examples are:  Ramp-ups: Steadily increasing load (e.g., add one virtual user per minute)  Ramp-downs: Steadily decreasing load  Steps: Instantaneous changes in load (e.g., add 100 virtual users every five minutes)  Predefined distributions (e.g., volume mimics daily or seasonal business cycles) The following example shows the construction of a load profile with the objective of generating stress conditions (at or above the expected maximum for a system to handle) for the system under test. Neeraj Kumar Singh
  • 25.
    Analysis, Design andImplementation Creating Load Profiles Neeraj Kumar Singh
  • 26.
    Performance Testing Tasks Contents 4.2.1Typical Communication Protocols 4.2.2 Transactions 4.2.3 Identifying Operational Profiles 4.2.4 Creating Load Profiles 4.2.5 Analyzing Throughput and Concurrency 4.2.6 Basic Structure of a Performance Test Script 4.2.7 Implementing Performance Test Scripts 4.2.8 Preparing for Performance Test Execution Neeraj Kumar Singh
  • 27.
    Analysis, Design andImplementation Analyzing Throughput and Concurrency It is important to understand different aspects of workload: throughput and concurrency. To model operational and load profiles properly, both aspects should be taken into consideration. System Throughput System throughput is a measure of the number of transactions of a given type that the system processes in a unit of time. For example, the number of orders per hour or the number of HTTP requests per second. System throughput should be distinguished from network throughput, which is the amount of data moved over the network Workload modeling is usually done by considering the number of virtual users (execution threads) and the think time (delays between user actions). However, system throughput is also defined by processing time, and that time may increase as load increases. System throughput = [number of virtual users] / ([processing time] + [think time]) So when the processing time increases, throughput may significantly decrease even if everything else stays the same. System throughput is an important aspect when testing batch processing systems. In this case, the throughput is typically measured according to the number of transactions that can be accomplished within a given time frame (e.g., a nightly batch processing window). Neeraj Kumar Singh
  • 28.
    Analysis, Design andImplementation Analyzing Throughput and Concurrency Concurrency Concurrency is a measure of the number of simultaneous / parallel threads of execution. For interactive systems, it may be a number of simultaneous / parallel users. Concurrency is usually modeled in load testing tools by setting the number of virtual users. Concurrency is an important measure. It represents the number of parallel sessions, each of which may use its own resources. Even if throughput is the same, the amount of resources used may differ depending on concurrency. Typical test setups are closed systems (from the queuing theory point of view), where the number of users in the system is set (fixed population). If all users are waiting for the system’s response in a closed system, no new users can arrive. Many public systems are open systems – new users are arriving all the time even if all the current users are waiting for the system’s response. Neeraj Kumar Singh
  • 29.
    Performance Testing Tasks Contents 4.2.1Typical Communication Protocols 4.2.2 Transactions 4.2.3 Identifying Operational Profiles 4.2.4 Creating Load Profiles 4.2.5 Analyzing Throughput and Concurrency 4.2.6 Basic Structure of a Performance Test Script 4.2.7 Implementing Performance Test Scripts 4.2.8 Preparing for Performance Test Execution Neeraj Kumar Singh
  • 30.
    Analysis, Design andImplementation Basic Structure of a Performance Test Script A performance test script should simulate a user or component activity that contributes to the load on the system under test (which may be the whole system or one of its components). It initiates requests to the server in a proper order and at a given pace. The best way to create performance test scripts depends on the load generation approach used (Section 4.1).  The traditional way is to record communication between the client and the system or component on the protocol level and then play it back after the script has been parameterized and documented. The parameterization results in a scalable and maintainable script, but the task of parameterization may be time consuming.  Recording at the GUI level typically involves capturing GUI actions of a single client with a test execution tool and running that script with the load generation tool to represent multiple clients.  Programming may be done using protocol requests (e.g., HTTP requests), GUI actions, or API calls. In the case of programming scripts, the exact sequence of requests sent to and received from the real system must be determined, which may be not trivial. Neeraj Kumar Singh
  • 31.
    Analysis, Design andImplementation Basic Structure of a Performance Test Script Overall Structure Often the script has an initialization section (where everything gets prepared for the main part), main sections that may be executed multiple times, and a clean-up section (where necessary steps are taken to finish the test properly). Data Collection To collect response times, timers should be added to the script to measure how long a request or a combination of requests takes. The timed requests should match a meaningful unit of logical work–for example, a business transaction for adding an item to an order or submitting an order. It is important to understand what exactly is measured: in the case of protocol-level scripts it is server and network response time only, while GUI scripts measure end-toend time (although what exactly is measured depends on the technology used). Neeraj Kumar Singh
  • 32.
    Analysis, Design andImplementation Basic Structure of a Performance Test Script Result Verification and Error Handling An important part of the script is result verification and error handling. Even in the best load testing tools, default error handling tends to be minimal (such as checking the HTTP request return code), so it is recommended to add additional checks to verify what the requests actually return. Also if any cleanup is required in case of an error, it likely will need to be implemented manually. A good practice is to verify that the script is doing what it is supposed to do using indirect methods–for example, checking the database to verify that the proper information was added. Scripts may include other logic specifying rules concerning when and how server requests will be made. One example is setting synchronization points, which is done by specifying that the script should wait for an event at that point before proceeding. The synchronization points may be used to ensure that a specific action is invoked concurrently or to coordinate work between several scripts. Performance testing scripts are software, so creating a performance testing script is a software development activity. It should include quality assurance and tests to verify that the script works as expected with the whole range of input data. Neeraj Kumar Singh
  • 33.
    Performance Testing Tasks Contents 4.2.1Typical Communication Protocols 4.2.2 Transactions 4.2.3 Identifying Operational Profiles 4.2.4 Creating Load Profiles 4.2.5 Analyzing Throughput and Concurrency 4.2.6 Basic Structure of a Performance Test Script 4.2.7 Implementing Performance Test Scripts 4.2.8 Preparing for Performance Test Execution Neeraj Kumar Singh
  • 34.
    Analysis, Design andImplementation Implementing Performance Test Scripts Performance test scripts are implemented based on the PTP and the load profiles. While technical details of implementation will differ depending on the approach and tool(s) used, the overall process remains the same. A performance script is created using an Integrated Development Environment (IDE) or script editor, to simulate a user or component behavior. As the sequence of requests is determined, the script may be recorded or programmed depending on the approach. Recording usually ensures that it exactly simulates the real system, while programming relies on knowledge of the proper request sequence. If recording on the protocol level is used, an essential step after recording in most cases is replacing all recorded internal identifiers that define context. These identifiers must be made into variables that can be changed between runs with appropriate values that are extracted from the request responses. Running multiple virtual users with the same user name and accessing the same set of data (as usually happens during playback of a recorded script without any further modification beyond necessary correlation) is an easy way to get misleading results. The data could be completely cached (copied from disk to memory for faster access) and results would be much better than in production (where such data may be read from a disk). There are cases where some data must be parameterized for the test to work more than once–for example, when an order is created and the order name must be unique. Unless the order’s name is parameterized, the test will fail as soon as it tries to create an order with an existing (recorded) name. To match operational profiles, think times should be inserted and/or adjusted (if recorded) to generate a proper number of requests / throughput Neeraj Kumar Singh
  • 35.
    Performance Testing Tasks Contents 4.2.1Typical Communication Protocols 4.2.2 Transactions 4.2.3 Identifying Operational Profiles 4.2.4 Creating Load Profiles 4.2.5 Analyzing Throughput and Concurrency 4.2.6 Basic Structure of a Performance Test Script 4.2.7 Implementing Performance Test Scripts 4.2.8 Preparing for Performance Test Execution Neeraj Kumar Singh
  • 36.
    Analysis, Design andImplementation Preparing for Performance Test Execution The main activities for preparing to execute the performance tests include:  Setting up the system under test  Deploying the environment  Setting up the load generation and monitoring tools and making sure that all the necessary information will be collected It is important to ensure the test environment is as close to the production environment as possible. If this is not possible, then there must be a clear understanding of the differences and how the test results will be projected on the production environment. Ideally, the true production environment and data would be used, but testing in a scaled-down environment still may help mitigate a number of performance risks. It is important to remember that performance is a non-linear function of the environment, so the further the environment is from production standard, the more difficult it becomes to make accurate projections for production performance. The lack of reliability of the projections and the increased risk level grow as the test system looks less like production. If data is generated or altered during the test, it may be necessary to restore the original data before the next test cycle to ensure that the system is in the proper state. If some parts of the system or some of the data is unavailable for performance tests for whatever reason, a workaround should be implemented. Neeraj Kumar Singh
  • 37.
    Analysis, Design andImplementation Preparing for Performance Test Execution There are many ways to deploy environments. For example, options may include using any of the following:  Traditional internal (and external) test labs  Cloud as an environment using Infrastructure as a Service (IaaS), when some parts of the system or all of the system is deployed to the cloud  Cloud as an environment using Software as a Service (SaaS), when vendors provide the load testing service Depending on the specific goals and the systems to test, one test environment may be preferred over another. For example,  To test the effect of a performance improvement (performance optimization), using an isolated lab environment may be a better option to see even small variations introduced by the change.  To load test the whole production environment end-to-end to make sure the system will handle the load without any major issues, testing from the cloud or a service may be more appropriate. (Note that this only works for SUTs that can be reached from a cloud).  To minimize costs when performance testing is limited in time, creating a test environment in the cloud may be a more economical solution. Neeraj Kumar Singh
  • 38.
    Performance Testing Tasks Contents 4.1Planning 4.2 Analysis, Design and Implementation 4.3 Execution 4.4 Analyzing Results and Reporting Neeraj Kumar Singh
  • 39.
    Performance Testing Tasks Execution Performancetest execution involves generation of a load against the SUT according to a load profile (usually implemented by performance testing scripts invoked according to a given scenario), monitoring all parts of the environment, and collecting and keeping all results and information related to the test. Usually advanced load testing tools / harnesses perform these tasks automatically (after, of course, proper configuration). Performance tests are usually focused on a steady state of the system, i.e., when the system’s behavior is stable. For example, when all simulated users / threads are initiated and are performing work as designed. When the load is changing (for example, when new users are added), the system’s behavior is changing and it becomes more difficult to monitor and analyze test results. The stage of getting to the steady state is often referred to as the ramp-up, and the stage of finishing the test is often referred to as the ramp-down. During the ramp-up it is advisable to implement incremental load states to monitor the impact of the steadily increasing load on the system’s response. This ensures that sufficient time is allocated for the ramp-up and that the system is able to handle the load. Once the steady state has been reached, it is a good practice to monitor that both the load and the system’s responses are stable and that random variations (which always exist) are not substantial. It is important to specify how failures should be handled to make sure that no system issues are introduced. For example, it may be important for the user to logout when a failure occurs to ensure that all resources associated with that user are released. Neeraj Kumar Singh
  • 40.
    Performance Testing Tasks Execution Ifmonitoring is built into the load testing tool and it is properly configured, it usually starts at the same time as the test execution. However, if stand-alone monitoring tools are used, monitoring should be started separately and the necessary information collected such that subsequent analysis can be carried out together with the test results. Test execution is often monitored using the performance test tool’s console and realtime log analysis to check for issues and errors in both the test and the SUT. This helps to avoid needlessly continuing with running large-scale tests, which might even impact other systems if things go wrong (e.g., if failure occur, components fail or the generated loads are too low or high). These tests can be expensive to run and it may be necessary to stop the test or make some on-the-fly adjustments to the performance test or the system configuration if the test deviates from the expected behavior. In some cases when running performance testing in an automated way (for example, as a part of Continuous Integration, as discussed in Section 3.4) checks must be done automatically, since manual monitoring and intervention may not be possible. In this case, the test set up should be able to recognize any deviations or problems and issue an alert (usually while properly completing the test). This approach is easier to implement for regression performance tests when the system’s behavior is generally known, but may be more difficult with exploratory performance tests or large-scale expensive performance tests that may need adjustments to be made dynamically during the test. Neeraj Kumar Singh
  • 41.
    Performance Testing Tasks Contents 4.1Planning 4.2 Analysis, Design and Implementation 4.3 Execution 4.4 Analyzing Results and Reporting Neeraj Kumar Singh
  • 42.
    Performance Testing Tasks AnalyzingResults and Reporting We discussed the various metrics in a performance test plan. Defining these up front determines what must be measured for each test run. After completion of a test cycle, data should be collected for the defined metrics. When analyzing the data it is first compared to the performance test objective. Once the behavior is understood, conclusions can be drawn which provide a meaningful summary report that includes recommended actions. These actions may include changing physical components (e.g., hardware, routers), changing software (e.g., optimizing applications and database calls), and altering the network (e.g., load balancing, routing). The following data is typically analyzed:  Status of simulated (e.g., virtual) users. This needs to be examined first. It is normally expected that all simulated users have been able to accomplish the tasks specified in the operational profile. Any interruption to this activity would mimic what an actual user may experience. This makes it very important to first see that all user activity is completed since any errors encountered may influence the other performance data.  Transaction response time. This can be measured in multiple ways, including minimum, maximum, average, and a percentile (e.g., 90th). The minimum and maximum readings show the extremes of the system performance. The average performance is not necessarily indicative of anything other than the mathematical average and can often be skewed by outliers. The 90th percentile is often used as a goal since it represents the majority of users attaining a specific performance threshold. It is not recommended to require 100% compliance with the performance objectives as the resources required may be too large and the net effect to the users will often be minor. Neeraj Kumar Singh
  • 43.
    Performance Testing Tasks AnalyzingResults and Reporting  Transactions per second. This provides information on how much work was done by the system (system throughput).  Transaction failures. This data is used when analyzing transactions per second. Failures indicate the expected event or process did not complete, or did not execute. Any failures encountered are a cause for concern and the root cause must be investigated. Failed transactions may also result in invalid transactions per second data since a failed transaction will take far less time than a completed one.  Hits (or requests) per second. This provides a sense of the number of hits to a server by the simulated users during each second of the test.  Network throughput. This is usually measured in bits by time interval, as in bits per second. This represents the amount of data the simulated users receive from the server every second.  HTTP responses. These are measured per second and include possible response codes such as: 200, 302, 304, 404, the latter indicating that a page is not found. Neeraj Kumar Singh
  • 44.
    Performance Testing Tasks AnalyzingResults and Reporting Techniques used in analyzing data can include:  Comparing results to stated requirements  Observing trends in results  Statistical quality control techniques  Identifying errors  Comparing expected and actual results  Comparing the results to prior test results  Verifying proper functioning of components (e.g., servers, networks) Identifying correlation between metrics can help us understand at what point system performance begins to degrade. For example, what number of transactions per second were processed when the CPU reached 90% capacity and the system slowed? Analysis can help identify the root cause of the performance degradation or failure, which in turn will facilitate correction. Confirmation testing will help determine if the corrective action addressed the root cause. Neeraj Kumar Singh
  • 45.
    Performance Testing Tasks AnalyzingResults and Reporting Reporting Analysis results are consolidated and compared against the objectives stated in the performance test plan. These may be reported in the overall test status report together with other test results, or included in a dedicated report for performance testing. The level of detail reported should match the needs of the stakeholders. The recommendations based on these results typically address software release criteria (including target environment) or required performance improvements. A typical performance testing report may include: Executive Summary This section is completed once all performance testing has been done and all results have been analyzed and understood. The goal is to present concise and understandable conclusions, findings, and recommendations for management with the goal of an actionable outcome. Neeraj Kumar Singh
  • 46.
    Performance Testing Tasks AnalyzingResults and Reporting Test Results Test results may include some or all of the following information:  A summary providing an explanation and elaboration of the results.  Results of a baseline test that serves as “snapshot” of system performance at a given time and forms the basis of comparison with subsequent tests. The results should include the date/time the test started, the concurrent user goal, the throughput measured, and key findings. Key findings may include overall error rate measured, response time and average throughput.  A high-level diagram showing any architectural components that could (or did) impact test objectives.  A detailed analysis (tables and charts) of the test results showing response times, transaction rates, error rates and performance analysis. The analysis also includes a description of what was observed, such as at what point a stable application became unstable and the source of failures (e.g., web server, database server). Neeraj Kumar Singh
  • 47.
    Performance Testing Tasks AnalyzingResults and Reporting Test Logs/Information Recorded A log of each test run should be recorded. The log typically includes the following:  Date/time of test start  Test duration  Scripts used for test (including script mix if multiple scripts are used) and relevant script configuration data  Test data file(s) used by the test  Name and location of data/log files created during test  HW/SW configuration tested (especially any changes between runs)  Average and peak CPU and RAM utilization on web and database servers  Notes on achieved performance  Defects identified Neeraj Kumar Singh
  • 48.
    Performance Testing Tasks AnalyzingResults and Reporting Recommendations Recommendations resulting from the tests may include the following:  Technical changes recommended, such as reconfiguring hardware or software or network infrastructure  Areas identified for further analysis (e.g., analysis of web server logs to help identify root causes of issues and/or errors)  Additional monitoring required of gateways, servers, and networks so that more detailed data can be obtained for measuring performance characteristics and trends (e.g., degradation) Neeraj Kumar Singh
  • 49.
    Performance Testing Tasks 1Basic Concepts 2 Performance Measurements 3 Performance Testing in SDLC Software Testing - ISTQB Specialist Performance Tester Exam Preparation Chapter 4 Neeraj Kumar Singh 4 Performance Testing Tasks 5 Tools
  • 50.
    Neeraj Kumar Singh PerformanceTesting Task Sample Questions Pattern Source : istqb.org
  • 51.
    1. You areworking on a project that tracks health history information for patients across a region. The number of records handled by the system is in the millions due to the large number of patients in the region. Patient information must be accessible to doctors in offices, hospitals and urgent care facilities. The information should be presented to the requestor within three seconds of request, particularly for patients with critical allergies and preconditions. Which of the following is a technical objective for performance that could be applicable to this project? Select ONE option. Answer Set a. The response time must be within three seconds from the time the request is sent when there are 100 concurrent users making similar requests b. The system must be able to scale to 10 million patient records with no degradation in the performance c. The system must perform at or above the level of the legacy system when handling a similar load and responding to a similar request d. The response time must remain the same when the disaster recovery system is in use rather than the primary system and the switchover must cause no discernable downtime Performance Testing Tasks Sample Question
  • 52.
    2. What isthe value of nesting transactions for performance testing? Select ONE option. Answer Set a. It supports the concept of parent and child transactions b. It allows the tester to measure a series of discrete transactions c. It speeds the reporting time for the performance results d. It bypasses the network communication time by sending the transaction directly to the server that will process it Performance Testing Tasks Sample Question
  • 53.
    3. You aretesting a sales application for an e-commerce system. You are particularly interested in the response time for when a user enters text to be used to search for an item in the database. You have noticed that the first time you ran the tests it took 5.00 seconds to respond, but subsequent queries with the same data are responding in 0.01 seconds. What should you have done during your scripting to prevent this issue?? Select ONE option. Answer Set a. There’s no issue, the system is just getting faster b. You need to log in each time to ensure that the transaction is performed again c. You need to be sure the cache is cleared because the query results are probably being cached d. You need to use a different user for each test to avoid the user’s information being re-used without being restored Performance Testing Tasks Sample Question