![Response time
Response time is a measure of how responsive an
application or subsystem is to a client request.
It represents how long a user must wait for a
request to be processed by an application. Slow
response time equals an unhappy user experience,
and may also result in the loss of revenue.
It is measured in seconds [or msec in some cases].](https://image.slidesharecdn.com/performancetestingbasics-130910095617-phpapp02/85/Performance-testing-basics-18-320.jpg)


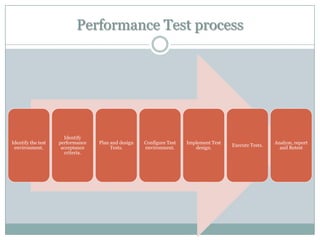
This document discusses performance testing, which determines how a system responds under different workloads. It defines key terms like response time and throughput. The performance testing process is outlined as identifying the test environment and criteria, planning tests, implementing the test design, executing tests, and analyzing results. Common metrics that are monitored include response time, throughput, CPU utilization, memory usage, network usage, and disk usage. Performance testing helps evaluate systems, identify bottlenecks, and ensure performance meets criteria before production.