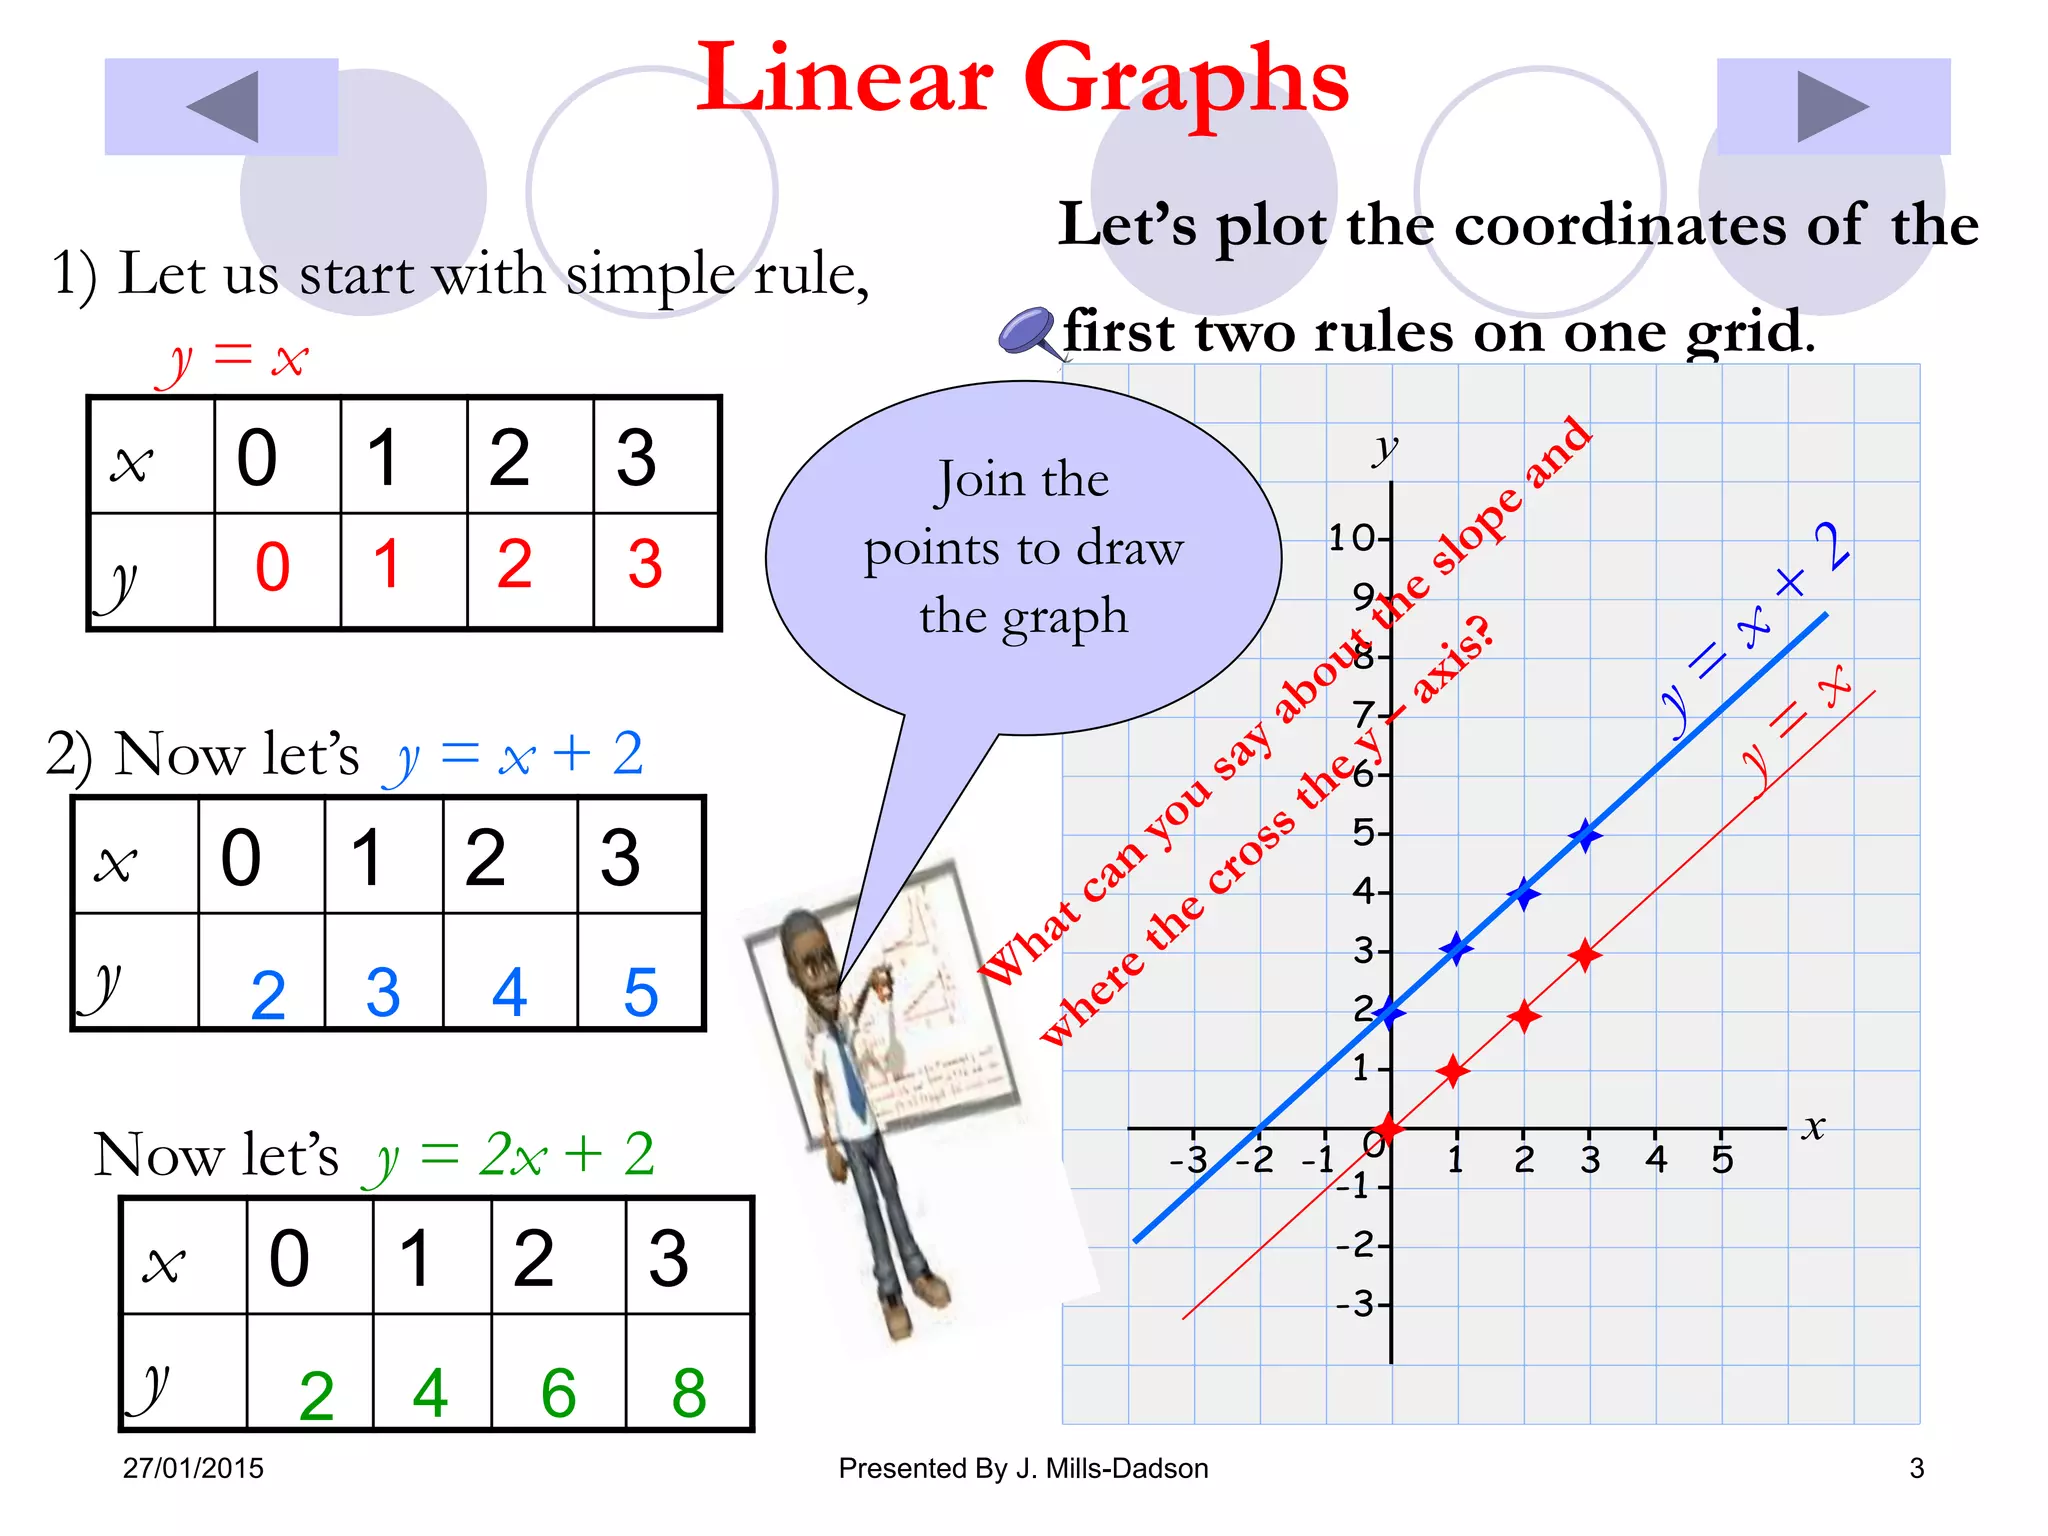
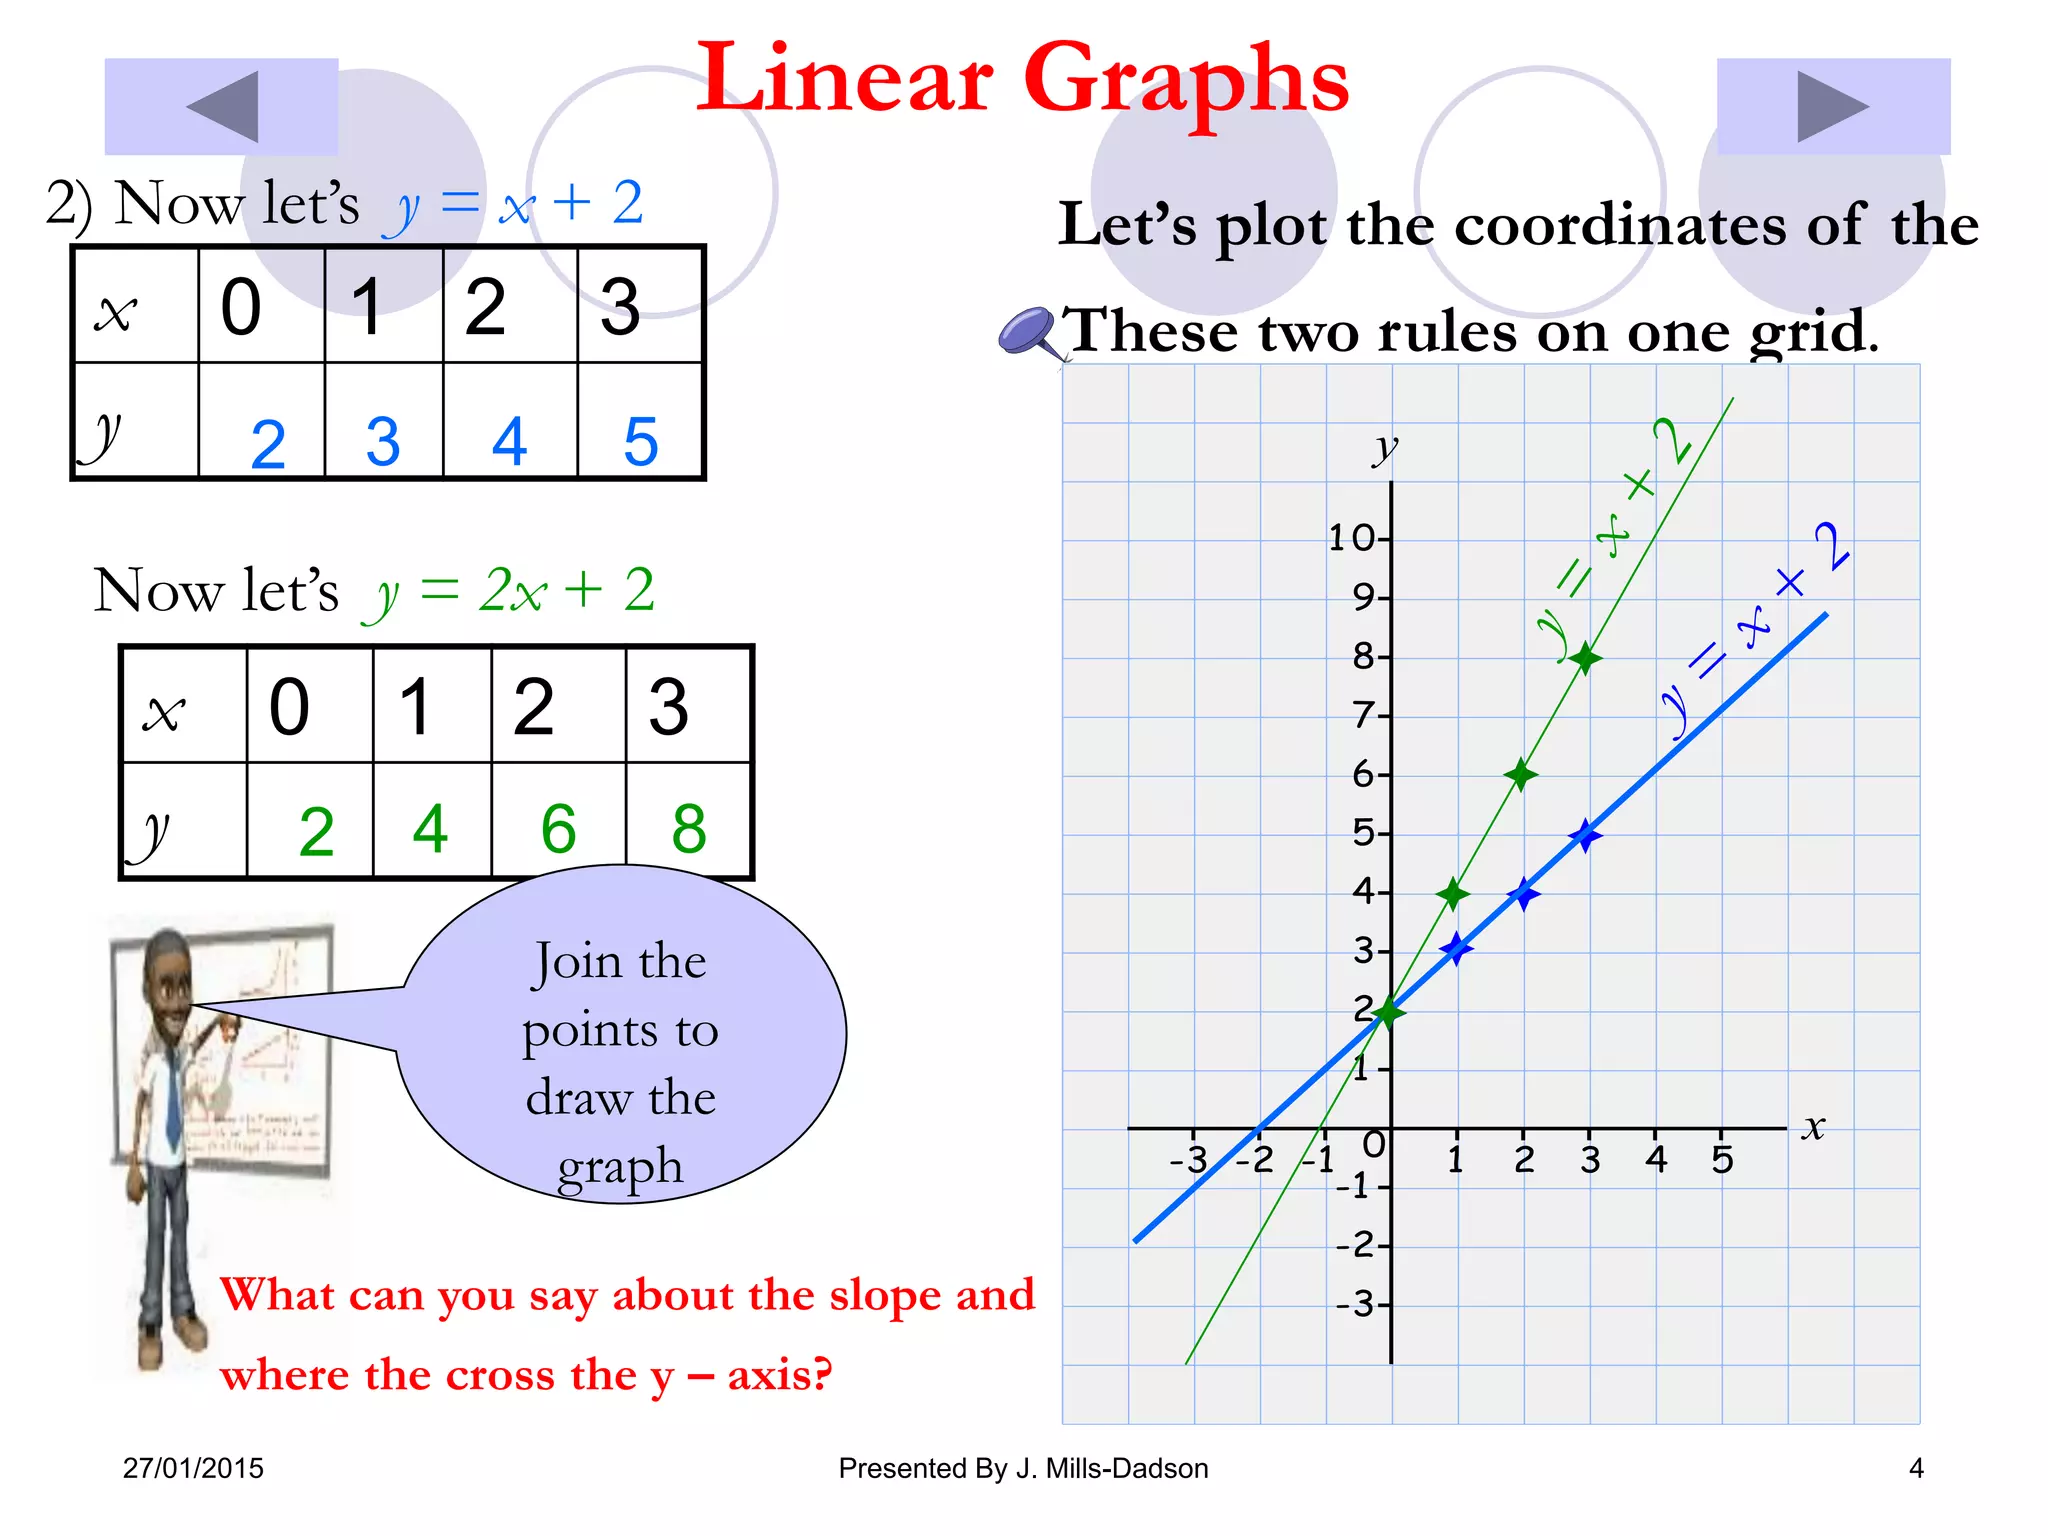
27/01/2015 Presented By J. Mills-Dadson 1
Linear Graphs
Objectives: by the end of the lesson, students
should be able to:
generate coordinate pairs that satisfy a simple linear rule
plot the graphs given explicitly in terms of x.
Success Criteria: students should be able to
generate coordinate pairs from E.g.: y = 2x
 Keywords: substitute, intercept, gradient, origin,
parallel
27/01/2015 Presented By J. Mills-Dadson 2
Linear Graphs
Linear graphs are straight lines
The rule connecting x and y coordinates is of the
form y = mx + c
‘m’ is the gradient : how flat or how steep the
graph should be
‘c’ is the intercept: where the graph crosses the
y-axis
The meeting points of the x - axis and y – axis is
called the origin
27/01/2015 Presented By J. Mills-Dadson 3
Linear Graphs
x 0 1 2 3
y
1) Let us start with simple rule,
y = x
0 1 2 3
x 0 1 2 3
y
2) Now let’s y = x + 2
2 3 4 5
x 0 1 2 3
y
Now let’s y = 2x + 2
2 4 6 8
Let’s plot the coordinates of the
first two rules on one grid.
y
1 0
9
8
7
6
5
4
3
2
1
x0 432-3 -2 -1 1 5
-1
-2
-3
y
1 0
9
8
7
6
5
4
3
2
1
x0-3 -2 -1 1 2 3 4 5
-1
-2
-3
Join the
points to draw
the graph
27/01/2015 Presented By J. Mills-Dadson 4
Linear Graphs
x 0 1 2 3
y
2) Now let’s y = x + 2
2 3 4 5
x 0 1 2 3
y
Now let’s y = 2x + 2
2 4 6 8
Let’s plot the coordinates of the
These two rules on one grid.
y
1 0
9
8
7
6
5
4
3
2
1
x0 432-3 -2 -1 1 5
-1
-2
-3
y
1 0
9
8
7
6
5
4
3
2
1
x0-3 -2 -1 1 2 3 4 5
-1
-2
-3
Join the
points to
draw the
graph
What can you say about the slope and
where the cross the y – axis?

Linear graph[1]edit

  • 1.
    27/01/2015 Presented ByJ. Mills-Dadson 1 Linear Graphs Objectives: by the end of the lesson, students should be able to: generate coordinate pairs that satisfy a simple linear rule plot the graphs given explicitly in terms of x. Success Criteria: students should be able to generate coordinate pairs from E.g.: y = 2x  Keywords: substitute, intercept, gradient, origin, parallel
  • 2.
    27/01/2015 Presented ByJ. Mills-Dadson 2 Linear Graphs Linear graphs are straight lines The rule connecting x and y coordinates is of the form y = mx + c ‘m’ is the gradient : how flat or how steep the graph should be ‘c’ is the intercept: where the graph crosses the y-axis The meeting points of the x - axis and y – axis is called the origin
  • 3.
    27/01/2015 Presented ByJ. Mills-Dadson 3 Linear Graphs x 0 1 2 3 y 1) Let us start with simple rule, y = x 0 1 2 3 x 0 1 2 3 y 2) Now let’s y = x + 2 2 3 4 5 x 0 1 2 3 y Now let’s y = 2x + 2 2 4 6 8 Let’s plot the coordinates of the first two rules on one grid. y 1 0 9 8 7 6 5 4 3 2 1 x0 432-3 -2 -1 1 5 -1 -2 -3 y 1 0 9 8 7 6 5 4 3 2 1 x0-3 -2 -1 1 2 3 4 5 -1 -2 -3 Join the points to draw the graph
  • 4.
    27/01/2015 Presented ByJ. Mills-Dadson 4 Linear Graphs x 0 1 2 3 y 2) Now let’s y = x + 2 2 3 4 5 x 0 1 2 3 y Now let’s y = 2x + 2 2 4 6 8 Let’s plot the coordinates of the These two rules on one grid. y 1 0 9 8 7 6 5 4 3 2 1 x0 432-3 -2 -1 1 5 -1 -2 -3 y 1 0 9 8 7 6 5 4 3 2 1 x0-3 -2 -1 1 2 3 4 5 -1 -2 -3 Join the points to draw the graph What can you say about the slope and where the cross the y – axis?