Data Communications,Data Networks,computer communications,multiplexing,spread spectrum,protocol architecture,data link protocols,signal encoding techniques,transmission media
Data Communications,Data Networks,computer communications,multiplexing,spread spectrum,protocol architecture,data link protocols,signal encoding techniques,transmission media
Introduction to basics of wireless networks such as
• Radio waves & wireless signal encoding techniques
• Wireless networking issues & constraints
• Wireless internetworking devices
DVB is a set of standards that define digital broadcasting using existing satellite, cable, and terrestrial infrastructures.
The term digital television is sometimes used as a synonym for DVB
This ppt contains information about concepts of wireless communication, signal propagation effects, spread spectrum, cellular systems, multiple access systems.
This presentation deals with topics such as Electromagnetic Spectrum, Wireless Propagation, Signals, Signal propagation effects, Spread spectrum and cellular systems.
CBSE Class 12 Physics Sample ebook, which helps you to understand the chapter in easy way also downaload sample papers and previous year papers and practice to solve the question on time. Download at www.misostudy.com.
CBSE Class 12 PCM Sample ebook, which helps you to understand the chapter in easy way also downaload sample papers and previous year papers and practice to solve the question on time. Download at www.misostudy.com.
CBSE Class 12 PCB Sample ebook, which helps you to understand the chapter in easy way also downaload sample papers and previous year papers and practice to solve the question on time. Download at www.misostudy.com.
The Elphinstonian 1988-College Building Centenary Number (2).pdfMukesh Tekwani
This is the 1988 issue of The Elphinstonian, the annual magazine of Elphinstone College, Mumbai. This is the special issue to commemorate the Century of the Elphinstone College Building in Mumbai.
What is gravitation, Newton's law of gravitation, projection of a satellite, derivations, weightlessness explained, change in value of g with altitude, time period of a satellite, binding energy, escape velocity of a satellite,
ISCE-Class 12-Question Bank - Electrostatics - PhysicsMukesh Tekwani
This is a 14 page question bank on the chapters of Electrostatics. This is based on the syllabus of most Board exams such as CBSE, ISCE and state boards.
Extremely important topic for Digital electronics, digital circuits, computer architecture and computer science.
Full video is available on Youtube: https://youtu.be/oyOaXqx06pY
This video explains the method of converting a decimal number to a binary number. Many solved examples are given here and also two exercises which you can attempt on your own and then check the answers.
I have also discussed the concept of LSB (least significant bit) and MSB (most significant bit), and also least significant digit (LSD) and most significant digit (MSD).
This topic is important for following courses: class 11 and 12 computer science of all state boards, class 11 and 12 physics, BSc Computer science, BSc IT, MCA (Masters degree in Computer Applications), BTech, BE (First Year), and many competitive examinations.
Free Lectures on YouTube for IGCSE Physics for the syllabus effective 2020-21. These lectures cover the syllabus of IGCSE and a major part of GCSE syllabus also.
1. The Hidden Meaning of Words in Science Question Papers
2. Scientific Notation or Powers of Ten Notation
3. Units and Base Quantities
4. What is Physics?
What is Cyber Law? Why is cyber security law needed? International cyber law. What is copyright? What are security, controls, privacy, piracy and ethics? Code of ethics for computer professionals. What is cyber insurance?
Elevating Tactical DDD Patterns Through Object CalisthenicsDorra BARTAGUIZ
After immersing yourself in the blue book and its red counterpart, attending DDD-focused conferences, and applying tactical patterns, you're left with a crucial question: How do I ensure my design is effective? Tactical patterns within Domain-Driven Design (DDD) serve as guiding principles for creating clear and manageable domain models. However, achieving success with these patterns requires additional guidance. Interestingly, we've observed that a set of constraints initially designed for training purposes remarkably aligns with effective pattern implementation, offering a more ‘mechanical’ approach. Let's explore together how Object Calisthenics can elevate the design of your tactical DDD patterns, offering concrete help for those venturing into DDD for the first time!
Slack (or Teams) Automation for Bonterra Impact Management (fka Social Soluti...Jeffrey Haguewood
Sidekick Solutions uses Bonterra Impact Management (fka Social Solutions Apricot) and automation solutions to integrate data for business workflows.
We believe integration and automation are essential to user experience and the promise of efficient work through technology. Automation is the critical ingredient to realizing that full vision. We develop integration products and services for Bonterra Case Management software to support the deployment of automations for a variety of use cases.
This video focuses on the notifications, alerts, and approval requests using Slack for Bonterra Impact Management. The solutions covered in this webinar can also be deployed for Microsoft Teams.
Interested in deploying notification automations for Bonterra Impact Management? Contact us at sales@sidekicksolutionsllc.com to discuss next steps.
Accelerate your Kubernetes clusters with Varnish CachingThijs Feryn
A presentation about the usage and availability of Varnish on Kubernetes. This talk explores the capabilities of Varnish caching and shows how to use the Varnish Helm chart to deploy it to Kubernetes.
This presentation was delivered at K8SUG Singapore. See https://feryn.eu/presentations/accelerate-your-kubernetes-clusters-with-varnish-caching-k8sug-singapore-28-2024 for more details.
Builder.ai Founder Sachin Dev Duggal's Strategic Approach to Create an Innova...Ramesh Iyer
In today's fast-changing business world, Companies that adapt and embrace new ideas often need help to keep up with the competition. However, fostering a culture of innovation takes much work. It takes vision, leadership and willingness to take risks in the right proportion. Sachin Dev Duggal, co-founder of Builder.ai, has perfected the art of this balance, creating a company culture where creativity and growth are nurtured at each stage.
Smart TV Buyer Insights Survey 2024 by 91mobiles.pdf91mobiles
91mobiles recently conducted a Smart TV Buyer Insights Survey in which we asked over 3,000 respondents about the TV they own, aspects they look at on a new TV, and their TV buying preferences.
Transcript: Selling digital books in 2024: Insights from industry leaders - T...BookNet Canada
The publishing industry has been selling digital audiobooks and ebooks for over a decade and has found its groove. What’s changed? What has stayed the same? Where do we go from here? Join a group of leading sales peers from across the industry for a conversation about the lessons learned since the popularization of digital books, best practices, digital book supply chain management, and more.
Link to video recording: https://bnctechforum.ca/sessions/selling-digital-books-in-2024-insights-from-industry-leaders/
Presented by BookNet Canada on May 28, 2024, with support from the Department of Canadian Heritage.
UiPath Test Automation using UiPath Test Suite series, part 4DianaGray10
Welcome to UiPath Test Automation using UiPath Test Suite series part 4. In this session, we will cover Test Manager overview along with SAP heatmap.
The UiPath Test Manager overview with SAP heatmap webinar offers a concise yet comprehensive exploration of the role of a Test Manager within SAP environments, coupled with the utilization of heatmaps for effective testing strategies.
Participants will gain insights into the responsibilities, challenges, and best practices associated with test management in SAP projects. Additionally, the webinar delves into the significance of heatmaps as a visual aid for identifying testing priorities, areas of risk, and resource allocation within SAP landscapes. Through this session, attendees can expect to enhance their understanding of test management principles while learning practical approaches to optimize testing processes in SAP environments using heatmap visualization techniques
What will you get from this session?
1. Insights into SAP testing best practices
2. Heatmap utilization for testing
3. Optimization of testing processes
4. Demo
Topics covered:
Execution from the test manager
Orchestrator execution result
Defect reporting
SAP heatmap example with demo
Speaker:
Deepak Rai, Automation Practice Lead, Boundaryless Group and UiPath MVP
GDG Cloud Southlake #33: Boule & Rebala: Effective AppSec in SDLC using Deplo...James Anderson
Effective Application Security in Software Delivery lifecycle using Deployment Firewall and DBOM
The modern software delivery process (or the CI/CD process) includes many tools, distributed teams, open-source code, and cloud platforms. Constant focus on speed to release software to market, along with the traditional slow and manual security checks has caused gaps in continuous security as an important piece in the software supply chain. Today organizations feel more susceptible to external and internal cyber threats due to the vast attack surface in their applications supply chain and the lack of end-to-end governance and risk management.
The software team must secure its software delivery process to avoid vulnerability and security breaches. This needs to be achieved with existing tool chains and without extensive rework of the delivery processes. This talk will present strategies and techniques for providing visibility into the true risk of the existing vulnerabilities, preventing the introduction of security issues in the software, resolving vulnerabilities in production environments quickly, and capturing the deployment bill of materials (DBOM).
Speakers:
Bob Boule
Robert Boule is a technology enthusiast with PASSION for technology and making things work along with a knack for helping others understand how things work. He comes with around 20 years of solution engineering experience in application security, software continuous delivery, and SaaS platforms. He is known for his dynamic presentations in CI/CD and application security integrated in software delivery lifecycle.
Gopinath Rebala
Gopinath Rebala is the CTO of OpsMx, where he has overall responsibility for the machine learning and data processing architectures for Secure Software Delivery. Gopi also has a strong connection with our customers, leading design and architecture for strategic implementations. Gopi is a frequent speaker and well-known leader in continuous delivery and integrating security into software delivery.
Dev Dives: Train smarter, not harder – active learning and UiPath LLMs for do...UiPathCommunity
💥 Speed, accuracy, and scaling – discover the superpowers of GenAI in action with UiPath Document Understanding and Communications Mining™:
See how to accelerate model training and optimize model performance with active learning
Learn about the latest enhancements to out-of-the-box document processing – with little to no training required
Get an exclusive demo of the new family of UiPath LLMs – GenAI models specialized for processing different types of documents and messages
This is a hands-on session specifically designed for automation developers and AI enthusiasts seeking to enhance their knowledge in leveraging the latest intelligent document processing capabilities offered by UiPath.
Speakers:
👨🏫 Andras Palfi, Senior Product Manager, UiPath
👩🏫 Lenka Dulovicova, Product Program Manager, UiPath
Encryption in Microsoft 365 - ExpertsLive Netherlands 2024Albert Hoitingh
In this session I delve into the encryption technology used in Microsoft 365 and Microsoft Purview. Including the concepts of Customer Key and Double Key Encryption.
LF Energy Webinar: Electrical Grid Modelling and Simulation Through PowSyBl -...DanBrown980551
Do you want to learn how to model and simulate an electrical network from scratch in under an hour?
Then welcome to this PowSyBl workshop, hosted by Rte, the French Transmission System Operator (TSO)!
During the webinar, you will discover the PowSyBl ecosystem as well as handle and study an electrical network through an interactive Python notebook.
PowSyBl is an open source project hosted by LF Energy, which offers a comprehensive set of features for electrical grid modelling and simulation. Among other advanced features, PowSyBl provides:
- A fully editable and extendable library for grid component modelling;
- Visualization tools to display your network;
- Grid simulation tools, such as power flows, security analyses (with or without remedial actions) and sensitivity analyses;
The framework is mostly written in Java, with a Python binding so that Python developers can access PowSyBl functionalities as well.
What you will learn during the webinar:
- For beginners: discover PowSyBl's functionalities through a quick general presentation and the notebook, without needing any expert coding skills;
- For advanced developers: master the skills to efficiently apply PowSyBl functionalities to your real-world scenarios.
Software Delivery At the Speed of AI: Inflectra Invests In AI-Powered QualityInflectra
In this insightful webinar, Inflectra explores how artificial intelligence (AI) is transforming software development and testing. Discover how AI-powered tools are revolutionizing every stage of the software development lifecycle (SDLC), from design and prototyping to testing, deployment, and monitoring.
Learn about:
• The Future of Testing: How AI is shifting testing towards verification, analysis, and higher-level skills, while reducing repetitive tasks.
• Test Automation: How AI-powered test case generation, optimization, and self-healing tests are making testing more efficient and effective.
• Visual Testing: Explore the emerging capabilities of AI in visual testing and how it's set to revolutionize UI verification.
• Inflectra's AI Solutions: See demonstrations of Inflectra's cutting-edge AI tools like the ChatGPT plugin and Azure Open AI platform, designed to streamline your testing process.
Whether you're a developer, tester, or QA professional, this webinar will give you valuable insights into how AI is shaping the future of software delivery.
Software Delivery At the Speed of AI: Inflectra Invests In AI-Powered Quality
Chap 3 data and signals
1. CHAP 3. DATA AND SIGNALS
What is the difference between analog and digital signals?
(1) An analog signal is a continuously varying signal. Digital
signal has discrete values.
(2) An analog signal has many levels of intensity over a period
of time. A digital signal has only a limited number of
defined values.
What are periodic and non-periodic signals?
(1) A periodic signal completes a pattern in a definite time frame called a period. Or, we can
say that a periodic signal repeats itself after equal intervals of time.
(2) The completion of a pattern is a cycle.
(3) A non-periodic or aperiodic signal does not repeat itslef after equal intervals of time.
(4) Both analog and digital signals can be periodic or non-periodic signals
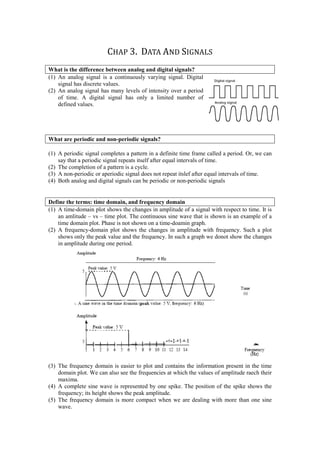
Define the terms: time domain, and frequency domain
(1) A time-domain plot shows the changes in amplitude of a signal with respect to time. It is
an amlitude – vs – time plot. The continuous sine wave that is shown is an example of a
time domain plot. Phase is not shown on a time-doamin graph.
(2) A frequency-domain plot shows the changes in amplitude with frequency. Such a plot
shows only the peak value and the frequency. In such a graph we donot show the changes
in amplitude during one period.
(3) The frequency domain is easier to plot and contains the information present in the time
domain plot. We can also see the frequencies at which the values of amplitude raech their
maxima.
(4) A complete sine wave is represented by one spike. The position of the spike shows the
frequency; its height shows the peak amplitude.
(5) The frequency domain is more compact when we are dealing with more than one sine
wave.
2. Prof. Mukesh N Tekwani [9869 488 356]
What is a composite signal?
(1) A single sine wave can not carry any meaningful information as it has just a single
frequency.
(2) A composite signal is made up of many sine waves of different frequencies. These waves
may also have different amplitudes and phases.
(3) According to Fourier analysis, any composite signal is a combination of simple sine
waves of different frequencies, amplitudes and phases.
(4) A composite signal can be periodic or nonperiodic.
(5) A periodic composite signal can be decomposed into a series of simple sine waves with
discrete frequencies that have integer values (1, 2, 3, and so on).
(6) A nonperiodic composite signal can be decomposed into a combination of an infinite
number of simple sine waves with continuous frequencies (frequencies that have real
values).
(7) A composite signal can be decomposed into its constituent signals.
A composite periodic signal
(8) The above signal when decomposed looks as shown below:
From the decomposed signal, we observe the following:
(i) The amplitude of the sine wave with frequeny f is the same as the peak amplitude of
the composite signal. This frequency f is called the fundamental frequeny or first
harmonic.
Page 2 of 10 Chap 3 – Data & Signals
3. Prof. Mukesh N Tekwani [mukeshtekwani@hotmail.com]
(ii) The amplitude of the signal with frequeny 3f is 1/3rd of that of the first. This
frequency of 3f is called the third harmonic.
(iii) The amplitude of the signal with frequency 9f is 1/9th of that of the first. This
frequency is the 9th harmonic.
(iv) The frequncy decomposition is discrete. The decomposed signal has frequencies of f,
3f and 7f. All these are integral values. We donot find frequencies such as 1.2f, etc.
Thus, the frequency domain of a periodic composite signal is made up of discrete
spikes or values.
The time and frequency domains of periodic and nonperiodic digital signals
Define the term bandwidth
(1) The range of frequencies contained in a composite signal is its bandwidth.
(2) The bandwidth is the difference between two frequencies. For example, if a composite
signal contains frequencies between 1000 and 5000, its bandwidth is 5000 - 1000, or 4000
Hz as shown below.
(3) In the diagram below we have a nonperiodic signal with the frequency range 1000 to
5000 Hz. The bandwidth is again 4000 Hz but the frequencies are continuous.
Chap 1 – Introduction Page 3 of 10
4. Prof. Mukesh N Tekwani [9869 488 356]
What is a digital signal?
(1) A digital signal is used to represent data. A binary 1 can be encoded with a positive
voltage while the binary 0 can be encoded with the zero voltage.
(2) A digital signal can have more than two levels. In such a case we can send more than one
bit per level.
(3) We can send 1 bit per level in the first case and 2 bits per level in the second case. If a
signal has L levels, then each level requires log2L bits.
(4) Most digital signals are aperiodic. Therefore frequency and time period are not
appropriate characteristics.
Page 4 of 10 Chap 3 – Data & Signals
5. Prof. Mukesh N Tekwani [mukeshtekwani@hotmail.com]
(5) The characteristics that are used to describe digital signals are : bit interval (instead of
period) and bit rate (instead of frequency).
(6) Bit interval is defined as the time required to send one bit.
(7) Bit rate is the number of bit intervals per second. It can also be defined as the number of
bits sent in one second. Units: bits per sec (bps)
(8) Bit length is the distance one bit occupies on the transmission medium. This is analogous
to the concept of wavelength for analog waves. Bit length = propagation speed x bit
duration.
How is decomposition of a digital signal achieved?
(1) A digital signal can be decomposed into an infinite number of simple sine waves called
harmonics.
(2) Each of these sine waves has a different frequency, amplitude and phase.
(3) Fourier analysis is used to decompose a digital signal.
(4) If the digital signal is periodic, the decomposed signal has a frequency domain
representation with an infinite bandwidth and discrete frequencies.
(5) If the digital signal is non-periodic, the decomposed signal still has an infinite bandwidth,
but the frequencies are continuous.
(6) A periodic signal has discrete frequencies while the non-periodic signal has continuous
frequencies.
What is meant by transmission impairment?
Explain the three types of transmission impairment.
(1) The transmission medium through which signals travel is not perfect. This imperfection
of the medium causes impairment of the signal.
(2) Impairment of a signal means that the signal quality at the beginning of the medium is not
the same as that at the end. Usually there is a deterioration in the quality of signal, as it
travels through the medium.
(3) The causes of impairment are:
a. Attenuation
b. Distortion
c. Noise
(4) Attenuations: Attenuation means a loss of energy. When a signal travels through a
medium, it loses some of its energy in overcoming the resistance of the medium. To
compensate for this loss, amplifiers are used to amplify the signal.
The loss or gain in signal strength is measured in units of decibel. The decibel (dB)
measures the relative strengths of two signals or one signal at two different points. The
decibel is negative if a signal is attenuated and positive if a signal is amplified.
dB = 10 log10 (P2 / P1)
P1 and P2 are the powers at points 1 (beginning of medium) and 2 (end of medium)
respectively.
Chap 1 – Introduction Page 5 of 10
6. Prof. Mukesh N Tekwani [9869 488 356]
Example 1:
Suppose a signal travels through a transmission medium and its power is reduced to
one-half. This means that P2 is (1/2)P1. In this case, the attenuation (loss of power) can
be calculated as
A loss of 3 dB (–3 dB) is equivalent to losing one-half the power.
Example 2:
A signal travels through an amplifier, and its power is increased 10 times. This means
that P2 = 10P1 . In this case, the amplification (gain of power) can be calculated as
Why is decibel unit used?
Decibel unit is used because these numbers can be added (or subtracted) when we are
measuring changes at several points (cascading). In Figure below a signal travels from
point 1 to point 4. In this case, the decibel value can be calculated as
(5) Distortion: Distortion means that the signal changes its form or shape. Distortion can
occur in a composite signal made of different frequencies. Each signal component has its
own propagation speed through a medium and, therefore, its own delay in arriving at the
final destination. Differences in delay may create a difference in phase if the delay is not
Page 6 of 10 Chap 3 – Data & Signals
7. Prof. Mukesh N Tekwani [mukeshtekwani@hotmail.com]
exactly the same as the period duration. In other words, signal components at the receiver
have phases different from what they had at the sender. The shape of the composite signal
is therefore not the same.
(6) Noise: Any unwanted signal is called noise. Several types of noise, such as thermal noise,
induced noise, crosstalk, and impulse noise, may corrupt the signal.
a. Thermal noise is the random motion of electrons in a wire which creates an extra
signal not originally sent by the transmitter.
b. Induced noise comes from sources such as motors and appliances. These devices
act as a sending antenna, and the transmission medium acts as the receiving
antenna.
c. Crosstalk is the effect of one wire on the other. One wire acts as a sending
antenna and the other as the receiving antenna.
d. Impulse noise is a spike (a signal with high energy in a very short time) that
comes from power lines, lightning, and so on.
Signal-to-noise Ratio:
The SNR is defined as: the ratio of average signal power to the average noise power.
The SNR ratio indicates the ratio of the wanted signal to the unwanted signal (white
noise). A high value of SNR means that the signal is less corrupted by noise.
Since SNR is the ratio of two powers, it is described in decibel units as follows:
SNRdB = 10 log10 SNR
For a noise-less channel, SNR = infinity. Such a channel is not achievable.
Example: The power of a signal is 10 mW and the power of the noise is 1 µW; what
are the values of SNR and SNRdB ?
Chap 1 – Introduction Page 7 of 10
8. Prof. Mukesh N Tekwani [9869 488 356]
In the above diagrams we have shown the case of a high SNR and low SNR
Distinguish between baseband transmission and broadband transmission.
Digital signals can be transmitted by one of the two ways: baseband transmission and
broadband transmission.
Baseband Transmission:
1. In baseband transmission we send a digital signal without changing it into an analog
signal.
2. For baseband transmission we require a low-pass channel. A low-pass channel is one
which has a bandwidth that starts from 0.
3. We require a dedicated medium with a bandwidth consisting of only one channel. E.g.,
the entire bandwidth of a cable connecting two computers is one single channel.
4. A low-pass channel with infinite bandwidth is ideal but such a medium cannot be realise
din practice. Below we show two low pass channels, one with a narrow bandwidth and
the other with a wide bandwidth.
Page 8 of 10 Chap 3 – Data & Signals
9. Prof. Mukesh N Tekwani [mukeshtekwani@hotmail.com]
Low-pass Channel with wide Bandwidth:
1. If we want to preserve the exact form of a non-periodic digital signal we must send the
entire spectrum with the continuous range of frequencies between 0 and infinity.
2. This is possible only if we have a dedictaed medium of infinite bandwidth, between the
sender and the receiver. This medium should preserve the exact amlitude of each
component of the composite signal. But it is observed that the amplitudes of frequencies
near the end of the bandwidth are so small that they can be ignored.
3. We observe that the output signal is not an exact replica of the input signal and that the
data can be deduced from the received signal.
4. Thus, baseband transmission of a digital signal that preserves the shape of the digital
signal. This is possible only if we have a low-pass channel with infinite or very wide
bandwidth.
5. An example of a dedicated channel where the entire bandwidth of the medium is used as
one single channel is the LAN cable. E.g., in bus topology, only two stations can
communicate with each other at any given time.
6. If more than one transmission must be sent over a single channel, it must be done using
the technique of multiplexing.
Low-pass Channel with limited Bandwidth:
1. In a low pass chaneel with limited bandwidth, we approximate the digital signal with an
analog signal.The level of approximation dpends on the available bandwidth.
2. He required bandwidth is proportional to the bit rate. To increase the bit rate we must
have a higher bandwidth.
Broadband Transmission
1. In broadband transmission, the digital signal is changed into an analog signal for
transmission.
2. If the available channel is a bandpass channel, we cannot send a digital signal directly
through this channel. The digital signal must be converted to analog before transmission.
3. We use a bandpass channel for this purpose. A bandpass channel is one whose bandwidth
doesnot start from 0. Thus we can consider a low pass channel as a band pass channel
with the lower frequency starting at 0.
Chap 1 – Introduction Page 9 of 10
10. Prof. Mukesh N Tekwani [9869 488 356]
In the figure below we show the modulation of a digital signal.
4. A digital signal is converted into a composite analog signal. We have used a single
frequency analog signal called a carrier. The amplitude of the carrier has been changed to
look like the digital signal. The result is a composite signal.
5. At the receiver end the composite signal is converted to digital and the result is the digital
signal that was originally transmitted.
6. Example of broadband transmission: sending digital data from a computer, throught the
telephone line. The converter used in this case is called a modem
(modulator/demodulator).
Page 10 of 10 Chap 3 – Data & Signals
![Prof. Mukesh N Tekwani [9869 488 356]
What is a composite signal?
(1) A single sine wave can not carry any meaningful information as it has just a single
frequency.
(2) A composite signal is made up of many sine waves of different frequencies. These waves
may also have different amplitudes and phases.
(3) According to Fourier analysis, any composite signal is a combination of simple sine
waves of different frequencies, amplitudes and phases.
(4) A composite signal can be periodic or nonperiodic.
(5) A periodic composite signal can be decomposed into a series of simple sine waves with
discrete frequencies that have integer values (1, 2, 3, and so on).
(6) A nonperiodic composite signal can be decomposed into a combination of an infinite
number of simple sine waves with continuous frequencies (frequencies that have real
values).
(7) A composite signal can be decomposed into its constituent signals.
A composite periodic signal
(8) The above signal when decomposed looks as shown below:
From the decomposed signal, we observe the following:
(i) The amplitude of the sine wave with frequeny f is the same as the peak amplitude of
the composite signal. This frequency f is called the fundamental frequeny or first
harmonic.
Page 2 of 10 Chap 3 – Data & Signals](data:image/gif;base64,R0lGODlhAQABAIAAAAAAAP///yH5BAEAAAAALAAAAAABAAEAAAIBRAA7)