Downloaded 167 times


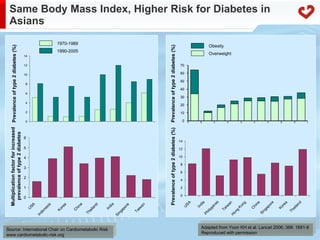


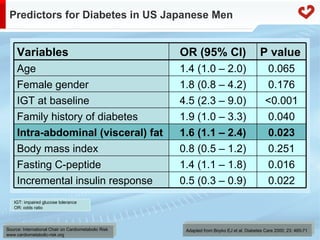


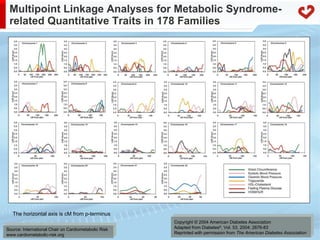


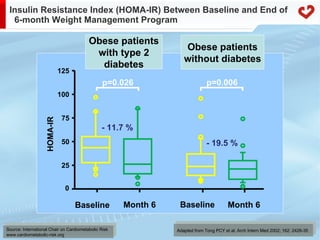


The document discusses metabolic syndrome from an Asian perspective, focusing on obesity and its associated health risks such as type 2 diabetes and cardiovascular diseases. It highlights the genetic, hormonal, and lifestyle factors contributing to the syndrome while emphasizing the importance of visceral fat as a key risk factor. The text also explores the public health implications and the need for structured care approaches in addressing the increasing burden of chronic diseases in Asia.


![2. prof. bambang irawan cv assessment in met s and t2dm [compatibility mode]](https://cdn.slidesharecdn.com/ss_thumbnails/2-150106044647-conversion-gate01-thumbnail.jpg?width=640&height=640&fit=bounds)


