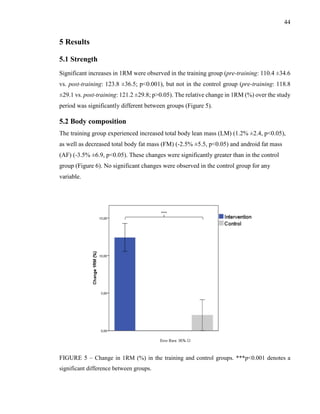
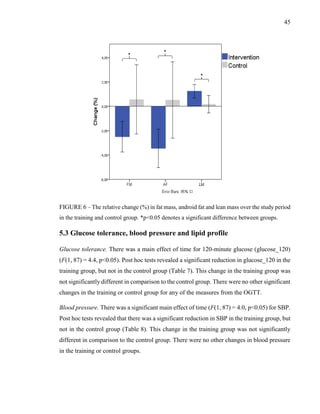
1
EFFECTS OF A SHORT-TERM RESISTANCE TRAINING
PROTOCOL ON RISK FACTORS FOR THE METABOLIC
SYNDROME IN THE ELDERLY
ALISTAIR INGLIS
Master’s Thesis in Exercise Physiology
2014 – 2016
Department of Biology of Physical Activity
University of Jyväskylä
Supervisors: H. Kyröläinen, H. Kainulainen and S. Walker
2
ABSTRACT
Inglis, Alistair. 2016. Effects of a short-term, resistance training protocol on risk factors for
the metabolic syndrome in the elderly. Department of Biology of Physical Activity,
University of Jyväskylä. Master’s Thesis in Exercise Physiology. 79 pp.
The metabolic syndrome is strongly associated with negative health outcomes, such as type
2 diabetes, cardiovascular disease and death. The elderly are at particularly high risk of
developing the metabolic syndrome, owing to the physiological and behavioural changes
associated with aging. The positive influence that resistance training has on the
neuromuscular system has long been evident; however, in more recent years, increasing focus
has been placed on the role of RT in preventing and treating chronic disease. The majority of
studies in the literature suggest that RT has a positive effect on cardiometabolic risk factors.
That being said, there remain some inconsistencies. Whether improvements following RT
are clinically significant and truly meaningful also remains a disputed point. Further, the
physiological mechanisms underlying improvements in risk factors for the metabolic
syndrome following RT have not been fully elucidated. The aim of this study was to
investigate the effects of a short-term, high-repetition RT protocol with short rest periods on
risk factors for the metabolic syndrome in an untrained, heterogeneous elderly population.
The results suggest that RT has a positive effect on risk factors for the metabolic syndrome
in the elderly. RT led to meaningful improvements in these risk factors – reducing abdominal
fat and systolic blood pressure while increasing glucose tolerance. It is unclear whether RT
positively affects diastolic blood pressure and the lipid profile; the present results suggest
that it does not. The mechanisms underlying positive changes in cardiometabolic risk factors
following RT remain complex. However, the present results highlight the role of fat and
obesity in both the development and treatment/prevention of the metabolic syndrome. The
majority of studies in the literature use relatively long lasting, high-frequency protocols (~48
total training sessions) to investigate the effects of RT on cardiometabolic risk factors. This
study appears to be the first to show improvements in risk factors for the metabolic syndrome
in the elderly following a short-term RT protocol with only 24 total training sessions. The
results of the present study should be considered when prescribing exercise for the elderly.
The results suggest that small doses of RT (24 hours) can have a significant, health-promoting
effect. This point is important when considering that a major barrier to exercise is a lack of
time.
Keywords: The metabolic syndrome, resistance training, insulin resistance, glucose
tolerance, hypertension, lipid profile, dose-response.
3
ACKNOWLEDGMENTS
This study was carried out through the Department of Biology of Physical Activity, at the
University of Jyväskylä.
I would like to acknowledge the department, as well as Simon Walker and Heikki Kyröläinen
for their continued support. Furthermore, I would like to thank the technical staff of the
department for their tireless work.
A special thanks to fellow students, Javier Alonso and Elena Fernández Lezaun, for their
contributions.
4
CONTENTS
ABSTRACT
ACKNOWLEDGMENTS
CONTENTS
1 INTRODUCTION………………………………………………………………………...6
2 REVIEW OF THE LITERATURE……………………………………………………….8
2.1 The metabolic syndrome. . . . . . . . . . . . . . . . ……………………………………8
2.1.1 Description……………………………………………………………8
2.1.2 Components…………………………………………………………..8
2.1.3 Diagnosis…………………………………………………………….13
2.1.4 Prevalence…………………………………………………………...13
2.1.5 Pathophysiology……………...……………………………………...14
2.1.6 Consequences………………………………………………………..18
2.1.7 Management…………………………………………………………18
2.2 Reistance training……………………………………………………………...19
2.2.1 Description…………………………………………………………..19
2.2.2 Resistance training and the elderly…………………………………..19
2.2.3 Resistance training and disease prevention………………………….20
2.3 Resistance training and the metabolic syndrome………………………………20
2.3.1 Insulin resistance and glucose tolerance……………………………..20
2.3.2 Abdominal obesity.………………………………………………….25
2.3.3 Blood pressure. ………………………………………………..…….27
2.3.4 Lipid profile…………………………………………………………29
2.3.5 Mechanisms …………………………………………………………31
2.3.6 Dose-response relationship ………………………………………….31
3 AIMS OF THE STUDY………………………………………………………………….34
3.1 Research questions and hypotheses ………………………………………...…34
5
4 METHODS………….…………………………………….………………………...…....35
4.1 Subjects ……………………………………………………………………….35
4.2 Experimental design …………………………………………………………..36
4.2.1 Overall design ……………………………………………………….36
4.2.2 Training protocol ……………………………………………………37
4.2.3 Control group ……………………………………………………….39
4.3 Data collection …………………………………………………………………39
4.3.1 Strength………………………………………………………………39
4.3.2 Body composition …………………………………………………...41
4.3.3 Glucose tolerance, blood pressure and lipid profile…………..……..42
4.4 Statistical analysis……………………………………………………………..43
5 RESULTS………….…………………………………………………………………….44
5.1 Strength………………………………………………………………………..44
5.2 Body composition…………………………………………………………..…44
5.3 Glucose tolerance, blood pressure and lipid profile……………………………45
5.4 Correlations……………………………………………………………………47
6 DISCUSSION……………………………………………………………………………50
7 CONCLUSION…………………………………………………………………………..65
8 REFERENCES………………………………………………………………………..…66
34
6
1 INTRODUCTION
The metabolic syndrome is characterized by the clustering of cardiometabolic risk factors
(Byrne & Wild 2011). The primary risk factors, markers or components of the metabolic
syndrome are insulin resistance/impaired glucose tolerance, abdominal obesity, hypertension
and dyslipidemia. The prevalence of the metabolic syndrome is increasing across the world
(Bechtold et al. 2006). The International Diabetes Federation (IDF) has estimated that about
a quarter of the world’s adult population has the metabolic syndrome (Kaur 2014). The
elderly are at particularly high risk of developing the metabolic syndrome, owing to the
physiological and behavioural changes associated with aging. A cross-sectional study of
2,049 Finnish men and women aged 45-64 years old found that the metabolic syndrome was
present among 38.8% of men and 22.2% of women (Ilanne-Parikka et al. 2004).
The positive impact of resistance training on the musculoskeletal system has been evident
for decades. Resistance training is especially important for elderly populations, as aging is
associated with losses in strength and muscle mass. Evidence indicates that resistance
training can slow age-related losses in strength and muscle mass in the elderly, which
contributes to improved functional capacity and increased independence (Hurley et al. 2011,
Strasser & Schobersberger 2011, Tresierras & Balady 2009).
There has been considerable research conducted in past decades investigating various
methods of ameliorating cardiometabolic risk factors related to the metabolic syndrome. The
management of the metabolic syndrome generally focuses on lifestyle interventions, namely
increasing physical activity levels and improving dietary habits (Bechtold et al. 2006).
In recent years, the role of resistance training in disease prevention and treatment has received
more emphasis. There is a growing body of evidence that suggests that resistance training
improves important cardiometabolic risk factors (Hurley et al. 2011, Strasser &
Schobersberger 2011, Tresierras & Balady 2009). Resistance training may be an effective
tool in the prevention or treatment of the metabolic syndrome. While there is substantial
evidence to support this claim, there remain some inconsistencies in the literature.
7
The primary aim of this study is to investigate the effects of a short-term, high-repetition
resistance training protocol with short rest periods on risk factors for the metabolic syndrome
in an untrained, heterogeneous elderly population. Resistance training will likely have a
positive influence on strength and muscle mass; however, whether it will have a statistically
and clinically significant effect on risk factors for the metabolic syndrome is unclear.
Additionally, specific consideration will be given to a possible dose-response relationship
between RT and improvements in risk factors for the metabolic syndrome, as well as the
physiological mechanisms underlying any improvements in these risk factors.
8
2 REVIEW OF THE LITERATURE
2.1 The metabolic syndrome
2.1.1 Description
A syndrome consisting of a clustering of metabolic and cardiovascular risk factors was first
described in 1988, when it was noted that insulin resistance was associated with the causation
and clinical course of type 2 diabetes, coronary artery disease and hypertension (Reaven
1988). This question has since been the focus of a large volume of research. Reaven (1988)
originally termed the clustering of risk factors associated with insulin resistance as syndrome
x. Other terms, such as the deadly quartet, cardiometabolic syndrome and obesity
dyslipidemia syndrome are also used, but the most common term is the metabolic syndrome.
The metabolic syndrome refers to the co-occurrence of the following cardiometabolic
components: insulin resistance/impaired glucose tolerance, abdominal obesity, hypertension
and dyslipidemia (Byrne & Wild 2011).
There has been some debate regarding the practicality of the term “the metabolic syndrome.”
It is unclear whether the concept of the metabolic syndrome is particularly useful for
researchers, policy makers and health care professionals. Ultimately, it is very clear that the
components of the metabolic syndrome cluster together and are strongly associated with
negative health outcomes (Byrne & Wild 2011). Therefore, the metabolic syndrome as a
concept is essential in that it puts a name, and thus a spotlight, on these inter-related risk
factors.
2.1.2 Components
Insulin resistance and impaired glucose tolerance. Insulin resistance is a physiological
condition where the insulin-dependent cells (i.e. muscle, adipose, brain, kidney, liver) fail to
respond correctly to insulin signalling. While the body still produces insulin normally,
insulin-dependent cells are unable to respond effectively to the action of insulin. As the
primary role of insulin is to promote the absorption of glucose into cells, insulin resistance
results in hyperglycemia and impaired glucose tolerance. Consequently, beta cells in the
9
pancreas increase their production of insulin, leading to hyperinsulinemia. Insulin resistance
often progresses to type 2 diabetes, characterized by hyperglycemia and insulin resistance.
Insulin resistance is a powerful risk factor and is associated with increased risk of
cardiovascular disease. It also plays a central role in the development of the metabolic
syndrome (Lechleitner 2008).
The gold standard in assessing insulin resistance is the hyperinsulinemic-euglycemic clamp
technique (Ayala et al. 2011). While this is the most accurate way of assessing insulin
resistance, it is not typically used in the clinical setting due to complexity and possible
dangers. Indirect measures of assessing insulin resistance also exist. An oral glucose
tolerance test (OGTT) measures glucose tolerance and indirectly assesses insulin resistance
by measuring the body’s response to glucose ingestion. Typically, in an OGTT, a baseline
blood sample is taken before the subject ingests a glucose load, following which two
additional blood samples are taken, one at 60 minutes and another at 120 minutes. Glucose
and insulin concentrations at baseline, 60 minutes and 120 minutes are interpreted to asses if
a subject is insulin resistant, or has impaired glucose tolerance (Table 1).
TABLE 1 – Interpretation of an OGTT according to the World Health Organization (WHO)
(Alberti & Zimmet 1998).
Another method is to measure glycosylated hemoglobin (HbA1c), which assesses glycaemic
control, and indirectly, insulin sensitivity (Hurley et al 2011).
Abdominal obesity. Obesity, the result of a long-term positive energy balance, is a powerful
risk factor associated with many chronic diseases. A long-term positive energy balance leads
to the storage of excess adipose tissue. Abdominal obesity is the excess accumulation of
adipose tissue around the area of the abdomen. An important component of abdominal
120-minute OGTT (plasma glucose) Interpretation
< 7.8 mmol/L Non-diabetic
7.8-11.1mmol/L Impaired glucose tolerance/pre-diabetic
≥ 11.1 mmol/L Consistent with diabetes mellitus
10
adiposity is visceral or intra-abdominal fat, which is adipose tissue located within the
peritoneal cavity. Obesity, in particular abdominal obesity, is linked to insulin resistance, the
development of cardiovascular disease, type 2 diabetes and the metabolic syndrome
(Bechtold et al. 2006). Specifically, it is the adipocytokines released from visceral adipose
tissue that are believed to be central to the development of insulin resistance, dyslipidemia
and hypertension (Lechleitner 2008).
Techniques such as computed tomography (CT), magnetic resonance imaging (MRI) and
dual-energy x-ray absorptiometry (DXA) are used to assess abdominal obesity. Only MRI
and CT can differentiate between visceral and subcutaneous adipose tissue (Scherzer et al.
2008). The severity of abdominal obesity can also be assessed by taking waist and hip
circumference measurements.
Android fat refers to fat located in the abdominal region. DXA software (EnCore) calculates
fat mass in the android region, defined as the area over the abdomen, extending from the iliac
crest toward the head for 20% of the distance from the iliac crest to the base of the skull
(Stults-Kolehmainen et al. 2013). Subcutaneous and visceral fat are not differentiated within
the android region however, various DXA regions of interest (ROI’s) in the abdomen have
been shown to be reasonable surrogate measures of abdominal visceral adipose tissue
(Miazgowski et al. 2014). Furthermore, while abdominal visceral adipose tissue is typically
regarded as the most clinically significant fat depot, a 2011 study found that android fat is
more closely related to the metabolic syndrome in the elderly than abdominal visceral adipose
tissue (Kang et al. 2011). Therefore, investigating android fat as defined by DXA software
provides vital data relevant to the study of insulin resistance, the metabolic syndrome and
cardiovascular disease.
Hypertension. Blood pressure (BP) is the pressure exerted by circulating blood against the
walls of blood vessels. Blood pressure is expressed as systolic blood pressure (SBP) over
diastolic blood pressure (DBP). Blood pressure is typically measured either manually with a
mercury or aneroid sphygmomanometer, or automatically with a digital device.
Hypertension is a physiological condition where blood pressure is elevated pathologically
and chronically. Hypertension is a powerful risk factor for cardiovascular disease and is
associated with coronary heart disease, coronary artery disease, peripheral artery disease and
11
chronic kidney disease (Kannel 1996). There are different classifications of systolic and
diastolic hypertension (Table 2). Evidence suggests that systolic blood pressure is a stronger
predictor of cardiovascular events than diastolic blood pressure (Mourad 2008).
TABLE 2 – Joint National Committee (JNC7 - United States) classification of blood pressure
(The Seventh Report of the Joint National Committee on Prevention, Detection, Evaluation, and
Treatment of High Blood Pressure 2004).
Category Systolic blood pressure
(mm/Hg)
Diastolic blood pressure
(mm/Hg)
Normal <120 <80
Pre-hypertension 120-139 80-89
Hypertension stage 1 140-159 90-99
Hypertension stage 2 ≥ 160 ≥ 100
Dyslipidemia. Lipids such as fats, cholesterol and triglycerides, are naturally occurring
molecules that are involved in storing energy and signalling processes. Lipoproteins are
protein complexes that carry lipids, as lipids are mostly insoluble in liquid. Lipoproteins are
classified by their relative density and size. Low-density lipoproteins (LDL) and high-density
lipoproteins (HDL) are small and mainly transport cholesterol. Very low-density lipoproteins
(VLDL) is another important lipid transporter, and is converted to LDL in the bloodstream.
Total cholesterol (TC) is the measure of the total amount of cholesterol in blood, including
LDL and HDL cholesterol.
High plasma concentrations of certain lipids, such as triglycerides (TG), are associated with
negative health outcomes and increased incidence of cardiovascular disease (Crook 2012).
LDL cholesterol is the “bad” cholesterol, as it contributes to plaque and causes
atherosclerosis. LDL cholesterol is an important risk factor for cardiovascular disease;
evidence shows that LDL cholesterol levels are predictive of major cardiovascular events
(Barter et al. 2007). HDL cholesterol is the “good” cholesterol. HDL cholesterol plays a
cardioprotective role by removing cholesterol from the arteries and returning it to the liver
(Crook 2012). Research shows that high concentrations of HDL cholesterol protect against
12
cardiovascular disease and low concentrations increase the risk of atherosclerotic diseases
(Singh et al. 2007).
The lipid profile refers to a panel of blood tests that assess lipid and lipoprotein levels. The
lipid profile typically measures LDL cholesterol, HDL cholesterol, triglycerides and total
cholesterol levels. Dyslipidemia refers to abnormal levels of lipids and lipoproteins
associated with negative health outcomes, characterized by elevated LDL cholesterol,
elevated total cholesterol, elevated triglyceride levels and decreased HDL cholesterol levels
(Table 3) (Ahmed et al. 1998).
TABLE 3 – Interpretation of lipid and lipoprotein levels according to the National Cholesterol
Education Program (NCEP - United States) Adult Treatment Plan (ATP) – III; converted from
mg/dl to mmol/L (Expert Panel on Detection, Evaluation, and Treatment of High Blood
Cholesterol in Adults 2001).
Level (mmol/L) Interpretation
LDL Cholesterol < 2.6 Optimal
2.6 – 3.3 Near optimal
3.4 – 4.1 Borderline high
4.2 – 4.9 High
> 4.9 Very high
HDL Cholesterol < 1.0 Low
≥ 1.55 High (optimal)
Total Cholesterol < 5.2 Optimal
5.2-6.2 Borderline High
> 6.2 High
Triglycerides < 1.7 Normal (optimal)
1.7-2.2 Borderline High
2.3-5.6 High
>5.6 Very High
13
2.1.3 Diagnosis
The National Cholesterol Education Program (United States) described their criteria
definition for the clinical diagnosis of the metabolic syndrome in 2001, where an individual
is diagnosed with the metabolic syndrome if they have 3 or more of the following risk factors:
waist circumference ≥ 102 cm in men or ≥ 88 cm in women; triglycerides ≥ 150 mg/dl; HDL-
C < 40 mg/dl in men and < 50 mg/dl in women; fasting glucose ≥ 110 mg/dl; blood pressure
≥ 135/85 mm Hg (Expert Panel on Detection, Evaluation, and Treatment of High Blood
Cholesterol in Adults 2001). The majority of epidemiological and clinical studies in the
literature have used the NCEP criteria definition of the metabolic syndrome (Lechleitner
2008). In 2005, the IDF formed their own criteria definition, which is similar to the NCEP
definition, except that it describes abdominal obesity as the central component and contains
ethnic-specific cut-off points for waist circumference (Alberti et al. 2005). In 2009, a
consensus statement from the IDF and several other national and international organizations
presented a revised criteria definition (Alberti et al. 2009). This revised definition includes
ethnic specific values while also considering the role of drug treatment, but much like the
2005 definition, it follows the overall framework of the 2001 NCEP definition.
2.1.4 Prevalence
The prevalence of the metabolic syndrome is increasing worldwide. The IDF approximates
that about a quarter of the world’s adult population has the metabolic syndrome (Kaur 2014).
Further, the prevalence of the metabolic increases with age. In the United States,
approximately 7% of the population between 20 and 29 years old has the metabolic syndrome
and this number rises to 44% in the age group of 60-69 years old (Ford et al. 2002). In Finnish
individuals aged 45-64 years old, a cross-sectional study found that the metabolic syndrome
was present among 38.8% of men and 22.2% of women (Ilanne-Parikka et al. 2004).
The increasing prevalence of the metabolic syndrome is associated with the increasing
prevalence of obesity. The prevalence of overweight and obese individuals is increasing in
most developed countries (Flegal et al. 2002, Gutierrez-Fisac et al. 2000). The increasing
predominance of the metabolic syndrome is also related to population aging. Population
aging is taking place in almost all the countries in the world (United Nations Population
Division 2013). Population aging results in increased proportions of older and elderly
14
individuals in the overall population. Changes in lifestyle habits as well as physiological
changes put the elderly at increased risk of developing the metabolic syndrome (Bechtold et
al. 2006).
2.1.5 Pathophysiology
The pathophysiology of the metabolic syndrome is not completely clear. However, it appears
to be attributable to insulin resistance and abdominal obesity (Lechleitner 2008). Insulin
resistance is considered to be the link between abdominal obesity and the co-occurrence of
hypertension and dyslipidemia. Abdominal obesity is strongly associated with insulin
resistance (Byrne & Wild 2011, Lechleitner 2008). According to Byrne & Wild (2011), the
common hypothesis for the development of insulin resistance is as follows: a long term
positive energy balance leads to adipose tissue expansion and adipocyte hypoxia and death.
This in turn causes macrophage infiltration and adipose tissue inflammation, resulting in
impaired adipose tissue function. The ensuing adipocytokine dysregulation promotes the
development of both local and systemic insulin resistance, while further disrupting adipose
tissue function. The resulting insulin resistance then causes hypertension and dyslipidemia.
Adipocytokines. Adipose tissue should be considered an endocrine organ, as it secretes
proteins called adipocytokines, including leptin, adiponectin, resistin and inflammatory
cytokines that are responsible for the regulation of various physiological processes related to
energy metabolism, the immune response, inflammation and insulin sensitivity (Byrne &
Wild 2011). The interaction between the adipocytokines released from adipose tissue and
insulin-signalling pathways is central to the development of the metabolic syndrome.
Evidence indicates that adiponectin promotes insulin sensitivity, while free fatty acids, leptin,
resistin and pro-inflammatory cytokines promote insulin resistance (Lechleitner 2008).
Adiponectin is released from adipose tissue, and promotes insulin sensitivity and the
production of anti-inflammatory cytokines. Plasma adiponectin levels are low in insulin
resistance (Byrne & Wild 2011). Leptin is produced in adipose tissue and regulates food
intake, energy expenditure and hepatic glucose production. High plasma levels of leptin and
leptin resistance characterize most forms of obesity (Lechleitner 2008). Tumor-necrosis
factor alpha (TNF-α) and resistin are two other adipocytokines that effect insulin signalling.
TNF-α promotes insulin resistance and importantly, it supresses adiponectin transcription
15
(Byrne & Wild 2011). Resistin has a potent effect on glucose metabolism in rats, and has an
inhibitory effect on insulin action (Byrne & Wild 2011).
Free fatty acids. Aside from adipocytokines, free fatty acids (FFA) may play a key role in
the development of insulin resistance. It is hypothesized that the excessive flux of free fatty
acids from adipose tissue during obesity alters substrate utilization in skeletal muscle,
promoting insulin resistance (Byrne & Wild 2011). Furthermore, elevated free fatty acids
may disrupt insulin signalling by decreasing glucose transporter type 4 (GLUT-4) (Boden &
Shulman 2002).
Free fatty acids are released from triglycerides in adipose tissue through the action of
hormone-sensitive lipase, and from lipoproteins through the action of lipoprotein lipase
(Lechleitner 2008). These mechanisms are both regulated by insulin, and insulin resistance
further increases the release of free fatty acids from adipose tissue and disrupts the clearance
of triglyceride-rich lipoproteins (Boden & Shulman 2002).
Inflammatory mechanisms. Chronic inflammation may play an important role in obesity-
related insulin resistance (Qatanani & Lazar 2007). There is strong evidence that systemic
inflammation may be the causal link behind insulin resistance (Shoelson et al. 2006, Dandona
et al. 2004). Biomarkers of inflammation such as interleukin-6 (IL-6) and C-reactive protein
(CRP) circulate in high concentrations in insulin resistance. Furthermore, these inflammatory
biomarkers predict the development of type 2 diabetes (Qatanani & Lazar 2007). One study
has shown that the activation of inflammatory pathways in liver cells led to both local and
systemic insulin resistance in mice (Cai et al. 2005).
As mentioned previously, obesity is characterized by macrophage accumulation in adipose
tissue. This inflammation contributes to the dysfunction of adipose tissue and the resulting
production of adipocytokines is believed to cause insulin resistance (Byrne & Wild 2011).
One study found that the inhibition of macrophage accumulation in the adipose tissue of mice
improved insulin sensitivity (Kanda et al. 2006).
Neural mechanisms. A neural component may be associated with obesity-related insulin
resistance. Evidence shows that the brain receives information from adiposity signals like
leptin and insulin and nutrients like fatty acids and in response sends signals to regulate
16
substrate metabolism and eating behaviour (Qatanani & Lazar 2007). Two studies have
shown a link between neural mechanisms and systemic insulin resistance in rats (Obici et al.
2002a, Obici et al. 2002b). Whether these same neural mechanisms are present in humans is
unclear.
Cell-intrinsic factors. In obesity, high circulating levels of fatty acids and other lipids result
in the storage of triglycerides in muscles and the viscera, which has been termed “ectopic fat
storage.” Ectopic fat storage is linked to insulin resistance; the mechanism is unclear, but it
is likely related to the activation of harmful pathways related to mitochondrial dysfunction,
oxidative stress and endoplasmic reticulum (ER) stress (Qatanani & Lazar 2007).
Oxidative stress refers to the accumulation of harmful reactive oxygen species (ROS)
(Qatanani & Lazar 2007). Oxidative stress correlates with fat accumulation in both humans
and mice (Halliwell 1995). Furthermore, studies have shown that improving the ratio of anti-
oxidants to ROS ameliorates insulin resistance in humans and rats (Konrad et al. 1999,
Khamaisi et al. 1997).
Mitochondrial dysfunction may also be linked to insulin resistance. It is thought to contribute
to ectopic fat storage (Petersen & Shulman 2006). Furthermore, insulin resistance is
associated with mitochondrial dysfunction and accompanied by high levels of triglycerides
in the liver and muscle cells of elderly individuals (Petersen et al. 2003).
Finally, obesity places a strain on the machinery of the endoplasmic reticulum, which triggers
an ER stress response (Qatanani & Lazar 2007). This ER stress response disrupts the insulin
signalling chain and causes insulin resistance (Ozcan et al. 2004). Furthermore, a 2005 study
found that over-expression of ER protectors in mice protected against type 2 diabetes (Ozawa
et al. 2005). Additionally, the ER stress response may augment oxidative stress (Qatanani &
Lazar 2007).
While the pathophysiology of obesity-related insulin resistance has not been completely
elucidated, it is related to the components discussed above. As many of these components
are inter-related, it is probable that they interact together to contribute to systemic insulin
resistance. Alternatively, it is possible that one component plays a dominant role while the
other are secondary.
17
Insulin resistance and hypertension. There is a strong association between insulin resistance
and hypertension. Evidence indicates that the link between diabetes and hypertension appears
to be hyperinsulinemia, which commonly occurs with insulin resistance (DeFronzo &
Ferrannini 1991). Hypertensive patients often have an increased plasma insulin response to
an OGTT. Furthermore, the insulin resistance of essential hypertension correlates directly
with the severity of the hypertension. Several mechanisms have been proposed to link insulin
resistance and hypertension, such as sympathetic nervous system over-activity, sodium
retention, proliferation of vascular smooth muscle cells and impaired membrane ion transport
(DeFronzo & Ferrannini 1991). The relationship between insulin resistance and hypertension
may be cause-effect. Insulin resistance promotes hypertension, but hypertension can also
promote insulin resistance by modifying the transport of insulin and glucose to skeletal
muscle (Salvetti et al. 1993).
Insulin resistance and dyslipidemia. Insulin resistance and hyperinsulinemia are also
associated with an adverse lipid profile. Elevated levels of plasma insulin promote VLDL
formation, which results in hypertriglyceridemia (DeFronzo & Ferrannini 1991). The
following breakdown of VLDL particles leads to increased formation of LDL cholesterol.
Insulin resistance is also associated with low levels of HDL cholesterol (Rader 2007).
Independent of its direct effects on plasma lipids and lipoproteins, insulin itself has been
shown to be atherogenic (DeFronzo & Ferrannini 1991). Insulin promotes the transport of
cholesterol into the arteriolar smooth muscle and slows the reversion of lipid plaques.
The excessive flux of FFA from adipose tissue also promotes dyslipidemia (Rader 2007).
FFA stimulate the synthesis of triglycerides in the liver, which in turn results in the secretion
of VLDL particles. Furthermore, evidence suggests that the adverse lipid profile associated
with type 2 diabetes is related to the excessive flux of FFA (Mooradian 2009). The severity
of insulin resistance may explain the severity of dyslipidemia; a study examining obese
individuals found that the degree of insulin resistance explained a significant amount of the
adverse fluctuations in triglycerides, LDL cholesterol and HDL cholesterol (Steinberger et
al. 1995).
Insulin resistance and the elderly. The prevalence of the metabolic syndrome is highest
among the elderly. This is partially attributable to age-related changes in body composition,
18
such as increases in fat mass and decreases in fat-free mass that enhance insulin resistance
(Lechleitner 2008). Furthermore, the aging of adipocytes may impair their ability to store
lipids. Finally, mitochondrial dysfunction may enhance the age-related increase in insulin
sensitivity.
While the pathophysiology of the metabolic syndrome has not been completely described,
the behaviours linked to its development are apparent. Cigarette smoking, physical inactivity
and atherogenic diets are all strongly linked to obesity and the metabolic syndrome (Hurley
et al. 2011). In addition, genetics appear to play a key role, as it seems that there is a
heritability component of the metabolic syndrome (Pollex & Hegele 2006).
2.1.6 Consequences
The metabolic syndrome is associated with increased risk of type 2 diabetes and
cardiovascular disease, along with numerous other disease outcomes such as atherosclerosis,
fatty liver, polycystic ovary syndrome, gallstones, asthma, sleep apnea and selected
malignant diseases (Byrne & Wild 2011). The risk for diabetes is increased about 5-fold and
the risk for cardiovascular events about 2-fold for those with the metabolic syndrome
(Lechleitner 2008). The pooled relative risk of all-cause mortality is approximately 50%
higher in those with the metabolic syndrome (Wu et al. 2010). Importantly, the metabolic
syndrome appears to be a better predictor of negative health outcomes than its individual
components; a 2004 prospective cohort study following 6255 individuals between the ages
of 30 and 75 years old showed that the metabolic syndrome was more strongly associated
with cardiovascular disease and overall mortality than its individual risk factors alone (Malik
et al. 2004).
2.1.7 Management
The management of the metabolic syndrome is multifactorial. The prevention or reduction
of obesity should be a primary objective. Management of obesity typically consists of
increasing exercise levels, modifying lifestyle behaviours, using pharmacological agents and
undergoing surgery (Bechtold et al. 2006). Similarly, food logs and meal planning advice
have been shown to be beneficial in promoting and maintaining weight loss (Bechtold et al.
2006). Reductions in obesity improve components of the metabolic syndrome (Lechleitner
19
2008). Therefore, lifestyle interventions should be the primary step in the management of the
metabolic syndrome.
2.2 Resistance training
2.2.1 Description
Resistance training (RT) comprises of “any activity that causes muscles to contract against
external force” (Sundell 2011). The primary goal of resistance training is to overload the
musculoskeletal system, in attempts to develop the strength and mass of skeletal muscles.
Weight machines, dumbbells, barbells, resistance bands, body mass and weighted clothes are
typically used as resistance. A RT protocol encompasses the following variables: muscle
actions used, resistance type used, total number of sets and repetitions (volume), muscle
groups trained, sequence of exercise performed, length of rest intervals, repetition velocity
and training frequency (Kraemer & Ratamess 2004). These variables are manipulated to
maximize outcomes and achieve specific goals.
The health benefits of RT are numerous. RT primarily increases strength and muscle mass,
as well as enhancing bone health by increasing bone mineral density (Layne & Nelson 1999).
RT also develops the strength of ligaments, tendons, joint cartilage and connective tissue
sheaths within muscles. Evidence also suggests that RT reduces the incidence of injury in
sport (Fleck & Falkel 1986). Finally, research shows that RT improves body composition,
physical performance, functional independence, movement control, cognitive abilities and
self-esteem (Levinger et al. 2007, Westcott 2012).
2.2.2 Resistance training in the elderly
Aging is associated with losses in muscle and strength. Research shows that this loss in
muscle mass is approximately 0.46 kilograms per year, from the fifth decade onwards
(Strasser & Schobersberger 2011). The degenerative loss of muscle mass with aging is
termed sarcopenia, and is associated with physiological and functional declines that lead to
increased fragility and disability. Strong evidence supports the role of resistance training in
slowing and preventing age-related losses in muscle mass and strength (Strasser &
Schobersberger 2011, Tresierras & Balady 2009, Hurley et al. 2011). Furthermore, research
shows that RT reduces frailty and weakness, while increasing independence and improving
20
the functional capacity of older and elderly individuals (Galvao & Taaffe 2005, DiFrancisco-
Donoghue et al. 2007). Consequently, resistance training is particularly important for elderly
populations.
2.2.3 Resistance training and disease prevention
The positive effect of RT on the musculoskeletal system has long been evident, however in
recent years, more emphasis has been placed on the role of RT in disease prevention (Hurley
et al. 2011). Cross-sectional studies show that muscle mass is inversely correlated with all-
cause mortality and with the prevalence of the metabolic syndrome (Strasser &
Schobersberger 2011). Skeletal muscle is a primary target for glucose and triglyceride
disposal. Furthermore, it is a critical component of resting metabolic rate. Research suggests
that maintaining a large, active muscle mass improves metabolic and cardiovascular risk
factors, such as insulin resistance, obesity and hypertension (Strasser & Schobersberger
2011). Therefore, the consequences of age-related losses in muscle mass are apparent.
Reduced muscle mass leads to reduced metabolic rate and reduced capacity for lipid
oxidation, along with increased abdominal fat mass (Strasser & Schobersberger 2011). The
role of aerobic training in reducing cardiometabolic markers has been well established, but
the role of RT remains less clear (Tresierras & Balady 2009). Nonetheless, there is a growing
body of evidence demonstrating that RT may play an important role in both the prevention
and treatment of chronic disease (Hurley et al. 2011, Tresierras & Balady 2009, Strasser &
Schobersberger 2011).
2.3 Resistance training and the metabolic syndrome
2.3.1 Insulin resistance and glucose tolerance
Cross-sectional studies show that low strength and muscle mass are associated with type 2
diabetes (Park et al. 2006, Park et al. 2007, Park et al. 2009). Both muscle strength and muscle
quality are inferior in those with diabetes. Furthermore, poor muscle quality is associated
with impaired glycemic control (Park et al. 2006). In a study where adults were followed
over the course of three years, those with diabetes showed greater losses in muscle mass and
strength than those without diabetes (Park et al. 2007).
21
There is a large body of evidence that suggests that RT improves insulin sensitivity and
glucose tolerance, regardless of the characteristics of the subjects or the training protocol. RT
has been shown to improve markers of insulin action and glycemic control in those with type
2 diabetes (Baldi & Snowling 2003, Cauza et al. 2005, Ibanez et al. 2005, Ishii et al. 1998,
Sigal et al. 2007, Bweir et al. 2009). For instance, a randomised controlled trial (RCT)
investigating the effect of RT in older Latino men and women showed improved glycosylated
hemoglobin (HbA1c) levels after performing progressive resistance training 3 times a week
for 16 weeks (Castaneda et al. 2002). While the reduction in HbA1c was modest, a prospective
observational study has shown that small changes in HbA1c are associated with large changes
in health outcomes (Stratton et al. 2000). For example, a 1% increase in HbA1c represents a
21% increase in the risk for diabetes death, 14% increase for the risk of myocardial infarction
and a 37% increase in the risk for microvascular complications.
A meta-analysis published in 2006 examined the effect of different training modalities
(aerobic training (AT), RT or combined) on glucose control in those with type 2 diabetes
(Snowling & Hopkins 2006). 27 studies examining the effect of training on HbA1c were
included in the analysis. The overall benefits were small, however there was a mean decrease
of approximately 0.8 of a unit percent of HbA1c with AT and 0.5 of a unit percent decrease
with RT, when the training protocols lasted longer than 12 weeks. While the benefits appear
modest, as previously mentioned, small changes in HbA1c are associated with large changes
in health outcomes. Furthermore, according to the authors, the benefits of AT and RT were
comparable to those reported for dietary or drug treatments.
Similar results can also be seen with healthy subjects (Miller et al. 1984, Miller et al. 1994).
Using an OGTT and the hyperinsulinemic-euglycemic clamp technique, Miller et al. (1994)
investigated the effects of a 16-week RT protocol performed 3 times a week in healthy,
middle-aged men. Insulin action was improved and plasma insulin levels were reduced in the
OGTT following the training intervention (Figure 1) although there was no change in plasma
glucose responses to the OGTT (Figure 2).
22
FIGURE 1 – Plasma insulin response to an OGTT, before (open circles) and after (shaded
circles) RT. Insulin levels were significantly lower following training (Miller et al. 1994).
FIGURE 2 – Plasma glucose response to an OGTT, before (open circles) and after (shaded
circles) RT. There was no significant difference between the glucose response before and after
training (Miller et al. 1994).
23
A meta-analysis examining the effects of RT on HbA1c concluded that RT positively
influences glucose tolerance (Strasser et al. 2010). Importantly, they noted that the greatest
reductions in HbA1c were found when baseline levels were above 8.0%. While improvements
in glucose tolerance and insulin resistance have been seen following RT in both diabetic and
healthy subjects, this result suggests that diabetic subjects, or subjects with pre-diabetes
(impaired glucose tolerance), experience the greatest response to RT.
An array of studies, using a variety of protocols, ranging from short-term to long-term, low-
volume to high-volume and low-intensity to high-intensity, have revealed improvements in
insulin sensitivity and glucose tolerance following RT (Table 4).
It is unclear if there is a certain RT protocol that is best designed to generate effective
improvements in insulin resistance and glucose tolerance. However, in the meta-analysis of
Snowling & Hopkins (2006), significant improvements in glucose tolerance only became
evident with RT protocols lasting longer than 12 weeks. This result indicates that there may
be a relationship between RT protocol length (total number of weeks) and glucose tolerance,
as longer lasting protocols appear to have a more pronounced effect on glucose tolerance.
Similarly, the meta-analysis of Strasser et al. (2010) reported that that protocols of longer
duration (>10 weeks) resulted in greater improvements in glucose tolerance.
There is a large volume of studies showing improvements in insulin resistance and glucose
tolerance following a RT protocol; however, there are studies that do not show similar
improvements. In one study, 4 months of home-based RT using exercise bands in type 2
diabetics resulted in no improvements in HbA1c (Cheung et al. 2009). It is possible that the
exercise bands did not provide an adequate stimulus to invoke significant change; this
combined with the fact that RT sessions were not supervised, may explain the lack of
improvement in glucose tolerance. Elsewhere, 12 weeks of high intensity (75-80% 1RM) RT
performed 3 times a week did not cause improvements in HbA1c in elderly subjects
(Geirsdottir et al. 2012). The authors suggested that the lack of a significant improvement in
glucose tolerance was related to the relatively low baseline levels of HbA1c (6.8%) of their
subjects. According to the meta-analysis of Strasser et al. (2010), the greatest improvements
in HbA1c resulting from RT are seen when baseline levels are above 8.0%.
24
TABLE 4 – The details of training protocols that have induced improvements in insulin
resistance and/or glucose tolerance.
While the literature supports the role of RT in improving insulin sensitivity and glucose
tolerance, the underlying physiological mechanisms are unclear. Changes in body
composition are a common hypothesis. Skeletal muscle is a primary target for insulin-
stimulated glucose uptake. Furthermore, skeletal muscle is the main tissue responsible for
Authors Length
(total
weeks)
Frequency
(sessions
per week)
Volume (sets
x reps)
Intensity
(relative to
1RM)
Outcome
Brooks et al.
2007
16 3 3 x 8 60-80% 1RM Reduced
insulin
resistance
Castaneda et al.
2013
16 3 3 x 8 60-80% 1RM Improved
HbA1c
Egger et al.
2013
8 Not shown Group 1: 2 x 10-
12
Group 2: 25-30
Group 1: 70%
1RM
Group 2: 40%
1RM
Improved
glycemic
control in both
group 1 and 2;
no difference
between
groups
Ibanez et al.
2005.
16 2 First 8 weeks: 3-4
sets of 10-15
Last 8 weeks: 3-5
sets of 5-6 reps
First 8 weeks:
50-70% of
1RM
Last 8 weeks:
70-80% 1RM
Improved
insulin
sensitivity
Ishii et al. 1998 4-6 5 2 x 10-20 40-50% 1RM Improved
insulin
sensitivity
Miller et al.
1984
10 3 3 x 8 8RM Improved
insulin levels
25
the increase in glucose metabolism following exercise and hyperinsulinemia (DeFronzo et
al. 1981). Castaneda et al. (2002) found that changes in glycemic control were associated
with changes in strength and muscle mass. There was an inverse correlation between HbA1c
and both whole-body strength and lean tissue mass. Another study showed that changes in
fasting glucose and HbA1c levels after a 10-week RT program were inversely correlated to
changes in fat-free mass in obese, type 2 diabetic men (Baldi & Snowling 2003).
Obesity is associated with the development of insulin resistance. Therefore, it seems likely
that a decrease in fat mass would result in increased insulin action. However, increases in
insulin-stimulated glucose uptake have been demonstrated following RT, even when
corrected for changes in fat mass (Tresierras & Balady 2009).
Aerobic training has a known beneficial effect on insulin action and glucose tolerance
(Tresierras & Balady 2009). These improvements appear to be related to increases in GLUT-
4 content, protein kinase B content (PKB) and glycogen synthase (GS) activity, as well as
changes in muscle fiber type and in oxidative and non-oxidative enzyme activity. It is
possible that these adaptations are also responsible for the improvements occurring with RT.
A MEDLINE Plus/Ovid literature search of studies published between 1950 and 2008
suggested that changes in insulin sensitivity following RT were not solely related to changes
in FM or LM, but also related to qualitative changes in skeletal muscle (Tresierras & Balady
2009). Changes in adipocytokines, pro-inflammatory cytokines and other immune system
biomarkers have also been proposed to be associated with RT-induced changes in insulin
sensitivity. For example, improvements in insulin sensitivity seen after a 16-week RT
program in Hispanic older adults with type 2 diabetes were related to lower levels of
inflammatory markers. However, this remains a controversial point as changes in insulin
sensitivity have been found following RT without corresponding changes in adipocytokines
or inflammatory marker levels (Klimcakova et al. 2006, Reynolds et al. 2004)
2.3.2 Abdominal Obesity
Numerous studies have reported reductions in fat mass (FM) following RT protocols in both
obese and non-obese subjects (Miller et al. 1984, Pratley et al. 1994, Campbell et al. 1994,
Hunter et al. 2000, Castaneda et al. 2002, Schmitz et al. 2003). Since the reduction in fat
26
mass is often accompanied by an increase in lean mass (LM), there is often no change in
body weight. Therefore, RT is sometimes overlooked as a therapy for obesity, despite the
beneficial influence it has on body composition. Increases in LM have important
consequences as LM is closely related to resting metabolic rate. An estimated 5 kg increase
in LM translates to an estimated increase in energy expenditure of 100 kcal per day (Strasser
& Schobersberger 2011). This is especially noteworthy when considering that aging is
associated with rapid losses in muscle mass. Maintaining a large, active muscle mass can
mitigate the effects of aging and improve body composition. Studies specifically
investigating RMR have demonstrated that RT can increase RMR, even in older and elderly
populations (Campbell et al. 1994, Pratley et al. 1994).
The role of RT in improving body composition is also significant when considering calorie
restriction diets. Calorie restriction diets have been shown to be effective in inducing weight
loss although they are also associated with reductions in LM and RMR (Tresierras & Balady
2009). The effects of a diet only (DO) intervention was compared with a combined diet and
RT (DR) intervention in 33 obese men (Ross et al. 1996). Similar reductions in body weight
were achieved in both DO and DR groups; however, only the DR group saw a preservation
of skeletal muscle volume – skeletal muscle volume was significantly decreased in the DO
group.
Not only does RT reduce total body FM, but evidence also suggests that RT targets visceral
fat located in the abdomen. For instance, 16 weeks of RT performed 3 times a week using
variable resistance machines resulted in reductions in visceral fat in both men and women,
with concurrent increases in LM (Treuth et al. 1994, Treuth et al. 1995). Similarly, Ibanez et
al. (2005) reported a 10.3% reduction in visceral fat following 16 weeks of progressive RT
performed 2 times a week in older men with type 2 diabetes. 16 weeks of RT is also effective
in diminishing visceral fat when combined with dietary interventions (Ross & Rissanen 1994,
Ross et al. 1996, Rice et al. 1999).
Evidence suggests that RT can prevent the regain of visceral adipose tissue following weight
loss (Hunter et al. 2010). Women followed a calorie restriction diet and lost weight for 1
year. After the year of weight loss, subjects were divided into a RT or control group for a 1-
27
year follow-up. Those not exercising in the follow-up experienced a 38% increase in visceral
fat while there was no increase in visceral fat in the RT group.
In this literature review, an array of studies using a variety of protocols, ranging from short-
term (12 weeks) to long-term (48 weeks), low-volume (5 reps per set) to high-volume (12
reps per set) and low-intensity (60% 1RM) to high-intensity (85% 1RM), were investigated
in attempts to understand better the effects of RT on body composition. It is unclear if there
is a certain RT protocol that is best designed to produce effective reductions in FM. However,
it is noteworthy that all the studies described presently revealing reductions in visceral fat
following RT used protocols lasting 16 weeks or longer in length. One study investigating
the effects of a 12-week, 3 times a week, low-intensity RT protocol using resistance bands
found no reductions in visceral fat in type 2 diabetics (Kwon et al. 2010). The lack of a
significant reduction in visceral fat may be attributable to the lower duration of the protocol
compared to those reported above, suggesting that there is a relationship between RT protocol
length and visceral fat. Alternatively, it may be related to the low-intensity nature of the
resistance bands used.
2.3.3 Blood pressure
Evidence from cross-sectional studies indicate that strength-trained athletes tend to have
normal resting blood pressure levels (Goldberg 1989, Byrne & Wilmore 2000).
Two meta-analyses, one from 2000 and the other from 2005, searched the literature for
studies examining the effect of RT on BP (Kelley & Kelley 2000, Cornelissen & Fagard
2005). Each meta-analysis had similar search inclusion strategies; studies had to be
randomised controlled trials, RT had to be the only intervention, the intervention had to be 4
weeks or longer and subjects had to be normotensive or hypertensive, sedentary adults. The
meta-analysis from 2000 included studies from 1966 to 1998, totalling 320 subjects. The
results showed a significant mean decrease of 3 mmHg for both SBP and DBP, as a result of
the RT. This was equated to a 2% decrease in SBP and 4% decrease in DBP. The meta-
analysis from 2005 included studies from 1996 to 2003, totalling 341 subjects. The result of
the meta-analysis was similar to that of Kelley & Kelley (2000); the overall effect of RT was
a mean decrease of 3.2 mmHg in SBP and 3.5 mmHg in DBP. While RT appears to have
only a modest BP-reducing effect, small changes can have major consequences. A 3 mmHg
28
reduction in SBP is estimated to decrease the risk of cardiac morbidity by 5 - 9%, stroke by
8 - 14% and all-cause mortality by 4% (Whelton et al. 2002).
The majority of studies in the literature suggest that RT has a beneficial effect on BP;
however, there are studies that reveal no significant changes in SBP or DBP following RT
(Cononie et al. 1991, Smutok et al. 1993, Honkola et al. 1997). In addition, the meta-analysis
of Strasser et al. (2010) concluded that RT has a positive influence on SBP, but not DBP;
their analysis of 13 RCTs revealed no statistically significant effect of RT on DBP. Genetics
may affect the response of BP to RT (Hurley et al. 2011). In an unpublished study described
in Hurley et al. (2011), older men and women with a specific genotype within their
angiotensin II type 1 receptor and angiotensionogen gene experienced the greatest reduction
in BP after RT, in comparison with those with other genotypes at this loci.
Both the meta-analysis of Kelley & Kelley (2000) and Cornelissen & Fagard (2005) noted
that there is a small volume of research examining the effects of RT on BP in individuals
with hypertension; studies that have suggest that RT has a beneficial effect on those with
varying levels of prehypertension or hypertension (Martel et al. 1999, Harris & Holly 1987,
Hagberg et al. 1984, Collier et al. 2008, Miura et al. 2015). In addition, acute bouts of RT
appear to invoke a hypotensive response (Fisher 2001, Hardy & Tucker 1998). This response
was present in both normotensive and prehypertensive subjects.
In this literature review, an array of studies using a variety of RT protocols, ranging from
short-term (4 weeks) to long-term (24 weeks) and low intensity (40% 1RM) to high-intensity
(80% 1RM), were investigated in attempts to better understand the effects that RT has on BP.
It is unclear whether there is a certain RT protocol that is best designed to improve BP,
however, Strasser et al. (2010) identified a possible relationship between RT volume and
frequency and improvements in BP. They noted that higher frequency protocols (3 times a
week versus 2 or less) with greater volumes (9 sets per muscle group per week or more)
resulted in the most effective reductions in BP.
If RT does truly improve BP, the underlying physiological mechanisms are unclear.
According to Komi (2003), reductions in BP are likely related to decreased body fat and
changes in sympathoadrenal drive. In his review, Goldberg (1989) investigated possible
mechanisms. He determined that changes in BP due to RT were likely a result of one or a
29
combination of the following adaptations: reduced heart rate, increased insulin sensitivity,
increased muscle mass and strength and decreased body fat and body salt levels.
2.3.4 Lipid Profile
Cross-sectional studies provide little insight into the effect of RT on the lipid profile. For
instance, one cross-sectional study showed that HDL cholesterol values in male strength
athletes are comparable to that of endurance athletes (Yki-Jarvinen et al. 1984). However,
another found that strength athletes have reduced HDL cholesterol values in comparison to
endurance athletes (Clarkson et al. 1981).
The results from longitudinal studies and randomised controlled trials are also inconclusive.
Some studies show that in men and women with normal lipid profiles, a short-term RT
protocol improves levels of TC, LDL cholesterol, HDL cholesterol and TG (Goldberg et al.
1984, Hurley et al. 1988). However, other investigations have revealed no reduction in
dyslipidemia after RT (Manning et al. 1991, Smutok et al. 1993, LeMura et al. 2000, Staron
et al. 2000, Dunstan et al. 2002).
There exists several studies, suggesting that RT improves the lipid profile, that have been
criticized in subsequent review articles for not using proper controls to isolate the
independent effect of RT (Komi 2003, Hurley 1989, Hurley et al. 2011). Inadequate control
of age, diet and training program has been identified, as well as not considering the acute
effects of the last RT session. The review of Hurley et al. (1989) concluded that when studies
are properly controlled, the majority show no significant improvement in the lipid profile
following RT. Similarly, another review came to the same conclusion, affirming that RT has
little influence on the lipid profile in middle-aged and older individuals (Braith & Stewart
2006). A meta-analysis examining studies from 1955 to 2007, representing 1329 men and
women, found that RT lowered total cholesterol, LDL cholesterol and triglyceride values
(Kelley & Kelley 2009). However, included in this meta-analysis were some of the studies
that were criticized by Hurley et al. (1989), Braith & Stewart (2006) and Hurley et al. (2011).
Despite the large body of evidence that suggests that RT has little or no effect on the lipid
profile, there are some well-controlled studies that show otherwise. For instance, one study
investigating the effects of an 11-week RT protocol (8RM) in healthy, elderly women
30
concluded that RT positively influences the lipid profile (Fahlman et al. 2002). They revealed
elevated HDL levels and reduced LDL, TC and TG levels in the intervention group compared
to the control group. Elsewhere, Asian Indians with type 2 diabetes performed 12 weeks of
progressive resistance training (Misra et al. 2008). There was a significant decline in both
total cholesterol and triglycerides in the intervention group. It is noteworthy that both these
independent studies revealed a reduction in TG following RT, as elevated TG is a component
of the criteria definition of the metabolic syndrome.
There are few investigations into the effect of RT in subjects with dyslipidemia alone. A
single study examined the influence of 20 weeks of high-volume (15-20 RM) RT in subjects
with abnormal lipid profiles, in combination with at least two other markers for coronary
heart disease (Kokkinos et al. 1991). The results revealed no significant changes in TG, TC
or HDL.
The effect of RT on the lipid profile remains controversial. Further, it is unclear if there is a
particular RT protocol that is best designed to produce improvements in the lipid profile. In
this literature review, an array of studies using a variety of RT protocols, ranging from short-
term (11 weeks) to long-term (24 weeks) and low-intensity (40% 1RM) to high-intensity
(85% 1RM), have been investigated in attempts to elucidate the effect that RT has on the
lipid profile. Evidence suggests that high-volume, low-intensity RT protocols may be the
most effective in improving HDL levels (Strasser et al. 2010). For instance, one study using
high-volume, low-intensity (40-60% RM) RT resulted in improvements in HDL after 1 year
of exercise (Balducci et al. 2004). Conversely, two studies using higher intensity RT
protocols (70-80% RM and 75-85% RM) revealed no improvements in HDL (Castaneda et
al. 2002, Dunstan et al. 2002). In addition, a study investigating the acute effects of RT of
varying intensities found a similar result (Lira et al. 2010). The low-intensity groups (50%
1RM and 75% 1RM) experienced the greatest acute improvements in the lipid profile in
comparison to the high-intensity groups (90% 1RM and 110% 1RM). According to the meta-
analysis of Strasser et al. (2010), there may also be a relationship between RT frequency and
improvements in the lipid profile. They identified a study that revealed that improvements in
LDL and TG were greater when subjects performed RT 2 times a week, rather than 3
(Honkola et al. 1997).
31
If RT does indeed improve the lipid profile, the underlying physiological mechanisms are
unclear. Improvements may be related to changes in the oxidative capacity of skeletal muscle
due to a shift from type 2b fibers to type 2a, or an increase in the number of capillaries per
muscle fiber. Changes in body composition, specifically reductions in fat mass, have also
been proposed (Komi 2003).
2.3.5 Mechanisms
Resistance training appears to enhance the cardiometabolic profile and improve markers of
the metabolic syndrome. However, the physiological mechanisms underlying these
improvements have not been completely elucidated.
In this review of the literature, changes in muscle strength and muscle quality, as well as
changes in body composition, have consistently emerged as possible mechanisms. Changes
in adipocytokines, pro-inflammatory cytokines and other immune system biomarkers may
also be involved.
As many of these potential mechanisms are inter-related, it is probable that they interact
together to improve markers of the metabolic syndrome. Alternatively, it is possible that one
component plays a dominant role while the others are secondary.
2.3.6 Dose-response relationship
When investigating the use of RT as a tool to prevent and/or treat chronic disease, it is
important to consider the dose-response relationship. In other words, it is necessary to know
how much RT is needed (in terms of the length, frequency, volume and duration of RT) to
invoke a clinically significant, meaningful improvement in cardiometabolic risk factors.
This literature review has attempted to identify any possible dose-response relationship
between RT and improvements in risk factors for the metabolic syndrome. Possible dose-
response relationships were identified between:
 RT protocol length and improvements in glucose tolerance (2.3.1)
 RT protocol length and reductions in visceral fat (2.3.2)
 RT protocol volume and frequency and improvements in BP (2.3.3)
32
 RT protocol volume and frequency and improvements in the lipid profile
(2.3.4)
Overall, it is unclear whether there is a certain RT protocol that is best designed to induce
effective improvements in risk factors for the metabolic syndrome in the elderly; however,
from this review, it does appear that there exists some dose-response relationship between
RT and cardiometabolic risk factors.
A lack of time is the most commonly cited barrier to physical activity and exercise (Sallis JF
1999). Older adults and the elderly often identify physical activity as time consuming (Chao,
et al. 2000). Therefore, it is important to identify the minimal amount of RT needed (smallest
dose) to produce meaningful, health-promoting changes in risk factors for the metabolic
syndrome.
The vast majority of studies investigating the effects of RT on risk factors for the metabolic
syndrome use RT protocols lasting 16 weeks or more in length (Brooks et al. 2006, Castaneda
et al. 2002, Cauza et al. 2005, Sigal et al. 2007, Smutok et al. 1993, Cheung et al. 2009,
Reynolds et al. 2004, Ryan et al. 2001, Pratley et al. 1994, Hunter et al. 2002, Schmitz et al.
2003, Treuth et al. 1994, Treuth et al. 1995, Balducci et al. 2004, Dunstan et al. 2002, LeMura
et al. 2000, Kokkinos et al. 1991, Honkola et al. 1997, Cononie et al. 1991, Martel et al.
1999). Those using shorter lasting protocols typically use RT frequencies of 3 times a week
or more (Baldi & Snowling 2003, Ishii et al. 1998, Bweir et al. 2009, Miller et al. 1984,
Geirsdottir et al. 2012, Klimcakova et al. 2006, Campbell et al. 1994, Kwon et al. 2010,
Manning et al. 1991, Fahlman et al. 2002, Misra et al. 2008, Harris & Holly 1987). Overall,
in the literature, the total number of RT sessions per study ranges from approximately 27-
156 session, with the average being ~48 sessions.
There are a very limited number of studies investigating the effects of RT on cardiometabolic
risk factors using short-term (<16 weeks) and low frequency (<3 times a week) protocols;
only two studies have been identified (Staron et al. 2000, Miura et al. 2015). Staron et al.
(2000) found that 16 sessions of RT (8 weeks x 2 times a week) did not alter lipid levels in
young, healthy males. Miura et al. (2015) reported that 24 RT sessions (12 weeks x 2 times
a week) improved BP in older women. It is important to note that the circuit RT was
33
performed in conjunction with recreational/aerobic activities; therefore, the study did not
investigate the effects of RT alone.
34
3 AIMS OF THE STUDY
3.1 Research questions and hypotheses
The effect of resistance training on risk factors for the metabolic syndrome has not been
completely elucidated. While the majority of studies suggest that RT has a positive effect on
these risk factors, there are some contradictory results. Further, the positive changes after RT
are often statistically significant, but questions can be asked of their clinical significance.
The mechanisms by which RT exerts a positive effect on risk factors for the metabolic
syndrome are controversial. Further, the smallest dose of RT needed to exert a meaningful
effect on these risk factors is unclear.
Therefore, the primary aims of the study are:
1) To investigate the effects of a short-term, high-repetition resistance training protocol
with short rest periods on risk factors for the metabolic syndrome in an untrained,
heterogeneous elderly population
2) If there are improvements in risk factors for the metabolic syndrome following RT,
attempt to identify if they are clinically significant
The secondary aims of the study are:
1) Investigate the physiological mechanisms underlying changes following RT
2) To consider the results in the context of the dose-response relationship
3) To consider the outcomes of the study in terms of practical application in attempts to
make recommendations about exercise prescription and participation.
It is expected that the RT protocol used presently will improve strength and muscle mass.
Whether RT will influence risk factors for the metabolic syndrome in a meaningful way is
unclear. Any precise hypothesis regarding underlying mechanisms and the dose-response
relationship are not realistic at this point in time.
35
4 METHODS
4.1 Subjects
A letter was sent out in October 2014 to 2000 individuals between 65 and 75 years old in the
Jyväskylä region. Information about the individuals was received from the central records
bureau (Väestorekisterikeskus). From the 2000 letters sent out, 450 individuals registered for
the study, 140 attended an information session and 115 signed informed consent forms and
were medically screened. The medical examination was completed in January 2015. To
participate in the study, individuals had to meet the following exclusion criteria:
 Be between 65 and 75 years old
 On average, perform less than 3 hours of aerobic/endurance training a week
 Have no experience in resistance training
 No smoking
 No lower limb disabilities (cartilage damage, replaced joints etc.)
 Non-obese (<30 BMI)
 No testosterone therapy in the past 10 years
 No adverse reactions to exercise in the past 6 months
One hundred one individuals were cleared to participate in the study. The sample study
(n=101) was divided into a training group (n=79) and a control group (n=22) (Table 5). The
study was performed in accordance with the Declaration of Helsinki and was approved by
the University of Jyväskylä Ethical Committee.
Anthropometric data, including standing height (wall-mounted tape measure, accuracy 0.01
m) and weight (digital scale, accuracy 0.1 kg, Seca 708, Seca, Espoo, Finland), were assessed
pre-training. Body mass index was calculated using the formula:
BMI =
Body mass (kg)
Height2 (m)
36
TABLE 5. The body composition, anthropometric and sex characteristics of the study sample,
training group and control group.
Study Sample Training Group Control Group
Mean ±SD Mean ±SD Mean ±SD
Age (yrs.) 69.3 ±2.7 69.3 ±2.8 69.3 ±2.3
Body mass (kg) 77.8 ±13.8 79.0 ±14.4 74.0 ±11.2
Height (m) 1.67 ±0.09 1.67 ±0.09 1.67 ±0.09
BMI 27.6 ±3.7 28.0 ±3.9 26.3 ±2.4
Sex
56 female, 45
male
45 female, 34
male
11 female, 11 male
4.2 Experimental design
4.2.1 Overall design
The experimental design of the study can been in Figure 3.
FIGURE 3 – The experimental design of the study.
Baseline measurements were completed in February 2015 on all participating subjects.
Following baseline measurements, subjects in the training group began the training protocol
in March 2015, while subjects in the control group maintained their normal daily activities.
The training group completed 12 weeks/3 months of training, ending in May 2015. Post-
training measurements were completed on all participating subjects in June 2015. Subjects
in the training and control groups were instructed to maintain their normal daily physical
37
activity and dietary habits external to the imposed testing and training of the study,
throughout the duration of the study.
4.2.2 Training Protocol
The training protocol was carried out in the gym of the Liikunta building at the University of
Jyväskylä. Resistance training was performed in the gym using commercial resistance
machines, cable and pulley systems and free weights (dumbbells).
Supervisors, who ensured that subjects were performing the session according to protocol,
as well as simultaneously monitoring their health and safety, attended training sessions prior
to the beginning of the training protocol. Supervisors also monitored exercise technique and
encouraged subjects to progressively overload during training. Before the training protocol
began, the subjects attended an information session explaining the essential principles and
fundamentals of resistance training, as well as the complete training protocol. Before each
training session, subjects completed a short warm-up protocol consisting of light aerobic
exercises and some added flexibility exercises. Each training session was designed to last
approximately 1 hour. Subjects were instructed to allow for at least 48 hours of rest between
training sessions.
The overall training program was broken down into 3 mesocycles (1 mesocycle = ~4 weeks).
Before each mesocycle, subjects were given written instructions on the details of the protocol.
Further, supervisors were knowledgeable of the protocol for each mesocycle so that they
were able to advise the subjects in the gym if questions arose. The details of the protocol for
a given mesocycle included: the aim of the protocol, the exercises to complete, the number
of repetitions and sets to complete, and the length of rest periods to observe. Subjects were
to follow the protocol meticulously, and to record their training information (i.e.
loads/resistances etc.) in personal training logs kept in a locked room at the gym. Supervisors
constantly monitored training logs to ensure primarily that the subjects were progressing
appropriately.
During each mesocycle, a pre-set range of repetitions (i.e. 16-20) was given to the subjects.
Subjects were instructed to determine the load where concentric failure would occur during
38
at least one set before they could complete all the reps in that range. Therefore, subjects were
expected to be continually increasing their loads used during a mesocycle.
During the 12-week (3 mesocycles) training period, the training group (n=79) performed
high-repetition, full-body resistance training twice a week (2x) with limited rest between sets,
focussing primarily on local muscular endurance. The complete details of the training
protocol are shown in Table 6.
TABLE 6 – The complete details of the training protocol. The letter describes the exercise
completed: M denotes machine, p denotes pulley/cable, d denotes dumbbells and bw denotes
body weight. The exercises listed per mesocycle were split into two separate training sessions.
Week Goal/Aim of
protocol
Exercises Repetitions
(#)
Sets
(#)
Rest Special
Instructions
1-4 Muscular endurance Leg press (m), leg/knee extension
(m), leg/knee flexion (m), chest
press (m), latissimus pull-down (m),
triceps pulldown/extension (p), sit-
ups (bw), back extension (m),
shoulder press (m), seated row (m),
biceps curls (p), sitting calf raises
(m) and abdomen curls (m)
16-20 2 1 minute N/A
5-8 Muscular
endurance/hypertrophy
Leg press, leg extension, leg flexion,
chest press, lat. pull-down, triceps
pulldown, sit-ups, back extension,
shoulder press, seated row, biceps
curls, sitting calf raises, abdomen
curls, shoulder raises (d) and
‘superman’ body raises (bw)
14-16 2-3 See
“Superset”
protocol
“Superset”
protocol: 2
exercises in
succession (30s
rest between),
2-4 mins rest
after each
superset
9-12 Muscular
endurance/hypertrophy
Leg press, leg extension, leg flexion,
chest press, lat. pull-down, triceps
pulldown, sit-ups, back extension,
shoulder press, seated row, biceps
curls, sitting calf raises, abdomen
curls, shoulder raises and
‘superman’ body raises
15 2-3 See
“Superset”
protocol
“Superset”
protocol: 2
exercises in
succession (no
rest between), 1
min rest after
each superset
39
The relatively low-load, high-repetition nature of the protocol was chosen due to the age and
untrained status of the subjects, so that unnecessary dropouts were avoided, and their health
and safety was ensured.
4.2.3 Control group
The control group (n=22) did not complete the training protocol. For the duration of the
training protocol, they were instructed to maintain their normal daily activities.
4.3 Data collection
All measurements were performed in the Viveca building at the University of Jyväskylä.
Prior to the beginning of the training protocol, baseline measurements (strength, body
composition, glucose tolerance, blood pressure and lipid profile) were performed on the study
sample. These same measurements were performed on the study sample following the 3
month training protocol. Due to scheduling conflicts, injury/illnesses and the use of
medication, the number of subjects measured was not equal across all tests. The explanation
behind the sample used for each test is described below in the relevant section.
4.3.1 Strength
Strength was assessed by a 1-repetition maximum (1RM) test. All subjects performed a
familiarization session for the 1RM test prior to baseline measurements. Each subject
completed a maximal dynamic horizontal 1RM test in the seated position using a David 210
dynamometer (David Sports Ltd., Helsinki, Finland). 1RM is the maximum load a subject
can lift concentrically for one repetition. Leg extension in the subjects began at a knee angle
of approximately 70° (68.4°±3.5). Subjects were instructed to hold the handles on the device
tightly, and ensure that their buttocks and back remained in constant contact with the seat
and backrest of the device throughout the test, and fully extend their legs (180°), without
locking the knees (Figure 4). Verbal encouragement was given to all subjects. Prior to the
start of the test, based on the 1RM results from the familiarization session, subjects performed
a warm-up protocol of 6 reps at 50% of their estimated 1RM, 4 reps at 70% of their estimated
1RM, 2 reps at 90% of their estimated 1RM and 1 rep at 95% of their estimated 1RM, with
1 minute rest between sets. Following the warm-up, the 1RM test began with 90 seconds rest
between attempts. The aim was to complete the test within five attempts. The greatest load
40
that the subjects could fully lift was recorded as their 1RM. Loads were increased or
decreased in increments of 1.25, 2.5, 5 or 10 kg. Baseline and post-training tests
measurements were performed at the same time of day (±2 hour) and with similar ambient
conditions.
One subject in the control group was excluded from the 1RM test due to a minor foot injury
he suffered prior to the post-training test. All other subjects performed the 1RM tests.
The 1RM test has been shown to be a valid way of assessing in vivo strength in both elderly
men and women, as well as being an accurate way of measuring changes in leg muscle
strength (Verdijk et al. 2009). Further, the 1RM test has a high level of repeatability
(Levinger et al. 2009). In a previous study conducted in the same laboratory with the same
dynamometer, the inter-day reliability values for the 1RM measurements were 0.981 and 3.1
% for ICC and CV, respectively (Walker et al. 2015).
FIGURE 4 – A subject demonstrating the positioning during a 1RM test.
41
4.3.2 Body Composition
Whole-body tissue composition was measured using Dual-energy X-ray absorptiometry
(DXA) (Lunar Prodigy Advance, GE Medical Systems, Madison, United States).
Measurements were performed in the morning (between 8:00 and 10:00) after a 12-hour fast.
Subjects were asked to remove any metal objects and remove any excess clothing, so that the
measurement was performed with minimal clothing (only shorts and/or undergarments).
They were positioned so that their spine was aligned with the longitudinal line running down
the middle of the bed. Their feet were secured with a footrest made out of Styrofoam and
their arms were placed beside their body with their palms facing in, with beanbags separating
the hands from the thighs and upper arms from the torso. Subjects were to lie still throughout
the duration of the scan. Each scan took approximately 6 minutes. For the post-training
measurements, the scan/image from baseline measurements was consulted to ensure that the
subjects were in the same position for both measurements.
Two subjects in the training group were excluded from the body composition tests due to
scheduling conflicts and minor illnesses. All other subjects performed all the body
composition tests.
Automatic analysis (Encore version 14.10.022) provided whole body fat mass and lean mass
(kg). Android fat mass (kg), as defined in the user manual (lower boundary at pelvis cut;
upper boundary above pelvis cut by 20% of the distance between pelvis and neck cuts; lateral
boundaries are the arm cuts) (Lunar User Manual 2010), was also provided automatically.
Studies have consistently shown that DXA is a valid and reliable method of assessing body
composition in subjects of all ages (Chen et al. 2007, Kaul et al. 2012, Glickman et al. 2004).
Further, a 2014 study showed that DXA (Lunar Prodigy) measures android fat precisely and
reliably (coefficient of variance = 1.6 %) in men and women aged 20-84 years old (Kaminsky
et al. 2014). In addition, DXA is sensitive to changes in fat in the abdominal region
(Glickman et al. 2004). In a previous study conducted in the same laboratory, the intraclass
correlation coefficient (ICC) for the body composition measures were 0.786–0.975
(Schumann et al. 2014).
42
4.3.3 Glucose tolerance, blood pressure and lipid profile
A qualified lab technician, using standard laboratory techniques, conducted the OGTT, blood
pressure measurements and blood sample collection needed for analysis of lipids (TC and
TG) and lipoproteins (HDL and LDL cholesterol). Measurements began between 8:00 and
8:30 in the morning, after the subjects had performed a 12-hour fast.
Blood pressure measurements were taken first, using an automated device (Omron M6W,
Omron Healthcare Co., Ltd. Hoofddorp, Netherlands). Two recordings were taken for each
subject, using the right arm. The lowest systolic and diastolic blood pressure reading of the
two recordings was used in the analysis to account for the white-coat effect. Blood pressure
measurements were also taken in all subjects during the medical screening sessions prior to
the beginning of the study. Therefore, the subjects were likely more comfortable with the
process of having their blood pressure taken during the actual tests, thus reducing the
magnitude of the white-coat effect.
Next, venous blood samples (~11 ml) were collected from the antecubital vein into tubes
(Vacuette Serum Gel Tube, Greiner Bio-One GmbH, Kremsmünster, Austria) using sterile
needles. Blood samples were centrifuged (Megafure 1.0 R Heraeus, DJB Lab Care,
Germany) at 3,500 rpm for 10 minutes after which serum was removed and stored at -20 °C
(for a maximum of 3 months) until analysis. Serum samples of glucose, lipids and
lipoproteins were analyzed with the Konelab 20 XTi -device (Thermo Electron Co, Vantaa,
Finland). Serum samples of insulin were analyzed with the Immulite 2000 XPi device
(Siemens Healthcare, Espoo, Finland). Subjects then ingested a 75 g glucose load
(GlucosePro, Comed Oy, Tampere, Finland).
Blood samples were taken 60 minutes (60-minute glucose and insulin) and 120 minutes
(120-minute glucose and insulin) after the ingestion of the glucose load, again using the same
protocol as at baseline (0-minute glucose and insulin).
Twelve subjects on medication (i.e. Type 2 Diabetes Mellitus medication) were removed
from the OGTT. Thirteen subjects on medication (i.e. beta-blockers) were excluded from the
blood pressure measurements. All subjects in the training group and control group were
included in the lipid profile test.
43
Inter-assay coefficients of variance were 0.9% for glucose, 5.9% for insulin, 7.7% for HDL,
3.7% for LDL, 5.2% for TC and 1.9% for TG. The analytical sensitivity for glucose was 0.03
mmol/l, 14 pmol/l for insulin, 0.1 mmol/l for HDL, 0.04 mmol/l for LDL, 0.02 mmol/l for
TC and 0.02 mmol/l for TG. The measurement ranges for glucose, insulin, LDL, HDL, TC
and TG were 0.3-120.0 mmol/l, 14-2165 pmol/l, 0.2-15 mmol/l, 0.09-11 mmol/l, 0.05-11
mmol/l and 0.05-11 mmol/l, respectively.
4.4 Statistical analysis
Statistical analysis was completed using IBM SPSS Statistics Version 21 software (SPSS
Inc., Chicago, IL, USA). Conventional statistical methods were used to determine mean and
standard deviation (SD) values. The normality of the data was tested using Shapiro-Wilk (n
< 50) and Kolmogorov-Smirnov (n ≥ 50) tests. If the distribution of a variable was not
normally distributed, it was modified using arithmetic transformations (Lg10, Ln and SQRT).
Repeated measures ANOVA (2 group x 2 time) was used to identify main effects and
interactions, for all variables. A paired-samples t-test and an independent-samples t-test were
used as post hoc tests. Within-group differences (pre-training (PRE) vs post-training (POST))
were analysed using a paired-samples t-test. Between-group differences (training group
versus control group) were analyzed using an independent-samples t-test.
In the case where a variable was not normally distributed after arithmetic transformation
(total-body lean mass), non-parametric tests were used. The Friedman test was used to test
for differences between the distributions of a variable. A Wilcoxon signed-rank test and an
independent-samples Mann-Whitney U test were used as post hoc tests; a Wilcoxon signed-
rank test to analyze within-group differences and an independent-samples Mann-Whitney U
to analyze between-group differences.
Pearson product-moment correlations were calculated between the percent change (%), the
delta change (∆) and baseline values (PRE) for each variables. The significance level for all
tests was set α = 0.05.
44
5 Results
5.1 Strength
Significant increases in 1RM were observed in the training group (pre-training: 110.4 ±34.6
vs. post-training: 123.8 ±36.5; p<0.001), but not in the control group (pre-training: 118.8
±29.1 vs. post-training: 121.2 ±29.8; p>0.05). The relative change in 1RM (%) over the study
period was significantly different between groups (Figure 5).
5.2 Body composition
The training group experienced increased total body lean mass (LM) (1.2% ±2.4, p<0.05),
as well as decreased total body fat mass (FM) (-2.5% ±5.5, p<0.05) and android fat mass
(AF) (-3.5% ±6.9, p<0.05). These changes were significantly greater than in the control
group (Figure 6). No significant changes were observed in the control group for any
variable.
FIGURE 5 – Change in 1RM (%) in the training and control groups. ***p<0.001 denotes a
significant difference between groups.
45
FIGURE 6 – The relative change (%) in fat mass, android fat and lean mass over the study period
in the training and control group. *p<0.05 denotes a significant difference between groups.
5.3 Glucose tolerance, blood pressure and lipid profile
Glucose tolerance. There was a main effect of time for 120-minute glucose (glucose_120)
(F(1, 87) = 4.4, p<0.05). Post hoc tests revealed a significant reduction in glucose_120 in the
training group, but not in the control group (Table 7). This change in the training group was
not significantly different in comparison to the control group. There were no other significant
changes in the training or control group for any of the measures from the OGTT.
Blood pressure. There was a significant main effect of time (F(1, 87) = 4.0, p<0.05) for SBP.
Post hoc tests revealed that there was a significant reduction in SBP in the training group, but
not in the control group (Table 8). This change in the training group was not significantly
different in comparison to the control group. There were no other changes in blood pressure
in the training or control groups.
46
TABLE 7 – OGTT results (mean ±standard deviation) for the training and control group.
*p<0.05 denotes a significant difference over time.
INT (n = 68) CON (n = 21)
PRE POST PRE POST
Glucose 0 min (mmol/L) 5.7 ±0.5 5.6 ±0.6 5.6 ±0.5 5.5 ±0.4
Glucose 60 min (mmol/L) 8.4 ±2.3 8.3 ±2.4 8.8 ±2.7 9.1 ±1.7
Glucose 120 min (mmol/L) 7.1 ±1.7 6.6 ±1.8* 7.2 ±2.6 6.7 ±1.6
Insulin 0 min (pmol/L) 57.0 ±45.1 56.2 ±54.2 41.6 ±28.6 39.5 ±27.5
Insulin 60 min (pmol/L) 402.3 ±273.8 385.1 ±224.6 344.0 ±28.6 353.7 ±167.4
Insulin 120 min (pmol/L) 373.6 ±243.1 346.0 ±178.3 311.3 ±186.3 331.2 ±176.7
TABLE 8 – Blood pressure (mean ±standard deviation) for the training and control group.
*p<0.05 denotes a significant difference over time.
Lipid profile. There was a significant interaction between group and time for LDL (F(1, 99)
= 4.9, p<0.05). Post hoc tests revealed a significant reduction in LDL in the control group
(Table 9), which was significantly greater than in the training group (-6.1% ±11.0 vs 3.5%
±21.1, p<0.05; respectively).
There was a main effect of time for TC (F(1, 99) = 16.4, p<0.001) and HDL (F(1,99) = 4.0,
p<0.05). Post hoc tests revealed a significant reduction in TC in the training and control
groups (Table 9). These changes were not different between groups (-4.1% ±11.8 vs -5.1%
±10; p>0.05). In addition, there was a significant reduction in HDL in the training group,
but this change was not significantly different from the control group (-5.6% ±14.2 vs 1.5%
± 25.5, p>0.05; respectively).
GROUP
SBP (mm/Hg) DBP (mm/Hg)
PRE POST PRE POST
INT (n = 68) 153.5 ±20.5 148.1 ±20.7* 80.4 ±9.1 79.4 ±10.9
CON (n = 20) 145.9 ±20.6 142.8 ±16.5 79.1 ±10.4 78.1 ±12.1
47
There was a main effect of group for HDL (F(1, 99) = 4.9, p<0.05) and TG (F(1, 99) = 8.9,
p<0.01). Post hoc tests revealed that post-training HDL was significantly greater in the
control group compared to the training group, and pre-training and post-training TG were
significantly greater in the training group compared to the control group (Table 9).
TABLE 9 – Lipid profile (mean ±standard deviation) for the training and control group. *p<0.05,
**p<0.01 and ***p<0.001 denote significant differences over time. +
p<0.05 denotes a significant
difference between groups.
GROUP Total
cholesterol
(mmol/L)
HDL
cholesterol
(mmol/L)
LDL
cholesterol
(mmol/L)
Triglycerides
(mmol/L)
PRE POST PRE POST PRE POST PRE POST
INT
(n = 79)
5.7
±1.1
5.4**
±1.0
1.7
±0.5
1.6 ***
±0.4
3.7
±0.9
3.7
±0.9
1.4
±0.7
1.4
±0.7
CON
(n = 22)
5.8
±1.1
5.5*
±0.9
1.8
±0.4
1.8+
±0.4
3.6
±0.9
3.4*
±0.8
1.1+
±0.4
1.0+
±0.7
5.4 Correlations
There was a significant, inverse correlation between PRE 1RM and 1RM change (%) (r = -
0.585, p<0.001), PRE SBP and SBP change (%) (r = -0.439, p<0.001) (Figure 7), PRE
glucose_120 and glucose_120 change (%) (r = -0.367, p<0.01) and PRE SBP and
glucose_120 change (%) (r = -0.330, p<0.05).
A significant, positive correlation between FM change (∆) and insulin_120 change (∆) (r =
0.340, p<0.01) (Figure 8) and AF change (∆) and insulin_120 change (∆) (r = 0.335,
p<0.01) was found. In addition, there was a significant, positive correlation between FM
change (%) and DBP change (∆) (r = 0.349, p<0.01) and AF change (%) and DBP change
(∆) (r = 0.272, p<0.05).
48
FIGURE 7 – Inverse correlation between PRE SBP and SBP change (%).
FIGURE 8 – Positive correlation between FM change (∆) and insulin_120 change (∆).
49
There was a significant, positive correlation between PRE glucose_0 and PRE FM (r = 0.361,
p<0.01), PRE glucose_0 and PRE AF (Figure 9) (r = 0.533, p<0.001), PRE glucose_0 and
PRE SBP (r = 0.324, p<0.01) and PRE insulin_0 and PRE AF (r = 0.422, p<0.001).
FIGURE 9 - Positive correlation between PRE glucose_0 and PRE AF.
50
6 Discussion
Lower-body strength improved by ~12% in the training group – a significant increase in
comparison to the control group (~2%). This finding confirms the study hypothesis,
demonstrating that RT is effective in improving strength, even in elderly populations lifting
relatively light loads. There was a significant, inverse relationship (r = -0.585, p<0.001)
between 1RM strength at baseline and the change in 1RM strength (%), suggesting that the
subjects who were least strong prior to the study experienced the greatest increase in strength.
The increase in strength seen presently is comparable to improvements reported in the
literature. For instance, Cononie et al. (1991) reported that 12 weeks of RT (one set of 8-12
reps) performed 3 times a week increased strength by 12% in subjects aged 70-79 years old.
Galvao et al. (2005) described a spectrum of strength improvements, ranging from
approximately 6 - 25 % (depending on the exercise) following 20 weeks of RT performed 3
times a week in elderly women, although the increase in strength reported for the leg press
exercise was 14%. Notably, there are studies that have reported improvements in strength of
larger magnitude. For instance, Ryan et al. (2001) described a ~18% and ~28% increase in
leg press strength in older men and women, respectively. However, the RT protocol used
higher resistances (10RM for lower body exercises) and was considerably longer in duration
(24 weeks) than the present protocol, which may explain the discrepancy in strength gains.
Strength is strongly associated with functional capacity and independence in the elderly
(Galvao & Taaffe 2005, DiFrancisco-Donoghue et al. 2007). Therefore, the increase in
muscular strength in the training group likely had a profound effect on the day-to-day living
and overall quality of life of these subjects, although functional capacity was not directly
measured in the present study.
Strength may also be related to the occurrence and prevalence of chronic disease. Evidence
from cross-sectional studies reveal that poor muscle strength is associated with higher
prevalences of cardiovascular risk factors and type 2 diabetes (Park et al. 2006, Fahs et al.
2010). This may simply be an indirect relationship however, related to the physical inactivity
associated with those with chronic disease (i.e. an individual on bed rest), rather than a causal
relationship.
51
The ~2% increase in strength in the control group is likely attributable to a learning effect.
While there was a familiarization session designed to introduce subjects to the 1RM test and
develop their technique, improvements in technique may still have occurred from the PRE
1RM test to POST 1RM test. Alternatively, it may also be related to a change in
psychological state. It is plausible that subjects felt more nervous during the PRE 1RM test
than POST 1RM test, as they were less familiar with the test, the testers and the testing
environment.
There was a ~1.2% (~0.7 kg) increase in LM in the training group, accompanied by a ~2.5%
(~0.6 kg) reduction in FM and a ~3.5% (~0.1 kg) reduction in AF – all of which were
significant in comparison to the control group. This finding suggests that RT is effective in
improving body composition, even in elderly populations.
The improvements in body composition found presently are comparable to those reported in
the literature. For instance, Schmitz et al. (2003) reported a significant increase in LM and a
significant decrease in FM following 15 weeks of RT performed 2 times a week. Both these
improvements in LM and FM were under 1 kg in terms of the magnitude of change, which
is similar to what was reported currently. Campbell et al. (1994) found improvements in LM
and FM following RT (+1.4 kg and -1.8 kg, respectively) that more than double the
improvements reported currently, although the RT protocol used by Campbell et al. (1994)
was longer in duration and higher in frequency than the one used presently. Additionally, the
RT protocol was combined with dietary controls (diet that provided 0.8 or 1.6 g of protein
per kg/day and adequate total energy to maintain baseline body weight) that may have
emphasized the changes in body composition. Treuth et al. (1995) reported a 7.1% decrease
in abdominal fat following RT that doubles the decrease seen presently (~3.5%). The fact
that the RT protocol used by Treuth et al. (1995) had double the amount of training sessions
as the present protocol (48 vs 24 sessions, respectively) may explain the discrepancy in the
magnitude of abdominal fat reduction. It was noted in the literature review that all studies
reporting a reduction in abdominal fat in the elderly following RT used protocols that were
16 weeks in length or longer. It appears that this is the first study to reveal a reduction in
abdominal fat in the elderly following RT, using a protocol lasting less than 16 weeks.
52
Skeletal muscle appears to play an important role in the development of chronic disease.
Skeletal muscle is a primary target for the disposal of triglycerides and glucose, and is an
important component of RMR. Research suggests that maintaining a large, active muscle
mass improves cardiometabolic risk factors, such as insulin resistance, obesity and
hypertension (Strasser & Schobersberger 2011). The loss of skeletal muscle associated with
aging put the elderly at increased risk of developing the metabolic syndrome and chronic
disease. The significant increase in LM found presently confirms the study hypothesis, and
suggests that RT can not only slow sarcopenia, but also reverse it, at least temporarily (over
a 12-week period). The implications of this finding, in regards to the metabolic syndrome
and chronic disease, are considerable, as discussed.
As obesity is a powerful independent risk factor for the metabolic syndrome and chronic
disease, and the prevalence of obesity is increasing globally, especially among the elderly,
any method or treatment that reduces fat is worth consideration. In particular, it is visceral
fat that is most linked to insulin resistance, the metabolic syndrome, cardiovascular disease,
and type 2 diabetes (Bechtold et al. 2006). AF represents fat in the abdominal region and has
been shown to be a legitimate surrogate measure of visceral fat (Miazgowski et al. 2014).
Presently, reductions in both FM and AF were reported in the training group, suggesting that
RT may be a viable method of preventing and/or treating obesity in elderly populations – a
finding of considerable importance when considering the metabolic syndrome and chronic
disease.
It is possible that the improvements in FM and AF are not attributable to RT alone. Subjects
in both the training and control groups were instructed to maintain their normal dietary habits,
although this was not directly controlled or monitored. Therefore, it may be that the
reductions in FM and AF were influenced by dietary changes. However, the fact that the
reduction in FM and AF was accompanied by an increase in LM suggests otherwise. Calorie
restrictions diets can be effective in inducing weight loss; however, they are typically
associated with losses in LM (Tresierras & Balady 2009). Evidence from the literature has
shown that LM can be preserved when calorie restriction diets are combined with RT (Ross
& Rissanen 1994, Ross et al. 1996, Rice et al. 1999). However, it is unlikely for LM to be
significantly increased in a state of calorie restriction. There was a significant increase in LM
53
in the present study, suggesting that improvements in FM and AF were not related to dietary
changes, but rather, the imposed intervention.
There was a significant reduction in 120-minute glucose (~0.5 mmol/L; ~5%) in the training
group. There were no other significant changes in regards to the OGTT in either group.
The reduction in 120-minute glucose seen presently following RT is comparable to other
reductions reported in the literature. For example, Miller et al. (1994) reported a similar
reduction in 120-minute glucose (~0.3 mmol/L) after 16 weeks of RT that did not reach
significance, although this may have been related to the size of the study sample (11 subjects).
Smutok et al. (1994) found a large reduction in 120-minute glucose (1.4 mmol/L) that more
than doubles the current reduction, although their study employed a longer duration (20
weeks) and higher frequency (3 times a week) of training.
Despite the improvement in glucose concentration at 120 minutes of the OGTT, RT did not
appear to have a comprehensive effect on glucose tolerance. As there is a large body of
evidence suggesting that RT improves glucose tolerance and insulin sensitivity, the lack of a
comprehensive change in the OGTT is likely related to characteristics specific to the present
study, rather than providing new evidence suggesting that RT has little effect on glucose
tolerance.
The lack of a comprehensive change in glucose tolerance may be related to the length of the
RT protocol used. Snowling & Hopkins (2006) noted in their meta-analysis that RT resulted
in significant improvements in glucose tolerance only when protocols lasted 12 weeks or
longer. As the present RT protocol was only 12 weeks in length, it seems plausible that a
longer lasting protocol would have resulted in more pronounced improvements in glucose
tolerance.
The lack of an extensive change in glucose tolerance may also be associated with the
heterogeneity of the study sample used presently. There was a significant, inverse correlation
between 120-minute glucose at baseline and the change (%) in 120-minute glucose (r = -
0.367, p<0.01), suggesting that subjects with impaired glucose tolerance at baseline
experienced the greatest improvements in glucose tolerance. It is possible that if the current
study had only investigated subjects with impaired glucose tolerance (or diabetics), the
54
resulting improvements would have been more distinct and comprehensive. When only
examining the subjects in the training group with “impaired glucose tolerance” or worse
(≥7.8 mmol/L – see Table 1) at 120 minutes of the OGTT at baseline (21 subjects), the
resulting improvement in glucose tolerance of these subjects following RT is of greater
magnitude (pre-training: 9.3 ±1.0 mmol/L vs. post-training: 8.2 ±1.9 mmol/L; -11.3%
±19.8) than when considering the whole training group together (pre-training: 7.1 ±1.7
mmol/L vs. post-training: 6.6 ±1.8 mmol/L; -4.9% ±21.5), supporting the proposition that
more comprehensive changes in glucose tolerance would have been apparent if all subjects
had impaired glucose tolerance at baseline.
While there were no significant changes in insulin concentrations during the OGTT, this does
not necessarily imply that there were no changes in insulin sensitivity following RT in the
training group. After the training intervention, subjects in the training group were able to
clear significantly more glucose from the blood into insulin-dependent cells, while using the
same amount of insulin as before the training intervention. This finding may be explained by
an increase in insulin sensitivity in the training group, but as the hyperinsulinemic-
euglycemic clamp technique is the only method of assessing insulin sensitivity directly, it
remains open to interpretation.
At the very least, there appears to be a trend of improved glucose tolerance in the training
group, suggesting that RT may be a viable method of improving glucose tolerance in elderly
individuals, and supporting the conclusions of a large volume of literature. This finding is of
considerable importance, when considering the development of the metabolic syndrome and
chronic disease.
There was a significant improvement in SBP (~3%) in the training group, while there were
no other changes in BP in either group. The ~5.5 mmHg reduction in SBP in the training
group suggests that RT may be a viable method of improving BP in the elderly – which is of
considerable importance in terms of the metabolic syndrome and development of chronic
disease.
Two meta-analyses, from 2000 and 2005, reported an average reduction in SBP of 3mmHg
and 3.2 mmHg, respectively, following RT (Kelley & Kelley 2000, Cornelissen & Fagard
2005). Therefore, the reduction in SBP reported presently nearly doubles the reduction
55
reported in these meta-analyses. The meta-analysis of Strasser et al. (2010) however, reported
a 6.2 mmHg reduction in SBP (based on eight trials), which better resembles the present
reduction.
These discrepancies in SBP reduction may be related to RT protocol variables or subject
characteristics, or both. For example, Strasser et al. (2010) identified a possible relationship
between RT volume and improvements in BP – they noted that RT protocols with higher
volumes (which they defined as ≥9 sets per muscle group per week) resulted in the most
effective reductions in SBP. While the RT protocol used presently does not meet the criteria
for this definition of “high-volume”, due to its high-repetition nature, it approaches the likes
of a “high-volume” protocol, and would certainly not qualify as “low-volume”. This may
explain the larger magnitude of the SBP reduction reported currently in comparison to the
meta-analyses of Kelley & Kelley (2000) and Cornelissen & Fagard (2005), which included
studies that used true “low-volume” RT protocols (i.e. 1 rep per set, 1 set per exercise).
Another explanation lies in the heterogeneity and baseline blood pressure of participating
subjects. There was a significant, inverse correlation between SBP at baseline and the change
(%) in SBP (r = -0.439, p<0.001), suggesting that those with high SBP at baseline
experienced the greatest improvements in blood pressure. When only examining the subjects
in the training group with stage 2 hypertension or worse (≥ 160 mmHg) at baseline (25
subjects), the resulting improvement in SBP of these subjects following RT is of greater
magnitude (pre-training: 173.9 ±12.4 mmHg vs. post-training: 159.1 ±18.1 mmHg; -8.9%
±7.3) than when considering the whole training group together (pre-training: 153.5 ±20.5
mmHg vs. post-training: 148.1 ±20.7 mmHg; -2.6% ±11.2), supporting the hypothesis that
the reduction in SBP would have been larger if only subjects with hypertension had been
investigated. Further research is needed here however, as it has been noted that there is
limited research examining the effects of RT on subjects with hypertension alone (Strasser
et al 2010).
The meta-analysis of Kelley and Kelley (2000) and Cornelissen & Fagard (2005) also
reported improvements in DBP following RT. There were no significant reductions in DBP
in the present study. The explanation for this finding is unclear, although genetics may play
a role; in an unpublished study described in Hurley et al. (2011), older men and women with
56
a specific genotype within their angiotensin II type 1 receptor and angiotensionogen gene
experienced the greatest reduction in BP after RT, in comparison with those with other
genotypes at this loci.
There may be a relationship between RT frequency and improvements in BP (Strasser et al.
2010). The authors noted that higher frequency protocols (3 times a week versus 2 or less)
resulted in the most effective reductions in BP. Although high-frequency RT protocols may
be better suited for improving BP, the present study reported improvements in SBP after RT
performed only 2 times a week – a relatively low frequency of RT when considering the
majority of literature on the subject. However, it is possible that if a higher frequency protocol
had been used, there would have been a significant reduction in DBP accompanying the
reduction in SBP.
The lack of a significant change in DBP in the present study may also be related to the
baseline values of DBP in the training group. The average DBP in the training group was
~80 mmHg at baseline, which is on border between the “normal” classification and the
“prehypertension” classification, according to the JNC7 (Table 3) (The Seventh Report of
the Joint National Committee on Prevention, Detection, Evaluation, and Treatment of High
Blood Pressure 2004). It is possible that significant reductions in DBP would have occurred
if subjects were on average, pre-hypertensive or hypertensive at baseline, in terms of DBP.
The question remains unclear however, as reductions in DBP have been reported after RT in
normotensive subjects (Tsutsumi et al. 1997)
The more recent meta-analysis of Strasser et al. (2010) concluded that RT has a positive
influence on SBP, but not DBP; their analysis of 13 RCTs revealed no statistically significant
effect of RT on DBP. The results of the present study support the results of this meta-analysis
and suggest that RT may have little effect on DBP.
The results of the lipid profile were unexpected. There was a reduction in HDL (~5%) in the
training group, and a reduction in LDL (~6%) in the control group. Both groups experienced
reductions in TC, and there were no significant changes in TG.
HDL was significantly reduced in the training group and LDL was significantly reduced in
the control group. These reductions in HDL and LDL presumably explain the reductions in
57
TC in their respective groups. The difference in TG pre-training and post-training between
groups is presumably related to the total fat content of the subjects in either group. At both
pre-training and post-training, the intervention group had a higher total amount of fat than
the control group (pre-training: 28.2 ±8.4 kg vs. 22.8 ±6.3 kg, p<0.01; post-training: 27.6
±8.5 kg vs. 22.0 ±6.1 kg, p<0.05; respectively). Therefore, although there were no significant
changes in TG in either group, total fat mass likely explains why the training group had
significantly higher TG levels pre-training and post-training, compared to the control group.
Based on the present results, it appears that RT does not positively influence the lipid profile,
suggesting that RT may not be a viable method of improving this risk for the metabolic
syndrome. In comparison to the control group, RT appeared to have a detrimental effect on
the lipid profile (training group: reduced HDL, no change in LDL; control group: no change
in HDL, reduced LDL). While these findings are somewhat unexpected, out of all the risk
factors for the metabolic syndrome, the effect of RT on the lipid profile is the most
controversial. For instance, the conclusion of three independent meta-analyses has been that
RT does not improve the lipid profile in a significant manner (Hurley 1989, Braith & Stewart
2006, Strasser et al. 2010). Therefore, the present results still support a large body of evidence
demonstrating that RT does not improve the lipid profile. Nevertheless, there is also a body
of evidence that shows the opposite is true (Kelley & Kelley 2009, Mann et al. 2014). It is
unclear whether the lack of improvement in the lipid profile seen presently was because RT
has truly little influence on the lipid profile, or because there were other factors present.
One factor that may have influenced the results is the influence of diet. Evidently, diet and
dietary changes can affect lipid and lipoprotein levels. Certain diets (i.e. low fat) have been
shown to improve the lipid profile (Huang et al. 2011). Although all subjects were instructed
to maintain their normal dietary habits, this was not specifically controlled (i.e. with prepared
meals, meal plans etc.). It is possible that the dietary habits of the training and/or control
group changed during the study, affecting the response of the lipid profile.
Research has shown that there is a considerable seasonal variation in blood lipid levels,
namely where cholesterol levels (TC, HDL and LDL) are higher in the fall and winter, and
lower in the spring and summer (Ockene et al. 2004). Importantly, it appears that this effect
is most striking in regions with extreme climatic variations, including Finland (Keys et al.
58
1958). This seasonal variation may partially explain the reduction in HDL cholesterol in the
training group and the reduction in LDL cholesterol in the control group, as baseline
measurements were taking in the winter and post-training measurements were taken in the
spring/early summer. However, as there was no corresponding reductions in HDL cholesterol
in the control group or in LDL cholesterol in the training group, it is clear that this does not
fully account for the unexpected lipid profile results found presently.
Another factor to consider is the length and frequency of the RT protocol used in this study.
As discussed, the vast majority of studies investigating the effects of RT on cardiometabolic
risk factors use long lasting (≥16 weeks), high-frequency (≥3 times a week) RT protocols.
One study using a short duration (8 weeks) and low frequency (2 times a week) protocol
revealed that RT (16 sessions; 6-10 RM) did not alter lipid levels in young healthy males
(Staron et al. 2000). There may be a minimum amount of RT needed to improve the lipid
profile that was not reached in that of Staron et al. (2000), or in the current study. Further
research is needed here.
It has been suggested that there is a relationship between RT volume and improvements in
the lipid profile (Strasser et al. 2010). This meta-analysis found that high-volume, low-
intensity protocols appeared to best suited to induce improvements in HDL. As a moderately
high-volume, low-intensity protocol was used presently, and there were no significant
improvements in HDL, this hypothesis cannot be confirmed. Strasser et al. (2010) also noted
a possible relationship between RT frequency and improvements in the lipid profile – they
identified a study that found that improvements in LDL and TG were emphasized when
subjects performed RT 2 times a week, rather than 3 (Honkola et al. 1997). Again, as the
current protocol used a 2 times a week frequency, and no improvements in LDL or TG were
found, this relationship cannot be confirmed.
Clinical significance. The present study reported numerous significant changes following
RT, including improvements in body composition, glucose tolerance and blood pressure, all
of which play a primary role in the metabolic syndrome. However, it is important to ask
whether these changes were meaningful, or in other words, did RT lead to clinically
significant improvements?
59
An approximately 12% increase in strength was found following RT. This finding appears to
be clinically significant when considering the loss of strength associated with aging.
Evidence indicates that maximum strength declines at a rate of approximately 5% per decade,
from the age of 45 years old onwards (Aoyagi & Shephard 1992). Therefore, the increase in
strength reported presently represents an offset of more than 2 decades of aging.
Changes in body composition also appear to be clinically significant. In a similar manner to
strength, aging is associated with losses in LM. Evidence suggests that from the 5th
decade
onwards, sarcopenia occurs at a rate of approximately 0.5 kg/year (Strasser & Schobersberger
2011). Thus, the ~0.6 kg increase in LM reported presently represents a counteraction of
more than a year of aging.
The only change in the OGTT following RT was a reduction in 120-minute glucose.
However, 120-minute glucose appears to be the most clinically significant component of an
OGTT. For instance, a study investigating the use of the OGTT as an indicator of mortality
found that only higher 120-minute glucose was a significant independent risk factor for
mortality (Metter et al. 2008). In addition, 120-minute OGTT hyperglycemia has been
reported to be an independent risk factor for cardiovascular disease CVD (Meigs et al. 2002).
Further, according to the cut-offs defined by the WHO (Table 1), the reduction in 120-minute
glucose appears to be clinically significant. Pre-training, in the training group, there were two
subjects classified as “diabetic” (≥11.1 mmol/L) and 19 classified as having “impaired
glucose tolerance” (7.8-11.1 mmol/L). Post-training, there was only one subject classified as
“diabetic” and 10 subjects classified as having “impaired glucose tolerance”. Caution must
be taken when interpreting this result as the WHO bases their cut-offs on plasma samples of
glucose, and serum samples were used in the present study. A 2012 study reported that there
is a difference in glucose concentrations when taken from a plasma sample versus a serum
sample, although the reported difference is small (plasma glucose values were on average
1.15% higher than plasma serum samples) (Frank et al. 2012).
The only improvement in BP following RT was a reduction in SBP. However, this reduction
appears to be clinically significant. Firstly, research shows that SBP is a stronger predictor
of cardiovascular events than DBP (Mourad 2008). In addition, small reductions in SBP are
associated with significant improvements in health outcomes; a 3 mmHg reduction in SBP is
60
estimated to decrease the risk of cardiac morbidity by 5 - 9%, stroke by 8 - 14% and all-cause
mortality by ~4% (Whelton et al. 2002). There was a ~5.5 mmHg mean reduction in SBP
following RT seen presently. Furthermore, when using the cut-off for stage 2 hypertension
(≥ 160 mmHg) as defined by the JNC7 (Table 3), there were 25 subjects with stage 2
hypertension in the training group pre-training, and only 15 subjects with stage 2
hypertension post-training.
Although there were no significant changes in DBP in the training group, there was a small,
non-significant reduction that took the mean DBP of the training group from the “pre-
hypertension” classification to the “normal” classification (pre-training: 80.4 ±9.1 mmHg
vs. post-training: 79.4 ±10.9; p>0.05), as defined by the JNC7 (Table 3).
Finally, although there were no improvements in the lipid profile following RT, the results
suggest that this lack of improvement was not particularly clinically significant. For instance,
in the training group pre-training, the average HDL concentration was ~1.7 mmol/L, which
falls into the “high/optimal” classification according to the NCEP ATP-III (Table 2). While
there was a significant reduction in HDL in the training group following RT, the mean HDL
concentration in the training group (~1.6 mmol/L) was still in this “high/optimal”
classification post-training, which is associated with a less than average risk of heart disease.
Similarly, although there was a small, non-significant increase in TG in the training group,
at both pre-training and post-training, the mean TG concentration in the training group was
in the “normal/optimal” category. There was also a non-significant increase in LDL in the
training group, but at both pre-training and post-training, the mean LDL concentration in the
training group was in the “borderline high” category.
Although RT did not appear to result in comprehensive changes in all the risk factors for the
metabolic syndrome, it appears that improvements that did occur were clinically significant.
The results of the present study strongly support the meta-analysis of Strasser et al. (2010),
which concluded that RT has a statistically and clinically significant effect on risk factors for
the metabolic syndrome including abdominal obesity, glucose tolerance and SBP, but not
DBP and the lipid profile.
Mechanisms. One of the secondary aims of this study was to investigate the mechanisms
underlying improvements in cardiometabolic risk factors following RT. While RT did appear
61
to improve risk factors for the metabolic syndrome, the physiological mechanisms underlying
these changes remain unclear and complex.
When investigating relationships between variables at baseline, an association between fat
(total FM and AF) and risk factors for the metabolic syndrome emerged. For instance, there
was a significant, positive correlation between PRE glucose_0 and PRE AF (r = 0.533,
p<0.001), PRE insulin_0 and PRE AF (r = 0.422, p<0.001) and PRE glucose_0 and PRE FM
(r = 0.361, p<0.01). These findings suggest that fat, especially abdominal fat, is central to the
development of glucose intolerance, insulin resistance and the metabolic syndrome,
substantiating the common hypothesis described in the literature (Byrne & Wild 2011).
Changes in fat (total FM and AF) also appeared to be related to improvements in
cardiometabolic risk factors following RT. For example, there was a significant, positive
correlation between FM change (∆) and insulin_120 change (∆) (r = 0.340, p<0.01) and AF
change (∆) and insulin_120 change (∆) (r = 0.335, p<0.01). There was also a significant,
positive correlation between FM change (%) and DBP change (∆) (r = 0.349, p<0.01) and
AF change (%) and DBP change (∆) (r = 0.272, p<0.05). These findings suggest that
reductions in fat may have been related to improvements in risk factors for the metabolic
syndrome. These associations do not imply causation, and due to the relative weakness of the
correlations, it is clear that there are other factors present. However, the findings do
emphasize the role that fat and obesity play in the development of the metabolic syndrome,
and suggest that reductions in fat may be related to improvements in risk factors for the
metabolic syndrome. More research is needed to investigate the specific physiological
mechanisms by which changes in fat content influence cardiometabolic risk factors.
There were no significant correlations between changes in strength or LM, and risk factors
for the metabolic syndrome, suggesting that changes in strength and LM may not have been
related to these improvements in risk factors. However, the importance of strength and lean
mass, in terms of the overall health of elderly populations, cannot be overlooked, as
discussed.
Changes in muscle quality, inflammatory biomarkers and adipocytokines have also been
proposed as possible mechanisms. It is believed that adipocytokine dysregulation is the key
link between abdominal obesity and the development of insulin resistance and the metabolic
62
syndrome (Byrne & Wild 2011). It is possible that the currently reported reductions in
abdominal fat caused changes in adipocytokine levels (i.e. increases in adiponectin and
decreases in leptin and resistin), that resulted in increases in systemic insulin sensitivity.
However, as adipocytokine levels were not measured in the current study, this remains
unclear. Muscle quality and inflammatory biomarkers were not assessed either.
Dose-response relationship. Another of the secondary aims of this study was to consider the
results in terms of the dose-response relationship. It is important to consider how much RT
is needed (in terms of the length, frequency, volume and duration of RT) to generate
meaningful improvements in cardiometabolic risk factors. This point is especially important,
as a lack of time is a major barrier to physical activity participation among the elderly (Chao
et al. 2000). Knowing the minimum dose of RT needed to have a health promoting effect in
regards to the metabolic syndrome is critical when considering exercise prescription.
The vast majority of studies investigating the effects of RT on risk factors for the metabolic
syndrome use RT protocols lasting 16 weeks or more in length (Brooks et al. 2006, Castaneda
et al. 2002, Cauza et al. 2005, Sigal et al. 2007, Smutok et al. 1993, Cheung et al. 2009,
Reynolds et al. 2004, Ryan et al. 2001, Pratley et al. 1994, Hunter et al. 2002, Schmitz et al.
2003, Treuth et al. 1994, Treuth et al. 1995, Balducci et al. 2004, Dunstan et al. 2002, LeMura
et al. 2000, Kokkinos et al. 1991, Honkola et al. 1997, Cononie et al. 1991, Martel et al.
1999). Those using shorter lasting protocols typically use RT frequencies of 3 times a week
or more (Baldi & Snowling 2003, Ishii et al. 1998, Bweir et al. 2009, Miller et al. 1984,
Geirsdottir et al. 2012, Klimcakova et al. 2006, Campbell et al. 1994, Kwon et al. 2010,
Manning et al. 1991, Fahlman et al. 2002, Misra et al. 2008, Harris & Holly 1987). Overall,
in the literature, the total number of RT sessions per study ranges from approximately 27-
156 sessions, with the average being ~48 sessions.
There appears to be only one study investigating the effects of short-term (<16 weeks), low
frequency (<3 times a week) RT alone on risk factors for the metabolic syndrome (Staron et
al. 2000). This study reported that 16 sessions of high-intensity RT (3 sets of 6-10RM to
failure) did not alter lipid levels in young, healthy men.
Therefore, to the author’s knowledge, this is the first study to report improvements in risk
factors for the metabolic syndrome in elderly men and women following short-term (<16
63
weeks), low frequency (<3 times a week) RT. Importantly, these improvements occurred
after a total of only 24 training sessions – which is half the number typically used in the
literature – demonstrating that low doses of RT can improve risk factors for the metabolic
syndrome in the elderly in a meaningful way.
Practical applications. The results of the present study have important practical implications,
in terms of exercise participation and prescription.
Above all, they suggest that RT is a viable method of preventing and treating chronic disease
in the elderly. As a lack of time is the most commonly cited barrier to physical activity and
exercise (Sallis JF 1999), the low-dosage nature of the present RT protocol will likely be
attractive to older adults and the elderly. In addition, the low-intensity nature of the protocol
also make it reasonable for this population. It is realistic to think many elderly individuals
could incorporate a RT protocol like this one into their everyday life, without too much
difficulty (only two hours of training per week).
A theme that was identified consistently in the results was the relationship between baseline
levels of variables and the change in these variables (PRE 1RM and 1RM change, r = -0.585,
p<0.001; PRE SBP and SBP change, r = -0.439, p<0.001; PRE glucose_120 and glucose_120
change, r = -0.367, p<0.01 and PRE SBP and glucose_120 change, r = -0.330, p<0.05). This
trend clearly has practical implications, and suggests that subjects in the present study that
were most unhealthy at baseline benefited most from intervention used. It is possible that
these results can be used to motivate sedentary, unhealthy individuals, demonstrating the
positive impact of small amounts of RT.
Overall, RT should be seen as a viable alternative, or supplement, to aerobic exercise, as a
health-promoting tool to help prevent and treat chronic disease. It is important to note
however that if the aim of an exercise intervention is to improve the lipid profile and/or DBP,
the present findings suggest that RT may not be best suited to achieve these goals.
Limitations. A limitation of the current study was that the training group was larger in size
than the control group. This study was part of a larger project and the mismatch between the
size of the training group and control group was to satisfy the future needs of the project.
64
Two groups of the same size would have allowed for better comparison and analysis of the
results.
Another limitation of the study was related to the role of diet. Although all subjects were
instructed to maintain their normal dietary habits, this was not specifically controlled (i.e.
prepared meals, meal plans etc.). Dietary changes in either group throughout the study may
have confounded the results and influenced the measured cardiometabolic risk factors.
The gold standard of assessing insulin resistance is the hyperinsulinemic-euglycemic clamp
method. This method is superior to an OGTT in assessing insulin resistance and would have
led to a better understanding of what changes occurred in insulin following RT. However, it
is not typically used in the clinical setting due to complexity and possible dangers. Similarly,
a CT scan is the gold standard of assessing body composition, as it can differentiate between
subcutaneous and visceral fat. This would have allowed for a better understanding of what
occurred following RT in terms of abdominal adipose tissue.
To investigate the underlying physiological mechanisms at play, a muscle biopsy would have
provided important information regarding changes in muscle quality (i.e. changes in muscle
fiber types, enzyme levels, protein concentrations etc.). Similarly, measuring inflammatory
biomarker and adipocytokine levels may also have also provided insight into the
physiological response to RT. None of these factors were measured presently.
65
7 Conclusion
This study demonstrates that RT can have a positive effect on the overall health of elderly
individuals. Further, the results suggest that RT can be used to improve risk factors for the
metabolic syndrome in the elderly, namely reducing abdominal fat and systolic blood
pressure while increasing glucose tolerance. Importantly, it appears that these improvements
in cardiometabolic risk factors were clinically significant. It is unclear whether RT has a
beneficial effect on DBP and the lipid profile – the present results suggest that it does not.
The physiological mechanisms underlying improvements in the metabolic syndrome
following RT have not been fully elucidated and remain complex. However, the results of
this study emphasize the role of fat and obesity in both the development and the
treatment/prevention of the metabolic syndrome
The majority of studies in the literature use relatively long lasting, high-frequency protocols
(~48 total training sessions) to investigate the effects of RT on cardiometabolic risk factors.
The present study appears to be the first to show improvements in risk factors for the
metabolic syndrome in the elderly following a short-term RT protocol with only 24 total
training sessions.
The present study should be considered when prescribing exercise for the elderly. The results
suggest that small doses of RT can have a significant, health-promoting effect – an important
point when considering that a lack of time is a major barrier to exercise participation. As the
results suggest that elderly individuals who are unhealthy would benefit most from the
present intervention, it is possible that this study can be used to motivate sedentary, unhealthy
individuals, demonstrating the positive impact of small amounts of RT.
66
8 References
Ahmed, S. M., Clasen, M. E. & Donnelly, J. E. 1998. Management of dyslipidemia in
adults. American Family Physician, 57 (9), 2192-2204, 2207-8.
Alberti, K. G., Eckel, R. H., Grundy, S. M., Zimmet, P. Z., Cleeman, J. I., Donato, K. A.,
Fruchart, J. C., James, W. P., Loria, C. M. & Smith, S. C. 2009. Harmonizing the
metabolic syndrome: a joint interim statement of the International Diabetes Federation
Task Force on Epidemiology and Prevention; National Heart, Lung, and Blood
Institute; American Heart Association; World Heart Federation; International
Atherosclerosis Society; and International Association for the Study of Obesity.
Circulation, 120 (16), 1640-1645.
Alberti, K. G., Zimmet, P., Shaw, J. & IDF Epidemiology Task Force Consensus Group
2005. The metabolic syndrome - a new worldwide definition. Lancet, 366 (9491),
1059-1062.
Alberti, K. G. & Zimmet, P. Z. 1998. Definition, diagnosis and classification of diabetes
mellitus and its complications. Part 1: diagnosis and classification of diabetes mellitus
provisional report of a WHO consultation. Diabetic Medicine: A Journal of the British
Diabetic Association, 15 (7), 539-553.
Aoyagi, Y. & Shephard, R. J. 1992. Aging and muscle function. Sports Medicine, (6), 376-
396.
Ayala, J. E., Bracy, D. P., Malabanan, C., James, F. D., Ansari, T., Fueger, P. T.,
McGuinness, O. P. & Wasserman, D. H. 2011. Hyperinsulinemic-euglycemic clamps
in conscious, unrestrained mice. Journal of Visualized Experiments, 57, 3188
Baldi, J. C. & Snowling, N. 2003. Resistance training improves glycaemic control in obese
type 2 diabetic men. International Journal of Sports Medicine, 24 (6), 419-423.
Balducci, S., Leonetti, F., Di Mario, U. & Fallucca, F. 2004. Is a long-term aerobic plus
resistance training program feasible for and effective on metabolic profiles in type 2
diabetic patients? Diabetes Care, 27 (3), 841-842.
Barter, P., Gotto, A. M., LaRosa, J. C., Maroni, J., Szarek, M., Grundy, S. M., Kastelein, J.
J., Bittner, V., Fruchart, J. C. & Treating to New Targets Investigators 2007. HDL
cholesterol, very low levels of LDL cholesterol, and cardiovascular events. The New
England Journal of Medicine, 357 (13), 1301-1310.
Bechtold, M., Palmer, J., Valtos, J., Iasiello, C. & Sowers, J. 2006. Metabolic syndrome in
the elderly. Current Diabetes Reports, 6 (1), 64-71.
67
Boden, G. & Shulman, G. I. 2002. Free fatty acids in obesity and type 2 diabetes: defining
their role in the development of insulin resistance and beta-cell dysfunction. European
Journal of Clinical Investigation, 32(3), 14-23.
Braith, R. W. & Stewart, K. J. 2006. Resistance exercise training: its role in the prevention
of cardiovascular disease. Circulation, 113 (22), 2642-2650.
Brooks, N., Layne, J. E., Gordon, P. L., Roubenoff, R., Nelson, M. E. & Castaneda-Sceppa,
C. 2006. Strength training improves muscle quality and insulin sensitivity in Hispanic
older adults with type 2 diabetes. International Journal of Medical Sciences, 4 (1), 19-
27.
Bweir, S., Al-Jarrah, M., Almalty, A. M., Maayah, M., Smirnova, I. V., Novikova, L. &
Stehno-Bittel, L. 2009. Resistance exercise training lowers HbA1c more than aerobic
training in adults with type 2 diabetes. Diabetology & Metabolic Syndrome, 1, 27
Byrne, C. D. & Wild, S. H. 2011. The metabolic syndrome (Second edition). Chichester,
West Sussex: Wiley-Blackwell.
Byrne, H. K. & Wilmore, J. H. 2000. The effects of resistance training on resting blood
pressure. The Journal of Strength & Conditioning Research, 14(4).
Cai, D., Yuan, M., Frantz, D. F., Melendez, P. A., Hansen, L., Lee, J. & Shoelson, S. E.
2005. Local and systemic insulin resistance resulting from hepatic activation of IKK-
beta and NF-kappaB. Nature Medicine, 11 (2), 183-190.
Campbell, W. W., Crim, M. C., Young, V. R. & Evans, W. J. 1994. Increased energy
requirements and changes in body composition with resistance training in older adults.
The American Journal of Clinical Nutrition, 60 (2), 167-175.
Castaneda, C., Layne, J. E., Munoz-Orians, L., Gordon, P. L., Walsmith, J., Foldvari, M.,
Roubenoff, R., Tucker, K. L. & Nelson, M. E. 2002. A randomized controlled trial of
resistance exercise training to improve glycemic control in older adults with type 2
diabetes. Diabetes Care 25 (12), 2335-2341.
Cauza, E., Hanusch-Enserer, U., Strasser, B., Ludvik, B., Metz-Schimmerl, S., Pacini, G.,
Wagner, O., Georg, P., Prager, R., Kostner, K., Dunky, A. & Haber, P. 2005. The
relative benefits of endurance and strength training on the metabolic factors and
muscle function of people with type 2 diabetes mellitus. Archives of Physical Medicine
and Rehabilitation, 86 (8), 1527-1533.
Chao, D., Foy, C. G. & Farmer, D. 2000. Exercise adherence among older adults:
challenges and strategies. Controlled Clinical Trials, 21 (5), 212-217.
Chen, Z., Wang, Z., Lohman, T., Heymsfield, S. B., Outwater, E., Nicholas, J. S., Bassford,
T., LaCroix, A., Sherrill, D., Punyanitya, M., Wu, G. & Going, S. 2007. Dual-energy
68
X-ray absorptiometry is a valid tool for assessing skeletal muscle mass in older
women. The Journal of Nutrition, 137 (12), 2775-2780.
Cheung, N. W., Cinnadaio, N., Russo, M. & Marek, S. 2009. A pilot randomised controlled
trial of resistance exercise bands in the management of sedentary subjects with type 2
diabetes. Diabetes Research and Clinical Practice, 83 (3), 68-71.
Clarkson, P. M., Hintermister, R., Fillyaw, M. & Stylos, L. 1981. High density lipoprotein
cholesterol in young adult weight lifters, runners and untrained subjects. Human
Biology, 53 (2), 251-257.
Collier, S. R., Kanaley, J. A., Carhart, R., Frechette, V., Tobin, M. M., Hall, A. K.,
Luckenbaugh, A. N. & Fernhall, B. 2008. Effect of 4 weeks of aerobic or resistance
exercise training on arterial stiffness, blood flow and blood pressure in pre- and stage-1
hypertensives. Journal of Human Hypertension 22 (10), 678-686.
Cononie, C. C., Graves, J. E., Pollock, M. L., Phillips, M. I., Sumners, C. & Hagberg, J. M.
1991. Effect of exercise training on blood pressure in 70- to 79-yr-old men and
women. Medicine and Science in Sports and Exercise 23 (4), 505-511.
Cornelissen, V. A. & Fagard, R. H. 2005. Effect of resistance training on resting blood
pressure: a meta-analysis of randomized controlled trials. Journal of Hypertension, 23
(2), 251-259.
Crook, M.A. 2012. Clinical biochemistry and metabolic medicine (Eight edition). London:
Hodder Education.
Dandona, P., Aljada, A. & Bandyopadhyay, A. 2004. Inflammation: the link between
insulin resistance, obesity and diabetes. Trends in Immunology, 25 (1), 4-7.
DeFronzo, R. A. & Ferrannini, E. 1991. Insulin resistance. A multifaceted syndrome
responsible for NIDDM, obesity, hypertension, dyslipidemia, and atherosclerotic
cardiovascular disease. Diabetes Care, 14 (3), 173-194.
DeFronzo, R. A., Ferrannini, E., Sato, Y., Felig, P. & Wahren, J. 1981. Synergistic
interaction between exercise and insulin on peripheral glucose uptake. Journal of
Clinical Investigation, 68 (6), 1468-1474.
DiFrancisco-Donoghue, J., Werner, W. & Douris, P. C. 2007. Comparison of once-weekly
and twice-weekly strength training in older adults. British Journal of Sports Medicine
41 (1), 19-22.
Dunstan, D. W., Daly, R. M., Owen, N., Jolley, D., De Courten, M., Shaw, J. & Zimmet, P.
2002. High-intensity resistance training improves glycemic control in older patients
with type 2 diabetes. Diabetes Care, 25 (10), 1729-1736.
69
Expert Panel on Detection, Evaluation, and Treatment of High Blood Cholesterol in Adults.
2001. Executive summary of the third report of the national cholesterol education
program (NCEP) expert panel on detection, evaluation, and treatment of high blood
cholesterol in adults (Adult Treatment Panel III). Journal of American Medical
Association, 285 (19), 2486-2497.
Egger, A., Niederseer, D., Diem, G., Finkenzeller, T., Ledl-Kurkowski, E., Forstner, R.,
Pirich, C., Patsch, W., Weitgasser, R. & Niebauer, J. 2013. Different types of
resistance training in type 2 diabetes mellitus: effects on glycaemic control, muscle
mass and strength. European Journal of Preventive Cardiology, 20 (6), 1051-1060.
Fahlman, M. M., Boardley, D., Lambert, C. P. & Flynn, M. G. 2002. Effects of endurance
training and resistance training on plasma lipoprotein profiles in elderly women.
Biological Sciences and Medical Sciences, 57 (2), 54-60.
Fahs, C. A., Heffernan, K. S., Ranadive, S., Jae, S. Y. & Fernhall, B. 2010. Muscular
strength is inversely associated with aortic stiffness in young men. Medicine and
Science in Sports and Exercise, 42 (9), 1619-1624.
Fisher, M. M. 2001. The effect of resistance exercise on recovery blood pressure in
normotensive and borderline hypertensive women. Journal of Strength and
Conditioning Research, 15 (2), 210-216.
Fleck, S. J. & Falkel, J. E. 1986. Value of resistance training for the reduction of sports
injuries. Sports Medicine, 3 (1), 61-68.
Flegal, K. M., Carroll, M. D., Ogden, C. L. & Johnson, C. L. 2002. Prevalence and trends
in obesity among US adults, 1999-2000. Journal of American Medical Association,
288 (14), 1723-1727.
Ford, E. S., Giles, W. H. & Dietz, W. H. 2002. Prevalence of the metabolic syndrome
among US adults: findings from the third National Health and Nutrition Examination
Survey. Journal of American Medical Association, 287 (3), 356-359.
Frank, E. A., Shubha, M. C. & D'Souza, C. J. 2012. Blood glucose determination: plasma
or serum? Journal of Clinical Laboratory Analysis, 26 (5), 317-320.
Galvao, D. A. & Taaffe, D. R. 2005. Resistance exercise dosage in older adults: single-
versus multiset effects on physical performance and body composition. Journal of the
American Geriatrics Society, 53 (12), 2090-2097.
Geirsdottir, O. G., Arnarson, A., Briem, K., Ramel, A., Jonsson, P. V. & Thorsdottir, I.
2012. Effect of 12-week resistance exercise program on body composition, muscle
strength, physical function, and glucose metabolism in healthy, insulin-resistant, and
diabetic elderly Icelanders. Biological Sciences and Medical Sciences, 67 (11), 1259-
1265.
70
Glickman, S. G., Marn, C. S., Supiano, M. A. & Dengel, D. R. 2004. Validity and
reliability of dual-energy X-ray absorptiometry for the assessment of abdominal
adiposity. Journal of Applied Physiology, 97 (2), 509-514.
Goldberg, A. P. 1989. Aerobic and resistive exercise modify risk factors for coronary heart
disease. Medicine and Science in Sports and Exercise, 21 (6), 669-674.
Goldberg, L., Elliot, D. L., Schutz, R. W. & Kloster, F. E. 1984. Changes in lipid and
lipoprotein levels after weight training. Journal of American Medical Association, 252
(4), 504-506.
Gutierrez-Fisac, J. L., Banegas Banegas, J. R., Artalejo, F. R. & Regidor, E. 2000.
Increasing prevalence of overweight and obesity among Spanish adults, 1987-1997.
Journal of the International Association for the Study of Obesity, 24 (12), 1677-1682.
Hagberg, J. M., Ehsani, A. A., Goldring, D., Hernandez, A., Sinacore, D. R. & Holloszy, J.
O. 1984. Effect of weight training on blood pressure and hemodynamics in
hypertensive adolescents. The Journal of Pediatrics, 104 (1), 147-151.
Halliwell, B. 1995. Antioxidant characterization. Methodology and mechanism.
Biochemical Pharmacology, 49 (10), 1341-1348.
Hardy, D. O. & Tucker, L. A. 1998. The effects of a single bout of strength training on
ambulatory blood pressure levels in 24 mildly hypertensive men. American Journal of
Health Promotion, 13 (2), 69-72.
Harris, K. A. & Holly, R. G. 1987. Physiological response to circuit weight training in
borderline hypertensive subjects. Medicine and Science in Sports and Exercise, 19 (3),
246-252.
Honkola, A., Forsen, T. & Eriksson, J. 1997. Resistance training improves the metabolic
profile in individuals with type 2 diabetes. Acta Diabetologica, 34 (4), 245-248.
Hooper, L., Abdelhamid, A., Moore, H. J., Douthwaite, W., Skeaff, C. M. & Summerbell,
C. D. 2012. Effect of reducing total fat intake on body weight: systematic review and
meta-analysis of randomised controlled trials and cohort studies. British Medical
Journal, 345.
Huang, J., Frohlich, J. & Ignaszewski, A. P. 2011. The impact of dietary changes and
dietary supplements on lipid profile. The Canadian Journal of Cardiology, 27 (4), 488-
505.
Hunter, G. R., Brock, D. W., Byrne, N. M., Chandler-Laney, P. C., Del Corral, P. &
Gower, B. A. 2010. Exercise training prevents regain of visceral fat for 1 year
following weight loss. Obesity, 18 (4), 690-695.
71
Hunter, G. R., Bryan, D. R., Wetzstein, C. J., Zuckerman, P. A. & Bamman, M. M. 2002.
Resistance training and intra-abdominal adipose tissue in older men and women.
Medicine and Science in Sports and Exercise, 34 (6), 1023-1028.
Hunter, G. R., Wetzstein, C. J., Fields, D. A., Brown, A. & Bamman, M. M. 2000.
Resistance training increases total energy expenditure and free-living physical activity
in older adults. Journal of Applied Physiology, 89 (3), 977-984.
Hurley, B. F. 1989. Effects of resistive training on lipoprotein-lipid profiles: a comparison
to aerobic exercise training. Medicine and Science in Sports and Exercise, 21 (6), 689-
693.
Hurley, B. F., Hagberg, J. M., Goldberg, A. P., Seals, D. R., Ehsani, A. A., Brennan, R. E.
& Holloszy, J. O. 1988. Resistive training can reduce coronary risk factors without
altering VO2max or percent body fat. Medicine and Science in Sports and Exercise, 20
(2), 150-154.
Hurley, B. F., Hanson, E. D. & Sheaff, A. K. 2011. Strength training as a countermeasure
to aging muscle and chronic disease. Sports Medicine, 41 (4), 289-306.
Ibanez, J., Izquierdo, M., Arguelles, I., Forga, L., Larrion, J. L., Garcia-Unciti, M., Idoate,
F. & Gorostiaga, E. M. 2005. Twice-weekly progressive resistance training decreases
abdominal fat and improves insulin sensitivity in older men with type 2 diabetes.
Diabetes Care, 28 (3), 662-667.
Ilanne-Parikka, P., Eriksson, J. G., Lindstrom, J., Hamalainen, H., Keinanen-Kiukaanniemi,
S., Laakso, M., Louheranta, A., Mannelin, M., Rastas, M., Salminen, V., Aunola, S.,
Sundvall, J., Valle, T., Lahtela, J., Uusitupa, M., Tuomilehto, J. & Finnish Diabetes
Prevention Study Group. 2004. Prevalence of the metabolic syndrome and its
components: findings from a Finnish general population sample and the Diabetes
Prevention Study cohort. Diabetes Care, 27 (9), 2135-2140.
Ishii, T., Yamakita, T., Sato, T., Tanaka, S. & Fujii, S. 1998. Resistance training improves
insulin sensitivity in NIDDM subjects without altering maximal oxygen uptake.
Diabetes Care, 21 (8), 1353-1355.
Kaminsky, L., Ozemek, C., Williams, K. & Byun, W. 2014. Precision of total and regional
body fat estimates from dual-energy X-ray absorptiometer measurements. The Journal
of Nutrition, Health and Aging, 18(6), 591-594.
Kanda, H., Tateya, S., Tamori, Y., Kotani, K., Hiasa, K., Kitazawa, R., Kitazawa, S.,
Miyachi, H., Maeda, S., Egashira, K. & Kasuga, M. 2006. MCP-1 contributes to
macrophage infiltration into adipose tissue, insulin resistance, and hepatic steatosis in
obesity. The Journal of Clinical Investigation, 116 (6), 1494-1505.
72
Kang, S. M., Yoon, J. W., Ahn, H. Y., Kim, S. Y., Lee, K. H., Shin, H., Choi, S. H., Park,
K. S., Jang, H. C. & Lim, S. 2011. Android fat depot is more closely associated with
metabolic syndrome than abdominal visceral fat in elderly people. Public Library of
Science ONE, 6 (11), e27694.
Kannel, W. B. 1996. Blood pressure as a cardiovascular risk factor: prevention and
treatment. Journal of American Medical Association, 275 (20), 1571-1576.
Kaul, S., Rothney, M. P., Peters, D. M., Wacker, W. K., Davis, C. E., Shapiro, M. D. &
Ergun, D. L. 2012. Dual-energy X-ray absorptiometry for quantification of visceral fat.
Obesity, 20 (6), 1313-1318.
Kaur, J. 2014. A comprehensive review on metabolic syndrome. Cardiology Research and
Practice, 2014 (2014).
Kelley, G. A. & Kelley, K. S. 2009. Impact of progressive resistance training on lipids and
lipoproteins in adults: a meta-analysis of randomized controlled trials. Preventive
Medicine, 48 (1), 9-19.
Kelley, G. A. & Kelley, K. S. 2000. Progressive resistance exercise and resting blood
pressure : A meta-analysis of randomized controlled trials. Hypertension, 35 (3), 838-
843.
Keys, A., Karvonen, M. J. & Fidanza, F. 1958. Serum-cholesterol studies in Finland. The
Lancet, 272 (7039), 175-178.
Khamaisi, M., Potashnik, R., Tirosh, A., Demshchak, E., Rudich, A., Tritschler, H.,
Wessel, K. & Bashan, N. 1997. Lipoic acid reduces glycemia and increases muscle
GLUT4 content in streptozotocin-diabetic rats. Metabolism: Clinical and
Experimental, 46 (7), 763-768.
Klimcakova, E., Polak, J., Moro, C., Hejnova, J., Majercik, M., Viguerie, N., Berlan, M.,
Langin, D. & Stich, V. 2006. Dynamic strength training improves insulin sensitivity
without altering plasma levels and gene expression of adipokines in subcutaneous
adipose tissue in obese men. The Journal of Clinical Endocrinology and Metabolism,
91 (12), 5107-5112.
Kokkinos, P. F., Hurley, B. F., Smutok, M. A., Farmer, C., Reece, C., Shulman, R.,
Charabogos, C., Patterson, J., Will, S. & Devane-Bell, J. 1991. Strength training does
not improve lipoprotein-lipid profiles in men at risk for CHD. Medicine and Science in
Sports and Exercise, 23 (10), 1134-1139.
Komi, P. V. 2003. Strength and power in sport. (Second edition). Osney Mead, Oxford:
Blackwell Science.
73
Konrad, T., Vicini, P., Kusterer, K., Hoflich, A., Assadkhani, A., Bohles, H. J., Sewell, A.,
Tritschler, H. J., Cobelli, C. & Usadel, K. H. 1999. alpha-Lipoic acid treatment
decreases serum lactate and pyruvate concentrations and improves glucose
effectiveness in lean and obese patients with type 2 diabetes. Diabetes Care, 22 (2),
280-287.
Kraemer, W. J. & Ratamess, N. A. 2004. Fundamentals of resistance training: progression
and exercise prescription. Medicine and Science in Sports and Exercise, 36 (4), 674-
688.
Kwon, H. R., Han, K. A., Ku, Y. H., Ahn, H. J., Koo, B. K., Kim, H. C. & Min, K. W.
2010. The effects of resistance training on muscle and body fat mass and muscle
strength in type 2 diabetic women. Korean Diabetes Journal, 34 (2), 101-110.
Layne, J. E. & Nelson, M. E. 1999. The effects of progressive resistance training on bone
density: a review. Medicine and Science in Sports and Exercise 31 (1), 25-30.
Lechleitner, M. 2008. Obesity and the metabolic syndrome in the elderly-a mini-review.
Gerontology, 54 (5), 253-259.
LeMura, L. M., von Duvillard, S. P., Andreacci, J., Klebez, J. M., Chelland, S. A. & Russo,
J. 2000. Lipid and lipoprotein profiles, cardiovascular fitness, body composition, and
diet during and after resistance, aerobic and combination training in young women.
European Journal of Applied Physiology, 82 (5), 451-458.
Levinger, I., Goodman, C., Hare, D. L., Jerums, G. & Selig, S. 2007. The effect of
resistance training on functional capacity and quality of life in individuals with high
and low numbers of metabolic risk factors. Diabetes Care 30 (9), 2205-2210.
Levinger, I., Goodman, C., Hare, D. L., Jerums, G., Toia, D. & Selig, S. 2009. The
reliability of the 1RM strength test for untrained middle-aged individuals. Sports
Medicine Australia, 12 (2), 310-316.
Lira, F. S., Yamashita, A. S., Uchida, M. C., Zanchi, N. E., Gualano, B., Martins, E.,
Caperuto, E. C. & Seelaender, M. 2010. Low and moderate, rather than high intensity
strength exercise induces benefit regarding plasma lipid profile. Diabetology &
Metabolic Syndrome, 2 (1), 31.
Malik, S., Wong, N. D., Franklin, S. S., Kamath, T. V., L'Italien, G. J., Pio, J. R. &
Williams, G. R. 2004. Impact of the metabolic syndrome on mortality from coronary
heart disease, cardiovascular disease, and all causes in United States adults.
Circulation, 110 (10), 1245-1250.
Mann, S., Beedie, C. & Jimenez, A. 2014. Differential effects of aerobic exercise,
resistance training and combined exercise modalities on cholesterol and the lipid
profile: review, synthesis and recommendations. Sports Medicine, 44 (2), 211-221.
74
Manning, J. M., Dooly-Manning, C. R., White, K., Kampa, I., Silas, S., Kesselhaut, M. &
Ruoff, M. 1991. Effects of a resistive training program on lipoprotein--lipid levels in
obese women. Medicine and Science in Sports and Exercise, 23 (11), 1222-1226.
Martel, G. F., Hurlbut, D. E., Lott, M. E., Lemmer, J. T., Ivey, F. M., Roth, S. M., Rogers,
M. A., Fleg, J. L. & Hurley, B. F. 1999. Strength training normalizes resting blood
pressure in 65- to 73-year-old men and women with high normal blood pressure.
Journal of the American Geriatrics Society, 47 (10), 1215-1221.
Meigs, J. B., Nathan, D. M., D'Agostino RB, S., Wilson, P. W. & Framingham Offspring
Study 2002. Fasting and postchallenge glycemia and cardiovascular disease risk: the
Framingham Offspring Study. Diabetes Care, 25 (10), 1845-1850.
Metter, E. J., Windham, B. G., Maggio, M., Simonsick, E. M., Ling, S. M., Egan, J. M. &
Ferrucci, L. 2008. Glucose and insulin measurements from the oral glucose tolerance
test and mortality prediction. Diabetes Care, 31 (5), 1026-1030.
Miazgowski, T., Krzyzanowska-Swiniarska, B., Dziwura-Ogonowska, J. & Widecka, K.
2014. The associations between cardiometabolic risk factors and visceral fat measured
by a new dual-energy X-ray absorptiometry-derived method in lean healthy Caucasian
women. Endocrine, 47 (2), 500-505.
Miller, J. P., Pratley, R. E., Goldberg, A. P., Gordon, P., Rubin, M., Treuth, M. S., Ryan, A.
S. & Hurley, B. F. 1994. Strength training increases insulin action in healthy 50- to 65-
yr-old men. Journal of Applied Physiology, 77 (3), 1122-1127.
Miller, W. J., Sherman, W. M. & Ivy, J. L. 1984. Effect of strength training on glucose
tolerance and post-glucose insulin response. Medicine and Science in Sports and
Exercise 16 (6), 539-543.
Misra, A., Alappan, N. K., Vikram, N. K., Goel, K., Gupta, N., Mittal, K., Bhatt, S. &
Luthra, K. 2008. Effect of supervised progressive resistance-exercise training protocol
on insulin sensitivity, glycemia, lipids, and body composition in Asian Indians with
type 2 diabetes. Diabetes Care 31 (7), 1282-1287.
Miura, H., Takahashi, Y., Maki, Y. & Sugino, M. 2015. Effects of exercise training on
arterial stiffness in older hypertensive females. European Journal of Applied
Physiology, 115, 1847-1854.
Mooradian, A. D. 2009. Dyslipidemia in type 2 diabetes mellitus. Endocrinology &
Metabolism 5 (3), 150-159.
Mourad, J. J. 2008. The evolution of systolic blood pressure as a strong predictor of
cardiovascular risk and the effectiveness of fixed-dose ARB/CCB combinations in
lowering levels of this preferential target. Vascular Health and Risk Management, 4
(6), 1315-1325.
75
Obici, S., Feng, Z., Karkanias, G., Baskin, D. G. & Rossetti, L. 2002a. Decreasing
hypothalamic insulin receptors causes hyperphagia and insulin resistance in rats.
Nature Neuroscience, 5 (6), 566-572.
Obici, S., Feng, Z., Morgan, K., Stein, D., Karkanias, G. & Rossetti, L. 2002b. Central
administration of oleic acid inhibits glucose production and food intake. Diabetes, 51
(2), 271-275.
Ockene, I. S., Chiriboga, D. E., Stanek, E. J., Harmatz, M. G., Nicolosi, R., Saperia, G.,
Well, A. D., Freedson, P., Merriam, P. A., Reed, G., Ma, Y., Matthews, C. E. &
Hebert, J. R. 2004. Seasonal variation in serum cholesterol levels: treatment
implications and possible mechanisms. Archives of Internal Medicine, 164 (8), 863-
870.
Ozawa, K., Miyazaki, M., Matsuhisa, M., Takano, K., Nakatani, Y., Hatazaki, M.,
Tamatani, T., Yamagata, K., Miyagawa, J., Kitao, Y., Hori, O., Yamasaki, Y. &
Ogawa, S. 2005. The endoplasmic reticulum chaperone improves insulin resistance in
type 2 diabetes. Diabetes, 54 (3), 657-663.
Ozcan, U., Cao, Q., Yilmaz, E., Lee, A. H., Iwakoshi, N. N., Ozdelen, E., Tuncman, G.,
Gorgun, C., Glimcher, L. H. & Hotamisligil, G. S. 2004. Endoplasmic reticulum stress
links obesity, insulin action, and type 2 diabetes. Science, 306 (5695), 457-461.
Park, S. W., Goodpaster, B. H., Lee, J. S., Kuller, L. H., Boudreau, R., de Rekeneire, N.,
Harris, T. B., Kritchevsky, S., Tylavsky, F. A., Nevitt, M., Cho, Y. W., Newman, A. B.
& Health, Aging,and Body Composition Study 2009. Excessive loss of skeletal muscle
mass in older adults with type 2 diabetes. Diabetes Care, 32 (11), 1993-1997.
Park, S. W., Goodpaster, B. H., Strotmeyer, E. S., de Rekeneire, N., Harris, T. B.,
Schwartz, A. V., Tylavsky, F. A. & Newman, A. B. 2006. Decreased muscle strength
and quality in older adults with type 2 diabetes: the health, aging, and body
composition study. Diabetes, 55 (6), 1813-1818.
Park, S. W., Goodpaster, B. H., Strotmeyer, E. S., Kuller, L. H., Broudeau, R., Kammerer,
C., de Rekeneire, N., Harris, T. B., Schwartz, A. V., Tylavsky, F. A., Cho, Y. W.,
Newman, A. B. & Health, Aging,and Body Composition Study 2007. Accelerated loss
of skeletal muscle strength in older adults with type 2 diabetes: the health, aging, and
body composition study. Diabetes Care, 30 (6), 1507-1512.
Petersen, K. F., Befroy, D., Dufour, S., Dziura, J., Ariyan, C., Rothman, D. L., DiPietro, L.,
Cline, G. W. & Shulman, G. I. 2003. Mitochondrial dysfunction in the elderly:
possible role in insulin resistance. Science, 300 (5622), 1140-1142.
Petersen, K. F. & Shulman, G. I. 2006. Etiology of insulin resistance. The American
Journal of Medicine, 119 (5), 10-16.
76
Pollex, R. L. & Hegele, R. A. 2006. Genetic determinants of the metabolic syndrome.
Cardiovascular Medicine, 3 (9), 482-489.
Pratley, R., Nicklas, B., Rubin, M., Miller, J., Smith, A., Smith, M., Hurley, B. &
Goldberg, A. 1994. Strength training increases resting metabolic rate and
norepinephrine levels in healthy 50- to 65-yr-old men. Journal of Applied Physiology,
76 (1), 133-137.
Qatanani, M. & Lazar, M. A. 2007. Mechanisms of obesity-associated insulin resistance:
many choices on the menu. Genes & Development, 21 (12), 1443-1455.
Rader, D. J. 2007. Effect of insulin resistance, dyslipidemia, and intra-abdominal adiposity
on the development of cardiovascular disease and diabetes mellitus. The American
Journal of Medicine 120 (3), 12-18.
Reaven, G. M. 1988. Banting lecture 1988. Role of insulin resistance in human disease.
Diabetes, 37 (12), 1595-1607.
Reynolds, T. H., Supiano, M. A. & Dengel, D. R. 2004. Resistance training enhances
insulin-mediated glucose disposal with minimal effect on the tumor necrosis factor-
alpha system in older hypertensives. Metabolism: Clinical and Experimental 53 (3),
397-402.
Rice, B., Janssen, I., Hudson, R. & Ross, R. 1999. Effects of aerobic or resistance exercise
and/or diet on glucose tolerance and plasma insulin levels in obese men. Diabetes
Care, 22 (5), 684-691.
Ross, R., Rissanen, J., Pedwell, H., Clifford, J. & Shragge, P. 1996. Influence of diet and
exercise on skeletal muscle and visceral adipose tissue in men. Journal of Applied
Physiology, 81 (6), 2445-2455.
Ryan, A. S., Hurlbut, D. E., Lott, M. E., Ivey, F. M., Fleg, J., Hurley, B. F. & Goldberg, A.
P. 2001. Insulin action after resistive training in insulin resistant older men and
women. Journal of the American Geriatrics Society, 49 (3), 247-253.
Sallis JF, O. N. 1999. Determinants of physical activity: physical activity and behavioral
medicine. Thousand Oaks: Sage Publications.
Salvetti, A., Brogi, G., Di Legge, V. & Bernini, G. P. 1993. The inter-relationship between
insulin resistance and hypertension. Drugs, 46 (2), 149-159.
Scherzer, R., Shen, W., Bacchetti, P., Kotler, D., Lewis, C. E., Shlipak, M. G., Punyanitya,
M., Heymsfield, S. B., Grunfeld, C. & Study of Fat Redistribution Metabolic Change
in HIV Infection 2008. Comparison of dual-energy X-ray absorptiometry and magnetic
resonance imaging-measured adipose tissue depots in HIV-infected and control
subjects. The American Journal of Clinical Nutrition, 88 (4), 1088-1096.
77
Schmitz, K. H., Jensen, M. D., Kugler, K. C., Jeffery, R. W. & Leon, A. S. 2003. Strength
training for obesity prevention in midlife women. Journal of the International
Association for the Study of Obesity, 27 (3), 326-333.
Schumann, M., Kuusmaa, M., Newton, R. U., Sirparanta, A. I., Syvaoja, H., Hakkinen, A.
& Hakkinen, K. 2014. Fitness and lean mass increases during combined training
independent of loading order. Medicine and Science in Sports and Exercise, 46 (9),
1758-1768.
Shoelson, S. E., Lee, J. & Goldfine, A. B. 2006. Inflammation and insulin resistance. The
Journal of Clinical Investigation, 116 (7), 1793-1801.
Sigal, R. J., Kenny, G. P., Boule, N. G., Wells, G. A., Prud'homme, D., Fortier, M., Reid,
R. D., Tulloch, H., Coyle, D., Phillips, P., Jennings, A. & Jaffey, J. 2007. Effects of
aerobic training, resistance training, or both on glycemic control in type 2 diabetes: a
randomized trial. Annals of Internal Medicine, 147 (6), 357-369.
Singh, I. M., Shishehbor, M. H. & Ansell, B. J. 2007. High-density lipoprotein as a
therapeutic target: a systematic review. Journal of American Medical Association, 298
(7), 786-798.
Smutok, M. A., Reece, C., Kokkinos, P. F., Farmer, C., Dawson, P., Shulman, R., DeVane-
Bell, J., Patterson, J., Charabogos, C. & Goldberg, A. P. 1993. Aerobic versus strength
training for risk factor intervention in middle-aged men at high risk for coronary heart
disease. Metabolism: Clinical and Experimental, 42 (2), 177-184.
Snowling, N. J. & Hopkins, W. G. 2006. Effects of different modes of exercise training on
glucose control and risk factors for complications in type 2 diabetic patients: a meta-
analysis. Diabetes Care, 29 (11), 2518-2527.
Staron, R. S., Murrax, T. E., Gilders, R. M., Hagerman, F. C., Hikida, R. S. & Ragg, K. E.
2000. Influence of resistance training on serum lipid and lipoprotein concentrations in
young men and women. The Journal of Strength & Conditioning Research, 14(1).
Steinberger, J., Moorehead, C., Katch, V. & Rocchini, A. P. 1995. Relationship between
insulin resistance and abnormal lipid profile in obese adolescents. The Journal of
Pediatrics, 126 (5), 690-695.
Strasser, B. & Schobersberger, W. 2011. Evidence for resistance training as a treatment
therapy in obesity. Journal of Obesity, 2011 (2011).
Strasser, B., Siebert, U. & Schobersberger, W. 2010. Resistance training in the treatment of
the metabolic syndrome: a systematic review and meta-analysis of the effect of
resistance training on metabolic clustering in patients with abnormal glucose
metabolism. Sports Medicine, 40 (5), 397-415.
78
Stratton, I. M., Adler, A. I., Neil, H. A., Matthews, D. R., Manley, S. E., Cull, C. A.,
Hadden, D., Turner, R. C. & Holman, R. R. 2000. Association of glycaemia with
macrovascular and microvascular complications of type 2 diabetes: prospective
observational study. British Medical Journal, 321 (7258), 405-412.
Stults-Kolehmainen, M. A., Stanforth, P. R., Bartholomew, J. B., Lu, T., Abolt, C. J. &
Sinha, R. 2013. DXA estimates of fat in abdominal, trunk and hip regions varies by
ethnicity in men. Nutrition & Diabetes, 3(3), e64.
Sundell, J. 2011. Resistance Training Is an Effective Tool against Metabolic and Frailty
Syndromes. Advances in Preventive Medicine, 2011, 1-7.
National High Blood Pressure Education Program Coordinating Committee. 2004. The
seventh report of the Joint National Committee (JNC) on prevention, detection,
evaluation, and treatment of high blood pressure. Hypertension, 42(6): 1206-1252.
Tresierras, M. A. & Balady, G. J. 2009. Resistance training in the treatment of diabetes and
obesity: mechanisms and outcomes. Journal of Cardiopulmonary Rehabilitation and
Prevention, 29 (2), 67-75.
Treuth, M. S., Hunter, G. R., Kekes-Szabo, T., Weinsier, R. L., Goran, M. I. & Berland, L.
1995. Reduction in intra-abdominal adipose tissue after strength training in older
women. Journal of Applied Physiology, 78 (4), 1425-1431.
Treuth, M. S., Ryan, A. S., Pratley, R. E., Rubin, M. A., Miller, J. P., Nicklas, B. J., Sorkin,
J., Harman, S. M., Goldberg, A. P. & Hurley, B. F. 1994. Effects of strength training
on total and regional body composition in older men. Journal of Applied Physiology,
77 (2), 614-620.
Tsutsumi, T., Don, B. M., Zaichkowsky, L. D. & Delizonna, L. L. 1997. Physical fitness
and psychological benefits of strength training in community dwelling older adults.
Journal of Physiological Anthropology, 16 (6), 257-266.
United Nations Population Division. 2013. World population ageing report 2013. New
York.
Verdijk, L. B., van Loon, L., Meijer, K. & Savelberg, H. H. 2009. One-repetition maximum
strength test represents a valid means to assess leg strength in vivo in humans. Journal
of Sports Sciences, 27 (1), 59-68.
Walker, S., Peltonen, H. & Hakkinen, K. 2015. Medium-intensity, high-volume
"hypertrophic" resistance training did not induce improvements in rapid force
production in healthy older men. Age, 37 (3).
Westcott, W. L. 2012. Resistance training is medicine: effects of strength training on
health. Current Sports Medicine Reports, 11 (4), 209-216.
79
Whelton, S. P., Chin, A., Xin, X. & He, J. 2002. Effect of aerobic exercise on blood
pressure: a meta-analysis of randomized, controlled trials. Annals of Internal Medicine,
136 (7), 493-503.
Wu, S. H., Liu, Z. & Ho, S. C. 2010. Metabolic syndrome and all-cause mortality: a meta-
analysis of prospective cohort studies. European Journal of Epidemiology, 25 (6), 375-
384.
Yki-Jarvinen, H., Koivisto, V. A., Taskinen, M. R. & Nikkila, E. 1984. Glucose tolerance,
plasma lipoproteins and tissue lipoprotein lipase activities in body builders. European
Journal of Applied Physiology and Occupational Physiology, 53 (3), 253-259.

Alistair Inglis - Master's Thesis

  • 1.
    1 EFFECTS OF ASHORT-TERM RESISTANCE TRAINING PROTOCOL ON RISK FACTORS FOR THE METABOLIC SYNDROME IN THE ELDERLY ALISTAIR INGLIS Master’s Thesis in Exercise Physiology 2014 – 2016 Department of Biology of Physical Activity University of Jyväskylä Supervisors: H. Kyröläinen, H. Kainulainen and S. Walker
  • 2.
    2 ABSTRACT Inglis, Alistair. 2016.Effects of a short-term, resistance training protocol on risk factors for the metabolic syndrome in the elderly. Department of Biology of Physical Activity, University of Jyväskylä. Master’s Thesis in Exercise Physiology. 79 pp. The metabolic syndrome is strongly associated with negative health outcomes, such as type 2 diabetes, cardiovascular disease and death. The elderly are at particularly high risk of developing the metabolic syndrome, owing to the physiological and behavioural changes associated with aging. The positive influence that resistance training has on the neuromuscular system has long been evident; however, in more recent years, increasing focus has been placed on the role of RT in preventing and treating chronic disease. The majority of studies in the literature suggest that RT has a positive effect on cardiometabolic risk factors. That being said, there remain some inconsistencies. Whether improvements following RT are clinically significant and truly meaningful also remains a disputed point. Further, the physiological mechanisms underlying improvements in risk factors for the metabolic syndrome following RT have not been fully elucidated. The aim of this study was to investigate the effects of a short-term, high-repetition RT protocol with short rest periods on risk factors for the metabolic syndrome in an untrained, heterogeneous elderly population. The results suggest that RT has a positive effect on risk factors for the metabolic syndrome in the elderly. RT led to meaningful improvements in these risk factors – reducing abdominal fat and systolic blood pressure while increasing glucose tolerance. It is unclear whether RT positively affects diastolic blood pressure and the lipid profile; the present results suggest that it does not. The mechanisms underlying positive changes in cardiometabolic risk factors following RT remain complex. However, the present results highlight the role of fat and obesity in both the development and treatment/prevention of the metabolic syndrome. The majority of studies in the literature use relatively long lasting, high-frequency protocols (~48 total training sessions) to investigate the effects of RT on cardiometabolic risk factors. This study appears to be the first to show improvements in risk factors for the metabolic syndrome in the elderly following a short-term RT protocol with only 24 total training sessions. The results of the present study should be considered when prescribing exercise for the elderly. The results suggest that small doses of RT (24 hours) can have a significant, health-promoting effect. This point is important when considering that a major barrier to exercise is a lack of time. Keywords: The metabolic syndrome, resistance training, insulin resistance, glucose tolerance, hypertension, lipid profile, dose-response.
  • 3.
    3 ACKNOWLEDGMENTS This study wascarried out through the Department of Biology of Physical Activity, at the University of Jyväskylä. I would like to acknowledge the department, as well as Simon Walker and Heikki Kyröläinen for their continued support. Furthermore, I would like to thank the technical staff of the department for their tireless work. A special thanks to fellow students, Javier Alonso and Elena Fernández Lezaun, for their contributions.
  • 4.
    4 CONTENTS ABSTRACT ACKNOWLEDGMENTS CONTENTS 1 INTRODUCTION………………………………………………………………………...6 2 REVIEWOF THE LITERATURE……………………………………………………….8 2.1 The metabolic syndrome. . . . . . . . . . . . . . . . ……………………………………8 2.1.1 Description……………………………………………………………8 2.1.2 Components…………………………………………………………..8 2.1.3 Diagnosis…………………………………………………………….13 2.1.4 Prevalence…………………………………………………………...13 2.1.5 Pathophysiology……………...……………………………………...14 2.1.6 Consequences………………………………………………………..18 2.1.7 Management…………………………………………………………18 2.2 Reistance training……………………………………………………………...19 2.2.1 Description…………………………………………………………..19 2.2.2 Resistance training and the elderly…………………………………..19 2.2.3 Resistance training and disease prevention………………………….20 2.3 Resistance training and the metabolic syndrome………………………………20 2.3.1 Insulin resistance and glucose tolerance……………………………..20 2.3.2 Abdominal obesity.………………………………………………….25 2.3.3 Blood pressure. ………………………………………………..…….27 2.3.4 Lipid profile…………………………………………………………29 2.3.5 Mechanisms …………………………………………………………31 2.3.6 Dose-response relationship ………………………………………….31 3 AIMS OF THE STUDY………………………………………………………………….34 3.1 Research questions and hypotheses ………………………………………...…34
  • 5.
    5 4 METHODS………….…………………………………….………………………...…....35 4.1 Subjects……………………………………………………………………….35 4.2 Experimental design …………………………………………………………..36 4.2.1 Overall design ……………………………………………………….36 4.2.2 Training protocol ……………………………………………………37 4.2.3 Control group ……………………………………………………….39 4.3 Data collection …………………………………………………………………39 4.3.1 Strength………………………………………………………………39 4.3.2 Body composition …………………………………………………...41 4.3.3 Glucose tolerance, blood pressure and lipid profile…………..……..42 4.4 Statistical analysis……………………………………………………………..43 5 RESULTS………….…………………………………………………………………….44 5.1 Strength………………………………………………………………………..44 5.2 Body composition…………………………………………………………..…44 5.3 Glucose tolerance, blood pressure and lipid profile……………………………45 5.4 Correlations……………………………………………………………………47 6 DISCUSSION……………………………………………………………………………50 7 CONCLUSION…………………………………………………………………………..65 8 REFERENCES………………………………………………………………………..…66 34
  • 6.
    6 1 INTRODUCTION The metabolicsyndrome is characterized by the clustering of cardiometabolic risk factors (Byrne & Wild 2011). The primary risk factors, markers or components of the metabolic syndrome are insulin resistance/impaired glucose tolerance, abdominal obesity, hypertension and dyslipidemia. The prevalence of the metabolic syndrome is increasing across the world (Bechtold et al. 2006). The International Diabetes Federation (IDF) has estimated that about a quarter of the world’s adult population has the metabolic syndrome (Kaur 2014). The elderly are at particularly high risk of developing the metabolic syndrome, owing to the physiological and behavioural changes associated with aging. A cross-sectional study of 2,049 Finnish men and women aged 45-64 years old found that the metabolic syndrome was present among 38.8% of men and 22.2% of women (Ilanne-Parikka et al. 2004). The positive impact of resistance training on the musculoskeletal system has been evident for decades. Resistance training is especially important for elderly populations, as aging is associated with losses in strength and muscle mass. Evidence indicates that resistance training can slow age-related losses in strength and muscle mass in the elderly, which contributes to improved functional capacity and increased independence (Hurley et al. 2011, Strasser & Schobersberger 2011, Tresierras & Balady 2009). There has been considerable research conducted in past decades investigating various methods of ameliorating cardiometabolic risk factors related to the metabolic syndrome. The management of the metabolic syndrome generally focuses on lifestyle interventions, namely increasing physical activity levels and improving dietary habits (Bechtold et al. 2006). In recent years, the role of resistance training in disease prevention and treatment has received more emphasis. There is a growing body of evidence that suggests that resistance training improves important cardiometabolic risk factors (Hurley et al. 2011, Strasser & Schobersberger 2011, Tresierras & Balady 2009). Resistance training may be an effective tool in the prevention or treatment of the metabolic syndrome. While there is substantial evidence to support this claim, there remain some inconsistencies in the literature.
  • 7.
    7 The primary aimof this study is to investigate the effects of a short-term, high-repetition resistance training protocol with short rest periods on risk factors for the metabolic syndrome in an untrained, heterogeneous elderly population. Resistance training will likely have a positive influence on strength and muscle mass; however, whether it will have a statistically and clinically significant effect on risk factors for the metabolic syndrome is unclear. Additionally, specific consideration will be given to a possible dose-response relationship between RT and improvements in risk factors for the metabolic syndrome, as well as the physiological mechanisms underlying any improvements in these risk factors.
  • 8.
    8 2 REVIEW OFTHE LITERATURE 2.1 The metabolic syndrome 2.1.1 Description A syndrome consisting of a clustering of metabolic and cardiovascular risk factors was first described in 1988, when it was noted that insulin resistance was associated with the causation and clinical course of type 2 diabetes, coronary artery disease and hypertension (Reaven 1988). This question has since been the focus of a large volume of research. Reaven (1988) originally termed the clustering of risk factors associated with insulin resistance as syndrome x. Other terms, such as the deadly quartet, cardiometabolic syndrome and obesity dyslipidemia syndrome are also used, but the most common term is the metabolic syndrome. The metabolic syndrome refers to the co-occurrence of the following cardiometabolic components: insulin resistance/impaired glucose tolerance, abdominal obesity, hypertension and dyslipidemia (Byrne & Wild 2011). There has been some debate regarding the practicality of the term “the metabolic syndrome.” It is unclear whether the concept of the metabolic syndrome is particularly useful for researchers, policy makers and health care professionals. Ultimately, it is very clear that the components of the metabolic syndrome cluster together and are strongly associated with negative health outcomes (Byrne & Wild 2011). Therefore, the metabolic syndrome as a concept is essential in that it puts a name, and thus a spotlight, on these inter-related risk factors. 2.1.2 Components Insulin resistance and impaired glucose tolerance. Insulin resistance is a physiological condition where the insulin-dependent cells (i.e. muscle, adipose, brain, kidney, liver) fail to respond correctly to insulin signalling. While the body still produces insulin normally, insulin-dependent cells are unable to respond effectively to the action of insulin. As the primary role of insulin is to promote the absorption of glucose into cells, insulin resistance results in hyperglycemia and impaired glucose tolerance. Consequently, beta cells in the
  • 9.
    9 pancreas increase theirproduction of insulin, leading to hyperinsulinemia. Insulin resistance often progresses to type 2 diabetes, characterized by hyperglycemia and insulin resistance. Insulin resistance is a powerful risk factor and is associated with increased risk of cardiovascular disease. It also plays a central role in the development of the metabolic syndrome (Lechleitner 2008). The gold standard in assessing insulin resistance is the hyperinsulinemic-euglycemic clamp technique (Ayala et al. 2011). While this is the most accurate way of assessing insulin resistance, it is not typically used in the clinical setting due to complexity and possible dangers. Indirect measures of assessing insulin resistance also exist. An oral glucose tolerance test (OGTT) measures glucose tolerance and indirectly assesses insulin resistance by measuring the body’s response to glucose ingestion. Typically, in an OGTT, a baseline blood sample is taken before the subject ingests a glucose load, following which two additional blood samples are taken, one at 60 minutes and another at 120 minutes. Glucose and insulin concentrations at baseline, 60 minutes and 120 minutes are interpreted to asses if a subject is insulin resistant, or has impaired glucose tolerance (Table 1). TABLE 1 – Interpretation of an OGTT according to the World Health Organization (WHO) (Alberti & Zimmet 1998). Another method is to measure glycosylated hemoglobin (HbA1c), which assesses glycaemic control, and indirectly, insulin sensitivity (Hurley et al 2011). Abdominal obesity. Obesity, the result of a long-term positive energy balance, is a powerful risk factor associated with many chronic diseases. A long-term positive energy balance leads to the storage of excess adipose tissue. Abdominal obesity is the excess accumulation of adipose tissue around the area of the abdomen. An important component of abdominal 120-minute OGTT (plasma glucose) Interpretation < 7.8 mmol/L Non-diabetic 7.8-11.1mmol/L Impaired glucose tolerance/pre-diabetic ≥ 11.1 mmol/L Consistent with diabetes mellitus
  • 10.
    10 adiposity is visceralor intra-abdominal fat, which is adipose tissue located within the peritoneal cavity. Obesity, in particular abdominal obesity, is linked to insulin resistance, the development of cardiovascular disease, type 2 diabetes and the metabolic syndrome (Bechtold et al. 2006). Specifically, it is the adipocytokines released from visceral adipose tissue that are believed to be central to the development of insulin resistance, dyslipidemia and hypertension (Lechleitner 2008). Techniques such as computed tomography (CT), magnetic resonance imaging (MRI) and dual-energy x-ray absorptiometry (DXA) are used to assess abdominal obesity. Only MRI and CT can differentiate between visceral and subcutaneous adipose tissue (Scherzer et al. 2008). The severity of abdominal obesity can also be assessed by taking waist and hip circumference measurements. Android fat refers to fat located in the abdominal region. DXA software (EnCore) calculates fat mass in the android region, defined as the area over the abdomen, extending from the iliac crest toward the head for 20% of the distance from the iliac crest to the base of the skull (Stults-Kolehmainen et al. 2013). Subcutaneous and visceral fat are not differentiated within the android region however, various DXA regions of interest (ROI’s) in the abdomen have been shown to be reasonable surrogate measures of abdominal visceral adipose tissue (Miazgowski et al. 2014). Furthermore, while abdominal visceral adipose tissue is typically regarded as the most clinically significant fat depot, a 2011 study found that android fat is more closely related to the metabolic syndrome in the elderly than abdominal visceral adipose tissue (Kang et al. 2011). Therefore, investigating android fat as defined by DXA software provides vital data relevant to the study of insulin resistance, the metabolic syndrome and cardiovascular disease. Hypertension. Blood pressure (BP) is the pressure exerted by circulating blood against the walls of blood vessels. Blood pressure is expressed as systolic blood pressure (SBP) over diastolic blood pressure (DBP). Blood pressure is typically measured either manually with a mercury or aneroid sphygmomanometer, or automatically with a digital device. Hypertension is a physiological condition where blood pressure is elevated pathologically and chronically. Hypertension is a powerful risk factor for cardiovascular disease and is associated with coronary heart disease, coronary artery disease, peripheral artery disease and
  • 11.
    11 chronic kidney disease(Kannel 1996). There are different classifications of systolic and diastolic hypertension (Table 2). Evidence suggests that systolic blood pressure is a stronger predictor of cardiovascular events than diastolic blood pressure (Mourad 2008). TABLE 2 – Joint National Committee (JNC7 - United States) classification of blood pressure (The Seventh Report of the Joint National Committee on Prevention, Detection, Evaluation, and Treatment of High Blood Pressure 2004). Category Systolic blood pressure (mm/Hg) Diastolic blood pressure (mm/Hg) Normal <120 <80 Pre-hypertension 120-139 80-89 Hypertension stage 1 140-159 90-99 Hypertension stage 2 ≥ 160 ≥ 100 Dyslipidemia. Lipids such as fats, cholesterol and triglycerides, are naturally occurring molecules that are involved in storing energy and signalling processes. Lipoproteins are protein complexes that carry lipids, as lipids are mostly insoluble in liquid. Lipoproteins are classified by their relative density and size. Low-density lipoproteins (LDL) and high-density lipoproteins (HDL) are small and mainly transport cholesterol. Very low-density lipoproteins (VLDL) is another important lipid transporter, and is converted to LDL in the bloodstream. Total cholesterol (TC) is the measure of the total amount of cholesterol in blood, including LDL and HDL cholesterol. High plasma concentrations of certain lipids, such as triglycerides (TG), are associated with negative health outcomes and increased incidence of cardiovascular disease (Crook 2012). LDL cholesterol is the “bad” cholesterol, as it contributes to plaque and causes atherosclerosis. LDL cholesterol is an important risk factor for cardiovascular disease; evidence shows that LDL cholesterol levels are predictive of major cardiovascular events (Barter et al. 2007). HDL cholesterol is the “good” cholesterol. HDL cholesterol plays a cardioprotective role by removing cholesterol from the arteries and returning it to the liver (Crook 2012). Research shows that high concentrations of HDL cholesterol protect against
  • 12.
    12 cardiovascular disease andlow concentrations increase the risk of atherosclerotic diseases (Singh et al. 2007). The lipid profile refers to a panel of blood tests that assess lipid and lipoprotein levels. The lipid profile typically measures LDL cholesterol, HDL cholesterol, triglycerides and total cholesterol levels. Dyslipidemia refers to abnormal levels of lipids and lipoproteins associated with negative health outcomes, characterized by elevated LDL cholesterol, elevated total cholesterol, elevated triglyceride levels and decreased HDL cholesterol levels (Table 3) (Ahmed et al. 1998). TABLE 3 – Interpretation of lipid and lipoprotein levels according to the National Cholesterol Education Program (NCEP - United States) Adult Treatment Plan (ATP) – III; converted from mg/dl to mmol/L (Expert Panel on Detection, Evaluation, and Treatment of High Blood Cholesterol in Adults 2001). Level (mmol/L) Interpretation LDL Cholesterol < 2.6 Optimal 2.6 – 3.3 Near optimal 3.4 – 4.1 Borderline high 4.2 – 4.9 High > 4.9 Very high HDL Cholesterol < 1.0 Low ≥ 1.55 High (optimal) Total Cholesterol < 5.2 Optimal 5.2-6.2 Borderline High > 6.2 High Triglycerides < 1.7 Normal (optimal) 1.7-2.2 Borderline High 2.3-5.6 High >5.6 Very High
  • 13.
    13 2.1.3 Diagnosis The NationalCholesterol Education Program (United States) described their criteria definition for the clinical diagnosis of the metabolic syndrome in 2001, where an individual is diagnosed with the metabolic syndrome if they have 3 or more of the following risk factors: waist circumference ≥ 102 cm in men or ≥ 88 cm in women; triglycerides ≥ 150 mg/dl; HDL- C < 40 mg/dl in men and < 50 mg/dl in women; fasting glucose ≥ 110 mg/dl; blood pressure ≥ 135/85 mm Hg (Expert Panel on Detection, Evaluation, and Treatment of High Blood Cholesterol in Adults 2001). The majority of epidemiological and clinical studies in the literature have used the NCEP criteria definition of the metabolic syndrome (Lechleitner 2008). In 2005, the IDF formed their own criteria definition, which is similar to the NCEP definition, except that it describes abdominal obesity as the central component and contains ethnic-specific cut-off points for waist circumference (Alberti et al. 2005). In 2009, a consensus statement from the IDF and several other national and international organizations presented a revised criteria definition (Alberti et al. 2009). This revised definition includes ethnic specific values while also considering the role of drug treatment, but much like the 2005 definition, it follows the overall framework of the 2001 NCEP definition. 2.1.4 Prevalence The prevalence of the metabolic syndrome is increasing worldwide. The IDF approximates that about a quarter of the world’s adult population has the metabolic syndrome (Kaur 2014). Further, the prevalence of the metabolic increases with age. In the United States, approximately 7% of the population between 20 and 29 years old has the metabolic syndrome and this number rises to 44% in the age group of 60-69 years old (Ford et al. 2002). In Finnish individuals aged 45-64 years old, a cross-sectional study found that the metabolic syndrome was present among 38.8% of men and 22.2% of women (Ilanne-Parikka et al. 2004). The increasing prevalence of the metabolic syndrome is associated with the increasing prevalence of obesity. The prevalence of overweight and obese individuals is increasing in most developed countries (Flegal et al. 2002, Gutierrez-Fisac et al. 2000). The increasing predominance of the metabolic syndrome is also related to population aging. Population aging is taking place in almost all the countries in the world (United Nations Population Division 2013). Population aging results in increased proportions of older and elderly
  • 14.
    14 individuals in theoverall population. Changes in lifestyle habits as well as physiological changes put the elderly at increased risk of developing the metabolic syndrome (Bechtold et al. 2006). 2.1.5 Pathophysiology The pathophysiology of the metabolic syndrome is not completely clear. However, it appears to be attributable to insulin resistance and abdominal obesity (Lechleitner 2008). Insulin resistance is considered to be the link between abdominal obesity and the co-occurrence of hypertension and dyslipidemia. Abdominal obesity is strongly associated with insulin resistance (Byrne & Wild 2011, Lechleitner 2008). According to Byrne & Wild (2011), the common hypothesis for the development of insulin resistance is as follows: a long term positive energy balance leads to adipose tissue expansion and adipocyte hypoxia and death. This in turn causes macrophage infiltration and adipose tissue inflammation, resulting in impaired adipose tissue function. The ensuing adipocytokine dysregulation promotes the development of both local and systemic insulin resistance, while further disrupting adipose tissue function. The resulting insulin resistance then causes hypertension and dyslipidemia. Adipocytokines. Adipose tissue should be considered an endocrine organ, as it secretes proteins called adipocytokines, including leptin, adiponectin, resistin and inflammatory cytokines that are responsible for the regulation of various physiological processes related to energy metabolism, the immune response, inflammation and insulin sensitivity (Byrne & Wild 2011). The interaction between the adipocytokines released from adipose tissue and insulin-signalling pathways is central to the development of the metabolic syndrome. Evidence indicates that adiponectin promotes insulin sensitivity, while free fatty acids, leptin, resistin and pro-inflammatory cytokines promote insulin resistance (Lechleitner 2008). Adiponectin is released from adipose tissue, and promotes insulin sensitivity and the production of anti-inflammatory cytokines. Plasma adiponectin levels are low in insulin resistance (Byrne & Wild 2011). Leptin is produced in adipose tissue and regulates food intake, energy expenditure and hepatic glucose production. High plasma levels of leptin and leptin resistance characterize most forms of obesity (Lechleitner 2008). Tumor-necrosis factor alpha (TNF-α) and resistin are two other adipocytokines that effect insulin signalling. TNF-α promotes insulin resistance and importantly, it supresses adiponectin transcription
  • 15.
    15 (Byrne & Wild2011). Resistin has a potent effect on glucose metabolism in rats, and has an inhibitory effect on insulin action (Byrne & Wild 2011). Free fatty acids. Aside from adipocytokines, free fatty acids (FFA) may play a key role in the development of insulin resistance. It is hypothesized that the excessive flux of free fatty acids from adipose tissue during obesity alters substrate utilization in skeletal muscle, promoting insulin resistance (Byrne & Wild 2011). Furthermore, elevated free fatty acids may disrupt insulin signalling by decreasing glucose transporter type 4 (GLUT-4) (Boden & Shulman 2002). Free fatty acids are released from triglycerides in adipose tissue through the action of hormone-sensitive lipase, and from lipoproteins through the action of lipoprotein lipase (Lechleitner 2008). These mechanisms are both regulated by insulin, and insulin resistance further increases the release of free fatty acids from adipose tissue and disrupts the clearance of triglyceride-rich lipoproteins (Boden & Shulman 2002). Inflammatory mechanisms. Chronic inflammation may play an important role in obesity- related insulin resistance (Qatanani & Lazar 2007). There is strong evidence that systemic inflammation may be the causal link behind insulin resistance (Shoelson et al. 2006, Dandona et al. 2004). Biomarkers of inflammation such as interleukin-6 (IL-6) and C-reactive protein (CRP) circulate in high concentrations in insulin resistance. Furthermore, these inflammatory biomarkers predict the development of type 2 diabetes (Qatanani & Lazar 2007). One study has shown that the activation of inflammatory pathways in liver cells led to both local and systemic insulin resistance in mice (Cai et al. 2005). As mentioned previously, obesity is characterized by macrophage accumulation in adipose tissue. This inflammation contributes to the dysfunction of adipose tissue and the resulting production of adipocytokines is believed to cause insulin resistance (Byrne & Wild 2011). One study found that the inhibition of macrophage accumulation in the adipose tissue of mice improved insulin sensitivity (Kanda et al. 2006). Neural mechanisms. A neural component may be associated with obesity-related insulin resistance. Evidence shows that the brain receives information from adiposity signals like leptin and insulin and nutrients like fatty acids and in response sends signals to regulate
  • 16.
    16 substrate metabolism andeating behaviour (Qatanani & Lazar 2007). Two studies have shown a link between neural mechanisms and systemic insulin resistance in rats (Obici et al. 2002a, Obici et al. 2002b). Whether these same neural mechanisms are present in humans is unclear. Cell-intrinsic factors. In obesity, high circulating levels of fatty acids and other lipids result in the storage of triglycerides in muscles and the viscera, which has been termed “ectopic fat storage.” Ectopic fat storage is linked to insulin resistance; the mechanism is unclear, but it is likely related to the activation of harmful pathways related to mitochondrial dysfunction, oxidative stress and endoplasmic reticulum (ER) stress (Qatanani & Lazar 2007). Oxidative stress refers to the accumulation of harmful reactive oxygen species (ROS) (Qatanani & Lazar 2007). Oxidative stress correlates with fat accumulation in both humans and mice (Halliwell 1995). Furthermore, studies have shown that improving the ratio of anti- oxidants to ROS ameliorates insulin resistance in humans and rats (Konrad et al. 1999, Khamaisi et al. 1997). Mitochondrial dysfunction may also be linked to insulin resistance. It is thought to contribute to ectopic fat storage (Petersen & Shulman 2006). Furthermore, insulin resistance is associated with mitochondrial dysfunction and accompanied by high levels of triglycerides in the liver and muscle cells of elderly individuals (Petersen et al. 2003). Finally, obesity places a strain on the machinery of the endoplasmic reticulum, which triggers an ER stress response (Qatanani & Lazar 2007). This ER stress response disrupts the insulin signalling chain and causes insulin resistance (Ozcan et al. 2004). Furthermore, a 2005 study found that over-expression of ER protectors in mice protected against type 2 diabetes (Ozawa et al. 2005). Additionally, the ER stress response may augment oxidative stress (Qatanani & Lazar 2007). While the pathophysiology of obesity-related insulin resistance has not been completely elucidated, it is related to the components discussed above. As many of these components are inter-related, it is probable that they interact together to contribute to systemic insulin resistance. Alternatively, it is possible that one component plays a dominant role while the other are secondary.
  • 17.
    17 Insulin resistance andhypertension. There is a strong association between insulin resistance and hypertension. Evidence indicates that the link between diabetes and hypertension appears to be hyperinsulinemia, which commonly occurs with insulin resistance (DeFronzo & Ferrannini 1991). Hypertensive patients often have an increased plasma insulin response to an OGTT. Furthermore, the insulin resistance of essential hypertension correlates directly with the severity of the hypertension. Several mechanisms have been proposed to link insulin resistance and hypertension, such as sympathetic nervous system over-activity, sodium retention, proliferation of vascular smooth muscle cells and impaired membrane ion transport (DeFronzo & Ferrannini 1991). The relationship between insulin resistance and hypertension may be cause-effect. Insulin resistance promotes hypertension, but hypertension can also promote insulin resistance by modifying the transport of insulin and glucose to skeletal muscle (Salvetti et al. 1993). Insulin resistance and dyslipidemia. Insulin resistance and hyperinsulinemia are also associated with an adverse lipid profile. Elevated levels of plasma insulin promote VLDL formation, which results in hypertriglyceridemia (DeFronzo & Ferrannini 1991). The following breakdown of VLDL particles leads to increased formation of LDL cholesterol. Insulin resistance is also associated with low levels of HDL cholesterol (Rader 2007). Independent of its direct effects on plasma lipids and lipoproteins, insulin itself has been shown to be atherogenic (DeFronzo & Ferrannini 1991). Insulin promotes the transport of cholesterol into the arteriolar smooth muscle and slows the reversion of lipid plaques. The excessive flux of FFA from adipose tissue also promotes dyslipidemia (Rader 2007). FFA stimulate the synthesis of triglycerides in the liver, which in turn results in the secretion of VLDL particles. Furthermore, evidence suggests that the adverse lipid profile associated with type 2 diabetes is related to the excessive flux of FFA (Mooradian 2009). The severity of insulin resistance may explain the severity of dyslipidemia; a study examining obese individuals found that the degree of insulin resistance explained a significant amount of the adverse fluctuations in triglycerides, LDL cholesterol and HDL cholesterol (Steinberger et al. 1995). Insulin resistance and the elderly. The prevalence of the metabolic syndrome is highest among the elderly. This is partially attributable to age-related changes in body composition,
  • 18.
    18 such as increasesin fat mass and decreases in fat-free mass that enhance insulin resistance (Lechleitner 2008). Furthermore, the aging of adipocytes may impair their ability to store lipids. Finally, mitochondrial dysfunction may enhance the age-related increase in insulin sensitivity. While the pathophysiology of the metabolic syndrome has not been completely described, the behaviours linked to its development are apparent. Cigarette smoking, physical inactivity and atherogenic diets are all strongly linked to obesity and the metabolic syndrome (Hurley et al. 2011). In addition, genetics appear to play a key role, as it seems that there is a heritability component of the metabolic syndrome (Pollex & Hegele 2006). 2.1.6 Consequences The metabolic syndrome is associated with increased risk of type 2 diabetes and cardiovascular disease, along with numerous other disease outcomes such as atherosclerosis, fatty liver, polycystic ovary syndrome, gallstones, asthma, sleep apnea and selected malignant diseases (Byrne & Wild 2011). The risk for diabetes is increased about 5-fold and the risk for cardiovascular events about 2-fold for those with the metabolic syndrome (Lechleitner 2008). The pooled relative risk of all-cause mortality is approximately 50% higher in those with the metabolic syndrome (Wu et al. 2010). Importantly, the metabolic syndrome appears to be a better predictor of negative health outcomes than its individual components; a 2004 prospective cohort study following 6255 individuals between the ages of 30 and 75 years old showed that the metabolic syndrome was more strongly associated with cardiovascular disease and overall mortality than its individual risk factors alone (Malik et al. 2004). 2.1.7 Management The management of the metabolic syndrome is multifactorial. The prevention or reduction of obesity should be a primary objective. Management of obesity typically consists of increasing exercise levels, modifying lifestyle behaviours, using pharmacological agents and undergoing surgery (Bechtold et al. 2006). Similarly, food logs and meal planning advice have been shown to be beneficial in promoting and maintaining weight loss (Bechtold et al. 2006). Reductions in obesity improve components of the metabolic syndrome (Lechleitner
  • 19.
    19 2008). Therefore, lifestyleinterventions should be the primary step in the management of the metabolic syndrome. 2.2 Resistance training 2.2.1 Description Resistance training (RT) comprises of “any activity that causes muscles to contract against external force” (Sundell 2011). The primary goal of resistance training is to overload the musculoskeletal system, in attempts to develop the strength and mass of skeletal muscles. Weight machines, dumbbells, barbells, resistance bands, body mass and weighted clothes are typically used as resistance. A RT protocol encompasses the following variables: muscle actions used, resistance type used, total number of sets and repetitions (volume), muscle groups trained, sequence of exercise performed, length of rest intervals, repetition velocity and training frequency (Kraemer & Ratamess 2004). These variables are manipulated to maximize outcomes and achieve specific goals. The health benefits of RT are numerous. RT primarily increases strength and muscle mass, as well as enhancing bone health by increasing bone mineral density (Layne & Nelson 1999). RT also develops the strength of ligaments, tendons, joint cartilage and connective tissue sheaths within muscles. Evidence also suggests that RT reduces the incidence of injury in sport (Fleck & Falkel 1986). Finally, research shows that RT improves body composition, physical performance, functional independence, movement control, cognitive abilities and self-esteem (Levinger et al. 2007, Westcott 2012). 2.2.2 Resistance training in the elderly Aging is associated with losses in muscle and strength. Research shows that this loss in muscle mass is approximately 0.46 kilograms per year, from the fifth decade onwards (Strasser & Schobersberger 2011). The degenerative loss of muscle mass with aging is termed sarcopenia, and is associated with physiological and functional declines that lead to increased fragility and disability. Strong evidence supports the role of resistance training in slowing and preventing age-related losses in muscle mass and strength (Strasser & Schobersberger 2011, Tresierras & Balady 2009, Hurley et al. 2011). Furthermore, research shows that RT reduces frailty and weakness, while increasing independence and improving
  • 20.
    20 the functional capacityof older and elderly individuals (Galvao & Taaffe 2005, DiFrancisco- Donoghue et al. 2007). Consequently, resistance training is particularly important for elderly populations. 2.2.3 Resistance training and disease prevention The positive effect of RT on the musculoskeletal system has long been evident, however in recent years, more emphasis has been placed on the role of RT in disease prevention (Hurley et al. 2011). Cross-sectional studies show that muscle mass is inversely correlated with all- cause mortality and with the prevalence of the metabolic syndrome (Strasser & Schobersberger 2011). Skeletal muscle is a primary target for glucose and triglyceride disposal. Furthermore, it is a critical component of resting metabolic rate. Research suggests that maintaining a large, active muscle mass improves metabolic and cardiovascular risk factors, such as insulin resistance, obesity and hypertension (Strasser & Schobersberger 2011). Therefore, the consequences of age-related losses in muscle mass are apparent. Reduced muscle mass leads to reduced metabolic rate and reduced capacity for lipid oxidation, along with increased abdominal fat mass (Strasser & Schobersberger 2011). The role of aerobic training in reducing cardiometabolic markers has been well established, but the role of RT remains less clear (Tresierras & Balady 2009). Nonetheless, there is a growing body of evidence demonstrating that RT may play an important role in both the prevention and treatment of chronic disease (Hurley et al. 2011, Tresierras & Balady 2009, Strasser & Schobersberger 2011). 2.3 Resistance training and the metabolic syndrome 2.3.1 Insulin resistance and glucose tolerance Cross-sectional studies show that low strength and muscle mass are associated with type 2 diabetes (Park et al. 2006, Park et al. 2007, Park et al. 2009). Both muscle strength and muscle quality are inferior in those with diabetes. Furthermore, poor muscle quality is associated with impaired glycemic control (Park et al. 2006). In a study where adults were followed over the course of three years, those with diabetes showed greater losses in muscle mass and strength than those without diabetes (Park et al. 2007).
  • 21.
    21 There is alarge body of evidence that suggests that RT improves insulin sensitivity and glucose tolerance, regardless of the characteristics of the subjects or the training protocol. RT has been shown to improve markers of insulin action and glycemic control in those with type 2 diabetes (Baldi & Snowling 2003, Cauza et al. 2005, Ibanez et al. 2005, Ishii et al. 1998, Sigal et al. 2007, Bweir et al. 2009). For instance, a randomised controlled trial (RCT) investigating the effect of RT in older Latino men and women showed improved glycosylated hemoglobin (HbA1c) levels after performing progressive resistance training 3 times a week for 16 weeks (Castaneda et al. 2002). While the reduction in HbA1c was modest, a prospective observational study has shown that small changes in HbA1c are associated with large changes in health outcomes (Stratton et al. 2000). For example, a 1% increase in HbA1c represents a 21% increase in the risk for diabetes death, 14% increase for the risk of myocardial infarction and a 37% increase in the risk for microvascular complications. A meta-analysis published in 2006 examined the effect of different training modalities (aerobic training (AT), RT or combined) on glucose control in those with type 2 diabetes (Snowling & Hopkins 2006). 27 studies examining the effect of training on HbA1c were included in the analysis. The overall benefits were small, however there was a mean decrease of approximately 0.8 of a unit percent of HbA1c with AT and 0.5 of a unit percent decrease with RT, when the training protocols lasted longer than 12 weeks. While the benefits appear modest, as previously mentioned, small changes in HbA1c are associated with large changes in health outcomes. Furthermore, according to the authors, the benefits of AT and RT were comparable to those reported for dietary or drug treatments. Similar results can also be seen with healthy subjects (Miller et al. 1984, Miller et al. 1994). Using an OGTT and the hyperinsulinemic-euglycemic clamp technique, Miller et al. (1994) investigated the effects of a 16-week RT protocol performed 3 times a week in healthy, middle-aged men. Insulin action was improved and plasma insulin levels were reduced in the OGTT following the training intervention (Figure 1) although there was no change in plasma glucose responses to the OGTT (Figure 2).
  • 22.
    22 FIGURE 1 –Plasma insulin response to an OGTT, before (open circles) and after (shaded circles) RT. Insulin levels were significantly lower following training (Miller et al. 1994). FIGURE 2 – Plasma glucose response to an OGTT, before (open circles) and after (shaded circles) RT. There was no significant difference between the glucose response before and after training (Miller et al. 1994).
  • 23.
    23 A meta-analysis examiningthe effects of RT on HbA1c concluded that RT positively influences glucose tolerance (Strasser et al. 2010). Importantly, they noted that the greatest reductions in HbA1c were found when baseline levels were above 8.0%. While improvements in glucose tolerance and insulin resistance have been seen following RT in both diabetic and healthy subjects, this result suggests that diabetic subjects, or subjects with pre-diabetes (impaired glucose tolerance), experience the greatest response to RT. An array of studies, using a variety of protocols, ranging from short-term to long-term, low- volume to high-volume and low-intensity to high-intensity, have revealed improvements in insulin sensitivity and glucose tolerance following RT (Table 4). It is unclear if there is a certain RT protocol that is best designed to generate effective improvements in insulin resistance and glucose tolerance. However, in the meta-analysis of Snowling & Hopkins (2006), significant improvements in glucose tolerance only became evident with RT protocols lasting longer than 12 weeks. This result indicates that there may be a relationship between RT protocol length (total number of weeks) and glucose tolerance, as longer lasting protocols appear to have a more pronounced effect on glucose tolerance. Similarly, the meta-analysis of Strasser et al. (2010) reported that that protocols of longer duration (>10 weeks) resulted in greater improvements in glucose tolerance. There is a large volume of studies showing improvements in insulin resistance and glucose tolerance following a RT protocol; however, there are studies that do not show similar improvements. In one study, 4 months of home-based RT using exercise bands in type 2 diabetics resulted in no improvements in HbA1c (Cheung et al. 2009). It is possible that the exercise bands did not provide an adequate stimulus to invoke significant change; this combined with the fact that RT sessions were not supervised, may explain the lack of improvement in glucose tolerance. Elsewhere, 12 weeks of high intensity (75-80% 1RM) RT performed 3 times a week did not cause improvements in HbA1c in elderly subjects (Geirsdottir et al. 2012). The authors suggested that the lack of a significant improvement in glucose tolerance was related to the relatively low baseline levels of HbA1c (6.8%) of their subjects. According to the meta-analysis of Strasser et al. (2010), the greatest improvements in HbA1c resulting from RT are seen when baseline levels are above 8.0%.
  • 24.
    24 TABLE 4 –The details of training protocols that have induced improvements in insulin resistance and/or glucose tolerance. While the literature supports the role of RT in improving insulin sensitivity and glucose tolerance, the underlying physiological mechanisms are unclear. Changes in body composition are a common hypothesis. Skeletal muscle is a primary target for insulin- stimulated glucose uptake. Furthermore, skeletal muscle is the main tissue responsible for Authors Length (total weeks) Frequency (sessions per week) Volume (sets x reps) Intensity (relative to 1RM) Outcome Brooks et al. 2007 16 3 3 x 8 60-80% 1RM Reduced insulin resistance Castaneda et al. 2013 16 3 3 x 8 60-80% 1RM Improved HbA1c Egger et al. 2013 8 Not shown Group 1: 2 x 10- 12 Group 2: 25-30 Group 1: 70% 1RM Group 2: 40% 1RM Improved glycemic control in both group 1 and 2; no difference between groups Ibanez et al. 2005. 16 2 First 8 weeks: 3-4 sets of 10-15 Last 8 weeks: 3-5 sets of 5-6 reps First 8 weeks: 50-70% of 1RM Last 8 weeks: 70-80% 1RM Improved insulin sensitivity Ishii et al. 1998 4-6 5 2 x 10-20 40-50% 1RM Improved insulin sensitivity Miller et al. 1984 10 3 3 x 8 8RM Improved insulin levels
  • 25.
    25 the increase inglucose metabolism following exercise and hyperinsulinemia (DeFronzo et al. 1981). Castaneda et al. (2002) found that changes in glycemic control were associated with changes in strength and muscle mass. There was an inverse correlation between HbA1c and both whole-body strength and lean tissue mass. Another study showed that changes in fasting glucose and HbA1c levels after a 10-week RT program were inversely correlated to changes in fat-free mass in obese, type 2 diabetic men (Baldi & Snowling 2003). Obesity is associated with the development of insulin resistance. Therefore, it seems likely that a decrease in fat mass would result in increased insulin action. However, increases in insulin-stimulated glucose uptake have been demonstrated following RT, even when corrected for changes in fat mass (Tresierras & Balady 2009). Aerobic training has a known beneficial effect on insulin action and glucose tolerance (Tresierras & Balady 2009). These improvements appear to be related to increases in GLUT- 4 content, protein kinase B content (PKB) and glycogen synthase (GS) activity, as well as changes in muscle fiber type and in oxidative and non-oxidative enzyme activity. It is possible that these adaptations are also responsible for the improvements occurring with RT. A MEDLINE Plus/Ovid literature search of studies published between 1950 and 2008 suggested that changes in insulin sensitivity following RT were not solely related to changes in FM or LM, but also related to qualitative changes in skeletal muscle (Tresierras & Balady 2009). Changes in adipocytokines, pro-inflammatory cytokines and other immune system biomarkers have also been proposed to be associated with RT-induced changes in insulin sensitivity. For example, improvements in insulin sensitivity seen after a 16-week RT program in Hispanic older adults with type 2 diabetes were related to lower levels of inflammatory markers. However, this remains a controversial point as changes in insulin sensitivity have been found following RT without corresponding changes in adipocytokines or inflammatory marker levels (Klimcakova et al. 2006, Reynolds et al. 2004) 2.3.2 Abdominal Obesity Numerous studies have reported reductions in fat mass (FM) following RT protocols in both obese and non-obese subjects (Miller et al. 1984, Pratley et al. 1994, Campbell et al. 1994, Hunter et al. 2000, Castaneda et al. 2002, Schmitz et al. 2003). Since the reduction in fat
  • 26.
    26 mass is oftenaccompanied by an increase in lean mass (LM), there is often no change in body weight. Therefore, RT is sometimes overlooked as a therapy for obesity, despite the beneficial influence it has on body composition. Increases in LM have important consequences as LM is closely related to resting metabolic rate. An estimated 5 kg increase in LM translates to an estimated increase in energy expenditure of 100 kcal per day (Strasser & Schobersberger 2011). This is especially noteworthy when considering that aging is associated with rapid losses in muscle mass. Maintaining a large, active muscle mass can mitigate the effects of aging and improve body composition. Studies specifically investigating RMR have demonstrated that RT can increase RMR, even in older and elderly populations (Campbell et al. 1994, Pratley et al. 1994). The role of RT in improving body composition is also significant when considering calorie restriction diets. Calorie restriction diets have been shown to be effective in inducing weight loss although they are also associated with reductions in LM and RMR (Tresierras & Balady 2009). The effects of a diet only (DO) intervention was compared with a combined diet and RT (DR) intervention in 33 obese men (Ross et al. 1996). Similar reductions in body weight were achieved in both DO and DR groups; however, only the DR group saw a preservation of skeletal muscle volume – skeletal muscle volume was significantly decreased in the DO group. Not only does RT reduce total body FM, but evidence also suggests that RT targets visceral fat located in the abdomen. For instance, 16 weeks of RT performed 3 times a week using variable resistance machines resulted in reductions in visceral fat in both men and women, with concurrent increases in LM (Treuth et al. 1994, Treuth et al. 1995). Similarly, Ibanez et al. (2005) reported a 10.3% reduction in visceral fat following 16 weeks of progressive RT performed 2 times a week in older men with type 2 diabetes. 16 weeks of RT is also effective in diminishing visceral fat when combined with dietary interventions (Ross & Rissanen 1994, Ross et al. 1996, Rice et al. 1999). Evidence suggests that RT can prevent the regain of visceral adipose tissue following weight loss (Hunter et al. 2010). Women followed a calorie restriction diet and lost weight for 1 year. After the year of weight loss, subjects were divided into a RT or control group for a 1-
  • 27.
    27 year follow-up. Thosenot exercising in the follow-up experienced a 38% increase in visceral fat while there was no increase in visceral fat in the RT group. In this literature review, an array of studies using a variety of protocols, ranging from short- term (12 weeks) to long-term (48 weeks), low-volume (5 reps per set) to high-volume (12 reps per set) and low-intensity (60% 1RM) to high-intensity (85% 1RM), were investigated in attempts to understand better the effects of RT on body composition. It is unclear if there is a certain RT protocol that is best designed to produce effective reductions in FM. However, it is noteworthy that all the studies described presently revealing reductions in visceral fat following RT used protocols lasting 16 weeks or longer in length. One study investigating the effects of a 12-week, 3 times a week, low-intensity RT protocol using resistance bands found no reductions in visceral fat in type 2 diabetics (Kwon et al. 2010). The lack of a significant reduction in visceral fat may be attributable to the lower duration of the protocol compared to those reported above, suggesting that there is a relationship between RT protocol length and visceral fat. Alternatively, it may be related to the low-intensity nature of the resistance bands used. 2.3.3 Blood pressure Evidence from cross-sectional studies indicate that strength-trained athletes tend to have normal resting blood pressure levels (Goldberg 1989, Byrne & Wilmore 2000). Two meta-analyses, one from 2000 and the other from 2005, searched the literature for studies examining the effect of RT on BP (Kelley & Kelley 2000, Cornelissen & Fagard 2005). Each meta-analysis had similar search inclusion strategies; studies had to be randomised controlled trials, RT had to be the only intervention, the intervention had to be 4 weeks or longer and subjects had to be normotensive or hypertensive, sedentary adults. The meta-analysis from 2000 included studies from 1966 to 1998, totalling 320 subjects. The results showed a significant mean decrease of 3 mmHg for both SBP and DBP, as a result of the RT. This was equated to a 2% decrease in SBP and 4% decrease in DBP. The meta- analysis from 2005 included studies from 1996 to 2003, totalling 341 subjects. The result of the meta-analysis was similar to that of Kelley & Kelley (2000); the overall effect of RT was a mean decrease of 3.2 mmHg in SBP and 3.5 mmHg in DBP. While RT appears to have only a modest BP-reducing effect, small changes can have major consequences. A 3 mmHg
  • 28.
    28 reduction in SBPis estimated to decrease the risk of cardiac morbidity by 5 - 9%, stroke by 8 - 14% and all-cause mortality by 4% (Whelton et al. 2002). The majority of studies in the literature suggest that RT has a beneficial effect on BP; however, there are studies that reveal no significant changes in SBP or DBP following RT (Cononie et al. 1991, Smutok et al. 1993, Honkola et al. 1997). In addition, the meta-analysis of Strasser et al. (2010) concluded that RT has a positive influence on SBP, but not DBP; their analysis of 13 RCTs revealed no statistically significant effect of RT on DBP. Genetics may affect the response of BP to RT (Hurley et al. 2011). In an unpublished study described in Hurley et al. (2011), older men and women with a specific genotype within their angiotensin II type 1 receptor and angiotensionogen gene experienced the greatest reduction in BP after RT, in comparison with those with other genotypes at this loci. Both the meta-analysis of Kelley & Kelley (2000) and Cornelissen & Fagard (2005) noted that there is a small volume of research examining the effects of RT on BP in individuals with hypertension; studies that have suggest that RT has a beneficial effect on those with varying levels of prehypertension or hypertension (Martel et al. 1999, Harris & Holly 1987, Hagberg et al. 1984, Collier et al. 2008, Miura et al. 2015). In addition, acute bouts of RT appear to invoke a hypotensive response (Fisher 2001, Hardy & Tucker 1998). This response was present in both normotensive and prehypertensive subjects. In this literature review, an array of studies using a variety of RT protocols, ranging from short-term (4 weeks) to long-term (24 weeks) and low intensity (40% 1RM) to high-intensity (80% 1RM), were investigated in attempts to better understand the effects that RT has on BP. It is unclear whether there is a certain RT protocol that is best designed to improve BP, however, Strasser et al. (2010) identified a possible relationship between RT volume and frequency and improvements in BP. They noted that higher frequency protocols (3 times a week versus 2 or less) with greater volumes (9 sets per muscle group per week or more) resulted in the most effective reductions in BP. If RT does truly improve BP, the underlying physiological mechanisms are unclear. According to Komi (2003), reductions in BP are likely related to decreased body fat and changes in sympathoadrenal drive. In his review, Goldberg (1989) investigated possible mechanisms. He determined that changes in BP due to RT were likely a result of one or a
  • 29.
    29 combination of thefollowing adaptations: reduced heart rate, increased insulin sensitivity, increased muscle mass and strength and decreased body fat and body salt levels. 2.3.4 Lipid Profile Cross-sectional studies provide little insight into the effect of RT on the lipid profile. For instance, one cross-sectional study showed that HDL cholesterol values in male strength athletes are comparable to that of endurance athletes (Yki-Jarvinen et al. 1984). However, another found that strength athletes have reduced HDL cholesterol values in comparison to endurance athletes (Clarkson et al. 1981). The results from longitudinal studies and randomised controlled trials are also inconclusive. Some studies show that in men and women with normal lipid profiles, a short-term RT protocol improves levels of TC, LDL cholesterol, HDL cholesterol and TG (Goldberg et al. 1984, Hurley et al. 1988). However, other investigations have revealed no reduction in dyslipidemia after RT (Manning et al. 1991, Smutok et al. 1993, LeMura et al. 2000, Staron et al. 2000, Dunstan et al. 2002). There exists several studies, suggesting that RT improves the lipid profile, that have been criticized in subsequent review articles for not using proper controls to isolate the independent effect of RT (Komi 2003, Hurley 1989, Hurley et al. 2011). Inadequate control of age, diet and training program has been identified, as well as not considering the acute effects of the last RT session. The review of Hurley et al. (1989) concluded that when studies are properly controlled, the majority show no significant improvement in the lipid profile following RT. Similarly, another review came to the same conclusion, affirming that RT has little influence on the lipid profile in middle-aged and older individuals (Braith & Stewart 2006). A meta-analysis examining studies from 1955 to 2007, representing 1329 men and women, found that RT lowered total cholesterol, LDL cholesterol and triglyceride values (Kelley & Kelley 2009). However, included in this meta-analysis were some of the studies that were criticized by Hurley et al. (1989), Braith & Stewart (2006) and Hurley et al. (2011). Despite the large body of evidence that suggests that RT has little or no effect on the lipid profile, there are some well-controlled studies that show otherwise. For instance, one study investigating the effects of an 11-week RT protocol (8RM) in healthy, elderly women
  • 30.
    30 concluded that RTpositively influences the lipid profile (Fahlman et al. 2002). They revealed elevated HDL levels and reduced LDL, TC and TG levels in the intervention group compared to the control group. Elsewhere, Asian Indians with type 2 diabetes performed 12 weeks of progressive resistance training (Misra et al. 2008). There was a significant decline in both total cholesterol and triglycerides in the intervention group. It is noteworthy that both these independent studies revealed a reduction in TG following RT, as elevated TG is a component of the criteria definition of the metabolic syndrome. There are few investigations into the effect of RT in subjects with dyslipidemia alone. A single study examined the influence of 20 weeks of high-volume (15-20 RM) RT in subjects with abnormal lipid profiles, in combination with at least two other markers for coronary heart disease (Kokkinos et al. 1991). The results revealed no significant changes in TG, TC or HDL. The effect of RT on the lipid profile remains controversial. Further, it is unclear if there is a particular RT protocol that is best designed to produce improvements in the lipid profile. In this literature review, an array of studies using a variety of RT protocols, ranging from short- term (11 weeks) to long-term (24 weeks) and low-intensity (40% 1RM) to high-intensity (85% 1RM), have been investigated in attempts to elucidate the effect that RT has on the lipid profile. Evidence suggests that high-volume, low-intensity RT protocols may be the most effective in improving HDL levels (Strasser et al. 2010). For instance, one study using high-volume, low-intensity (40-60% RM) RT resulted in improvements in HDL after 1 year of exercise (Balducci et al. 2004). Conversely, two studies using higher intensity RT protocols (70-80% RM and 75-85% RM) revealed no improvements in HDL (Castaneda et al. 2002, Dunstan et al. 2002). In addition, a study investigating the acute effects of RT of varying intensities found a similar result (Lira et al. 2010). The low-intensity groups (50% 1RM and 75% 1RM) experienced the greatest acute improvements in the lipid profile in comparison to the high-intensity groups (90% 1RM and 110% 1RM). According to the meta- analysis of Strasser et al. (2010), there may also be a relationship between RT frequency and improvements in the lipid profile. They identified a study that revealed that improvements in LDL and TG were greater when subjects performed RT 2 times a week, rather than 3 (Honkola et al. 1997).
  • 31.
    31 If RT doesindeed improve the lipid profile, the underlying physiological mechanisms are unclear. Improvements may be related to changes in the oxidative capacity of skeletal muscle due to a shift from type 2b fibers to type 2a, or an increase in the number of capillaries per muscle fiber. Changes in body composition, specifically reductions in fat mass, have also been proposed (Komi 2003). 2.3.5 Mechanisms Resistance training appears to enhance the cardiometabolic profile and improve markers of the metabolic syndrome. However, the physiological mechanisms underlying these improvements have not been completely elucidated. In this review of the literature, changes in muscle strength and muscle quality, as well as changes in body composition, have consistently emerged as possible mechanisms. Changes in adipocytokines, pro-inflammatory cytokines and other immune system biomarkers may also be involved. As many of these potential mechanisms are inter-related, it is probable that they interact together to improve markers of the metabolic syndrome. Alternatively, it is possible that one component plays a dominant role while the others are secondary. 2.3.6 Dose-response relationship When investigating the use of RT as a tool to prevent and/or treat chronic disease, it is important to consider the dose-response relationship. In other words, it is necessary to know how much RT is needed (in terms of the length, frequency, volume and duration of RT) to invoke a clinically significant, meaningful improvement in cardiometabolic risk factors. This literature review has attempted to identify any possible dose-response relationship between RT and improvements in risk factors for the metabolic syndrome. Possible dose- response relationships were identified between:  RT protocol length and improvements in glucose tolerance (2.3.1)  RT protocol length and reductions in visceral fat (2.3.2)  RT protocol volume and frequency and improvements in BP (2.3.3)
  • 32.
    32  RT protocolvolume and frequency and improvements in the lipid profile (2.3.4) Overall, it is unclear whether there is a certain RT protocol that is best designed to induce effective improvements in risk factors for the metabolic syndrome in the elderly; however, from this review, it does appear that there exists some dose-response relationship between RT and cardiometabolic risk factors. A lack of time is the most commonly cited barrier to physical activity and exercise (Sallis JF 1999). Older adults and the elderly often identify physical activity as time consuming (Chao, et al. 2000). Therefore, it is important to identify the minimal amount of RT needed (smallest dose) to produce meaningful, health-promoting changes in risk factors for the metabolic syndrome. The vast majority of studies investigating the effects of RT on risk factors for the metabolic syndrome use RT protocols lasting 16 weeks or more in length (Brooks et al. 2006, Castaneda et al. 2002, Cauza et al. 2005, Sigal et al. 2007, Smutok et al. 1993, Cheung et al. 2009, Reynolds et al. 2004, Ryan et al. 2001, Pratley et al. 1994, Hunter et al. 2002, Schmitz et al. 2003, Treuth et al. 1994, Treuth et al. 1995, Balducci et al. 2004, Dunstan et al. 2002, LeMura et al. 2000, Kokkinos et al. 1991, Honkola et al. 1997, Cononie et al. 1991, Martel et al. 1999). Those using shorter lasting protocols typically use RT frequencies of 3 times a week or more (Baldi & Snowling 2003, Ishii et al. 1998, Bweir et al. 2009, Miller et al. 1984, Geirsdottir et al. 2012, Klimcakova et al. 2006, Campbell et al. 1994, Kwon et al. 2010, Manning et al. 1991, Fahlman et al. 2002, Misra et al. 2008, Harris & Holly 1987). Overall, in the literature, the total number of RT sessions per study ranges from approximately 27- 156 session, with the average being ~48 sessions. There are a very limited number of studies investigating the effects of RT on cardiometabolic risk factors using short-term (<16 weeks) and low frequency (<3 times a week) protocols; only two studies have been identified (Staron et al. 2000, Miura et al. 2015). Staron et al. (2000) found that 16 sessions of RT (8 weeks x 2 times a week) did not alter lipid levels in young, healthy males. Miura et al. (2015) reported that 24 RT sessions (12 weeks x 2 times a week) improved BP in older women. It is important to note that the circuit RT was
  • 33.
    33 performed in conjunctionwith recreational/aerobic activities; therefore, the study did not investigate the effects of RT alone.
  • 34.
    34 3 AIMS OFTHE STUDY 3.1 Research questions and hypotheses The effect of resistance training on risk factors for the metabolic syndrome has not been completely elucidated. While the majority of studies suggest that RT has a positive effect on these risk factors, there are some contradictory results. Further, the positive changes after RT are often statistically significant, but questions can be asked of their clinical significance. The mechanisms by which RT exerts a positive effect on risk factors for the metabolic syndrome are controversial. Further, the smallest dose of RT needed to exert a meaningful effect on these risk factors is unclear. Therefore, the primary aims of the study are: 1) To investigate the effects of a short-term, high-repetition resistance training protocol with short rest periods on risk factors for the metabolic syndrome in an untrained, heterogeneous elderly population 2) If there are improvements in risk factors for the metabolic syndrome following RT, attempt to identify if they are clinically significant The secondary aims of the study are: 1) Investigate the physiological mechanisms underlying changes following RT 2) To consider the results in the context of the dose-response relationship 3) To consider the outcomes of the study in terms of practical application in attempts to make recommendations about exercise prescription and participation. It is expected that the RT protocol used presently will improve strength and muscle mass. Whether RT will influence risk factors for the metabolic syndrome in a meaningful way is unclear. Any precise hypothesis regarding underlying mechanisms and the dose-response relationship are not realistic at this point in time.
  • 35.
    35 4 METHODS 4.1 Subjects Aletter was sent out in October 2014 to 2000 individuals between 65 and 75 years old in the Jyväskylä region. Information about the individuals was received from the central records bureau (Väestorekisterikeskus). From the 2000 letters sent out, 450 individuals registered for the study, 140 attended an information session and 115 signed informed consent forms and were medically screened. The medical examination was completed in January 2015. To participate in the study, individuals had to meet the following exclusion criteria:  Be between 65 and 75 years old  On average, perform less than 3 hours of aerobic/endurance training a week  Have no experience in resistance training  No smoking  No lower limb disabilities (cartilage damage, replaced joints etc.)  Non-obese (<30 BMI)  No testosterone therapy in the past 10 years  No adverse reactions to exercise in the past 6 months One hundred one individuals were cleared to participate in the study. The sample study (n=101) was divided into a training group (n=79) and a control group (n=22) (Table 5). The study was performed in accordance with the Declaration of Helsinki and was approved by the University of Jyväskylä Ethical Committee. Anthropometric data, including standing height (wall-mounted tape measure, accuracy 0.01 m) and weight (digital scale, accuracy 0.1 kg, Seca 708, Seca, Espoo, Finland), were assessed pre-training. Body mass index was calculated using the formula: BMI = Body mass (kg) Height2 (m)
  • 36.
    36 TABLE 5. Thebody composition, anthropometric and sex characteristics of the study sample, training group and control group. Study Sample Training Group Control Group Mean ±SD Mean ±SD Mean ±SD Age (yrs.) 69.3 ±2.7 69.3 ±2.8 69.3 ±2.3 Body mass (kg) 77.8 ±13.8 79.0 ±14.4 74.0 ±11.2 Height (m) 1.67 ±0.09 1.67 ±0.09 1.67 ±0.09 BMI 27.6 ±3.7 28.0 ±3.9 26.3 ±2.4 Sex 56 female, 45 male 45 female, 34 male 11 female, 11 male 4.2 Experimental design 4.2.1 Overall design The experimental design of the study can been in Figure 3. FIGURE 3 – The experimental design of the study. Baseline measurements were completed in February 2015 on all participating subjects. Following baseline measurements, subjects in the training group began the training protocol in March 2015, while subjects in the control group maintained their normal daily activities. The training group completed 12 weeks/3 months of training, ending in May 2015. Post- training measurements were completed on all participating subjects in June 2015. Subjects in the training and control groups were instructed to maintain their normal daily physical
  • 37.
    37 activity and dietaryhabits external to the imposed testing and training of the study, throughout the duration of the study. 4.2.2 Training Protocol The training protocol was carried out in the gym of the Liikunta building at the University of Jyväskylä. Resistance training was performed in the gym using commercial resistance machines, cable and pulley systems and free weights (dumbbells). Supervisors, who ensured that subjects were performing the session according to protocol, as well as simultaneously monitoring their health and safety, attended training sessions prior to the beginning of the training protocol. Supervisors also monitored exercise technique and encouraged subjects to progressively overload during training. Before the training protocol began, the subjects attended an information session explaining the essential principles and fundamentals of resistance training, as well as the complete training protocol. Before each training session, subjects completed a short warm-up protocol consisting of light aerobic exercises and some added flexibility exercises. Each training session was designed to last approximately 1 hour. Subjects were instructed to allow for at least 48 hours of rest between training sessions. The overall training program was broken down into 3 mesocycles (1 mesocycle = ~4 weeks). Before each mesocycle, subjects were given written instructions on the details of the protocol. Further, supervisors were knowledgeable of the protocol for each mesocycle so that they were able to advise the subjects in the gym if questions arose. The details of the protocol for a given mesocycle included: the aim of the protocol, the exercises to complete, the number of repetitions and sets to complete, and the length of rest periods to observe. Subjects were to follow the protocol meticulously, and to record their training information (i.e. loads/resistances etc.) in personal training logs kept in a locked room at the gym. Supervisors constantly monitored training logs to ensure primarily that the subjects were progressing appropriately. During each mesocycle, a pre-set range of repetitions (i.e. 16-20) was given to the subjects. Subjects were instructed to determine the load where concentric failure would occur during
  • 38.
    38 at least oneset before they could complete all the reps in that range. Therefore, subjects were expected to be continually increasing their loads used during a mesocycle. During the 12-week (3 mesocycles) training period, the training group (n=79) performed high-repetition, full-body resistance training twice a week (2x) with limited rest between sets, focussing primarily on local muscular endurance. The complete details of the training protocol are shown in Table 6. TABLE 6 – The complete details of the training protocol. The letter describes the exercise completed: M denotes machine, p denotes pulley/cable, d denotes dumbbells and bw denotes body weight. The exercises listed per mesocycle were split into two separate training sessions. Week Goal/Aim of protocol Exercises Repetitions (#) Sets (#) Rest Special Instructions 1-4 Muscular endurance Leg press (m), leg/knee extension (m), leg/knee flexion (m), chest press (m), latissimus pull-down (m), triceps pulldown/extension (p), sit- ups (bw), back extension (m), shoulder press (m), seated row (m), biceps curls (p), sitting calf raises (m) and abdomen curls (m) 16-20 2 1 minute N/A 5-8 Muscular endurance/hypertrophy Leg press, leg extension, leg flexion, chest press, lat. pull-down, triceps pulldown, sit-ups, back extension, shoulder press, seated row, biceps curls, sitting calf raises, abdomen curls, shoulder raises (d) and ‘superman’ body raises (bw) 14-16 2-3 See “Superset” protocol “Superset” protocol: 2 exercises in succession (30s rest between), 2-4 mins rest after each superset 9-12 Muscular endurance/hypertrophy Leg press, leg extension, leg flexion, chest press, lat. pull-down, triceps pulldown, sit-ups, back extension, shoulder press, seated row, biceps curls, sitting calf raises, abdomen curls, shoulder raises and ‘superman’ body raises 15 2-3 See “Superset” protocol “Superset” protocol: 2 exercises in succession (no rest between), 1 min rest after each superset
  • 39.
    39 The relatively low-load,high-repetition nature of the protocol was chosen due to the age and untrained status of the subjects, so that unnecessary dropouts were avoided, and their health and safety was ensured. 4.2.3 Control group The control group (n=22) did not complete the training protocol. For the duration of the training protocol, they were instructed to maintain their normal daily activities. 4.3 Data collection All measurements were performed in the Viveca building at the University of Jyväskylä. Prior to the beginning of the training protocol, baseline measurements (strength, body composition, glucose tolerance, blood pressure and lipid profile) were performed on the study sample. These same measurements were performed on the study sample following the 3 month training protocol. Due to scheduling conflicts, injury/illnesses and the use of medication, the number of subjects measured was not equal across all tests. The explanation behind the sample used for each test is described below in the relevant section. 4.3.1 Strength Strength was assessed by a 1-repetition maximum (1RM) test. All subjects performed a familiarization session for the 1RM test prior to baseline measurements. Each subject completed a maximal dynamic horizontal 1RM test in the seated position using a David 210 dynamometer (David Sports Ltd., Helsinki, Finland). 1RM is the maximum load a subject can lift concentrically for one repetition. Leg extension in the subjects began at a knee angle of approximately 70° (68.4°±3.5). Subjects were instructed to hold the handles on the device tightly, and ensure that their buttocks and back remained in constant contact with the seat and backrest of the device throughout the test, and fully extend their legs (180°), without locking the knees (Figure 4). Verbal encouragement was given to all subjects. Prior to the start of the test, based on the 1RM results from the familiarization session, subjects performed a warm-up protocol of 6 reps at 50% of their estimated 1RM, 4 reps at 70% of their estimated 1RM, 2 reps at 90% of their estimated 1RM and 1 rep at 95% of their estimated 1RM, with 1 minute rest between sets. Following the warm-up, the 1RM test began with 90 seconds rest between attempts. The aim was to complete the test within five attempts. The greatest load
  • 40.
    40 that the subjectscould fully lift was recorded as their 1RM. Loads were increased or decreased in increments of 1.25, 2.5, 5 or 10 kg. Baseline and post-training tests measurements were performed at the same time of day (±2 hour) and with similar ambient conditions. One subject in the control group was excluded from the 1RM test due to a minor foot injury he suffered prior to the post-training test. All other subjects performed the 1RM tests. The 1RM test has been shown to be a valid way of assessing in vivo strength in both elderly men and women, as well as being an accurate way of measuring changes in leg muscle strength (Verdijk et al. 2009). Further, the 1RM test has a high level of repeatability (Levinger et al. 2009). In a previous study conducted in the same laboratory with the same dynamometer, the inter-day reliability values for the 1RM measurements were 0.981 and 3.1 % for ICC and CV, respectively (Walker et al. 2015). FIGURE 4 – A subject demonstrating the positioning during a 1RM test.
  • 41.
    41 4.3.2 Body Composition Whole-bodytissue composition was measured using Dual-energy X-ray absorptiometry (DXA) (Lunar Prodigy Advance, GE Medical Systems, Madison, United States). Measurements were performed in the morning (between 8:00 and 10:00) after a 12-hour fast. Subjects were asked to remove any metal objects and remove any excess clothing, so that the measurement was performed with minimal clothing (only shorts and/or undergarments). They were positioned so that their spine was aligned with the longitudinal line running down the middle of the bed. Their feet were secured with a footrest made out of Styrofoam and their arms were placed beside their body with their palms facing in, with beanbags separating the hands from the thighs and upper arms from the torso. Subjects were to lie still throughout the duration of the scan. Each scan took approximately 6 minutes. For the post-training measurements, the scan/image from baseline measurements was consulted to ensure that the subjects were in the same position for both measurements. Two subjects in the training group were excluded from the body composition tests due to scheduling conflicts and minor illnesses. All other subjects performed all the body composition tests. Automatic analysis (Encore version 14.10.022) provided whole body fat mass and lean mass (kg). Android fat mass (kg), as defined in the user manual (lower boundary at pelvis cut; upper boundary above pelvis cut by 20% of the distance between pelvis and neck cuts; lateral boundaries are the arm cuts) (Lunar User Manual 2010), was also provided automatically. Studies have consistently shown that DXA is a valid and reliable method of assessing body composition in subjects of all ages (Chen et al. 2007, Kaul et al. 2012, Glickman et al. 2004). Further, a 2014 study showed that DXA (Lunar Prodigy) measures android fat precisely and reliably (coefficient of variance = 1.6 %) in men and women aged 20-84 years old (Kaminsky et al. 2014). In addition, DXA is sensitive to changes in fat in the abdominal region (Glickman et al. 2004). In a previous study conducted in the same laboratory, the intraclass correlation coefficient (ICC) for the body composition measures were 0.786–0.975 (Schumann et al. 2014).
  • 42.
    42 4.3.3 Glucose tolerance,blood pressure and lipid profile A qualified lab technician, using standard laboratory techniques, conducted the OGTT, blood pressure measurements and blood sample collection needed for analysis of lipids (TC and TG) and lipoproteins (HDL and LDL cholesterol). Measurements began between 8:00 and 8:30 in the morning, after the subjects had performed a 12-hour fast. Blood pressure measurements were taken first, using an automated device (Omron M6W, Omron Healthcare Co., Ltd. Hoofddorp, Netherlands). Two recordings were taken for each subject, using the right arm. The lowest systolic and diastolic blood pressure reading of the two recordings was used in the analysis to account for the white-coat effect. Blood pressure measurements were also taken in all subjects during the medical screening sessions prior to the beginning of the study. Therefore, the subjects were likely more comfortable with the process of having their blood pressure taken during the actual tests, thus reducing the magnitude of the white-coat effect. Next, venous blood samples (~11 ml) were collected from the antecubital vein into tubes (Vacuette Serum Gel Tube, Greiner Bio-One GmbH, Kremsmünster, Austria) using sterile needles. Blood samples were centrifuged (Megafure 1.0 R Heraeus, DJB Lab Care, Germany) at 3,500 rpm for 10 minutes after which serum was removed and stored at -20 °C (for a maximum of 3 months) until analysis. Serum samples of glucose, lipids and lipoproteins were analyzed with the Konelab 20 XTi -device (Thermo Electron Co, Vantaa, Finland). Serum samples of insulin were analyzed with the Immulite 2000 XPi device (Siemens Healthcare, Espoo, Finland). Subjects then ingested a 75 g glucose load (GlucosePro, Comed Oy, Tampere, Finland). Blood samples were taken 60 minutes (60-minute glucose and insulin) and 120 minutes (120-minute glucose and insulin) after the ingestion of the glucose load, again using the same protocol as at baseline (0-minute glucose and insulin). Twelve subjects on medication (i.e. Type 2 Diabetes Mellitus medication) were removed from the OGTT. Thirteen subjects on medication (i.e. beta-blockers) were excluded from the blood pressure measurements. All subjects in the training group and control group were included in the lipid profile test.
  • 43.
    43 Inter-assay coefficients ofvariance were 0.9% for glucose, 5.9% for insulin, 7.7% for HDL, 3.7% for LDL, 5.2% for TC and 1.9% for TG. The analytical sensitivity for glucose was 0.03 mmol/l, 14 pmol/l for insulin, 0.1 mmol/l for HDL, 0.04 mmol/l for LDL, 0.02 mmol/l for TC and 0.02 mmol/l for TG. The measurement ranges for glucose, insulin, LDL, HDL, TC and TG were 0.3-120.0 mmol/l, 14-2165 pmol/l, 0.2-15 mmol/l, 0.09-11 mmol/l, 0.05-11 mmol/l and 0.05-11 mmol/l, respectively. 4.4 Statistical analysis Statistical analysis was completed using IBM SPSS Statistics Version 21 software (SPSS Inc., Chicago, IL, USA). Conventional statistical methods were used to determine mean and standard deviation (SD) values. The normality of the data was tested using Shapiro-Wilk (n < 50) and Kolmogorov-Smirnov (n ≥ 50) tests. If the distribution of a variable was not normally distributed, it was modified using arithmetic transformations (Lg10, Ln and SQRT). Repeated measures ANOVA (2 group x 2 time) was used to identify main effects and interactions, for all variables. A paired-samples t-test and an independent-samples t-test were used as post hoc tests. Within-group differences (pre-training (PRE) vs post-training (POST)) were analysed using a paired-samples t-test. Between-group differences (training group versus control group) were analyzed using an independent-samples t-test. In the case where a variable was not normally distributed after arithmetic transformation (total-body lean mass), non-parametric tests were used. The Friedman test was used to test for differences between the distributions of a variable. A Wilcoxon signed-rank test and an independent-samples Mann-Whitney U test were used as post hoc tests; a Wilcoxon signed- rank test to analyze within-group differences and an independent-samples Mann-Whitney U to analyze between-group differences. Pearson product-moment correlations were calculated between the percent change (%), the delta change (∆) and baseline values (PRE) for each variables. The significance level for all tests was set α = 0.05.
  • 44.
    44 5 Results 5.1 Strength Significantincreases in 1RM were observed in the training group (pre-training: 110.4 ±34.6 vs. post-training: 123.8 ±36.5; p<0.001), but not in the control group (pre-training: 118.8 ±29.1 vs. post-training: 121.2 ±29.8; p>0.05). The relative change in 1RM (%) over the study period was significantly different between groups (Figure 5). 5.2 Body composition The training group experienced increased total body lean mass (LM) (1.2% ±2.4, p<0.05), as well as decreased total body fat mass (FM) (-2.5% ±5.5, p<0.05) and android fat mass (AF) (-3.5% ±6.9, p<0.05). These changes were significantly greater than in the control group (Figure 6). No significant changes were observed in the control group for any variable. FIGURE 5 – Change in 1RM (%) in the training and control groups. ***p<0.001 denotes a significant difference between groups.
  • 45.
    45 FIGURE 6 –The relative change (%) in fat mass, android fat and lean mass over the study period in the training and control group. *p<0.05 denotes a significant difference between groups. 5.3 Glucose tolerance, blood pressure and lipid profile Glucose tolerance. There was a main effect of time for 120-minute glucose (glucose_120) (F(1, 87) = 4.4, p<0.05). Post hoc tests revealed a significant reduction in glucose_120 in the training group, but not in the control group (Table 7). This change in the training group was not significantly different in comparison to the control group. There were no other significant changes in the training or control group for any of the measures from the OGTT. Blood pressure. There was a significant main effect of time (F(1, 87) = 4.0, p<0.05) for SBP. Post hoc tests revealed that there was a significant reduction in SBP in the training group, but not in the control group (Table 8). This change in the training group was not significantly different in comparison to the control group. There were no other changes in blood pressure in the training or control groups.
  • 46.
    46 TABLE 7 –OGTT results (mean ±standard deviation) for the training and control group. *p<0.05 denotes a significant difference over time. INT (n = 68) CON (n = 21) PRE POST PRE POST Glucose 0 min (mmol/L) 5.7 ±0.5 5.6 ±0.6 5.6 ±0.5 5.5 ±0.4 Glucose 60 min (mmol/L) 8.4 ±2.3 8.3 ±2.4 8.8 ±2.7 9.1 ±1.7 Glucose 120 min (mmol/L) 7.1 ±1.7 6.6 ±1.8* 7.2 ±2.6 6.7 ±1.6 Insulin 0 min (pmol/L) 57.0 ±45.1 56.2 ±54.2 41.6 ±28.6 39.5 ±27.5 Insulin 60 min (pmol/L) 402.3 ±273.8 385.1 ±224.6 344.0 ±28.6 353.7 ±167.4 Insulin 120 min (pmol/L) 373.6 ±243.1 346.0 ±178.3 311.3 ±186.3 331.2 ±176.7 TABLE 8 – Blood pressure (mean ±standard deviation) for the training and control group. *p<0.05 denotes a significant difference over time. Lipid profile. There was a significant interaction between group and time for LDL (F(1, 99) = 4.9, p<0.05). Post hoc tests revealed a significant reduction in LDL in the control group (Table 9), which was significantly greater than in the training group (-6.1% ±11.0 vs 3.5% ±21.1, p<0.05; respectively). There was a main effect of time for TC (F(1, 99) = 16.4, p<0.001) and HDL (F(1,99) = 4.0, p<0.05). Post hoc tests revealed a significant reduction in TC in the training and control groups (Table 9). These changes were not different between groups (-4.1% ±11.8 vs -5.1% ±10; p>0.05). In addition, there was a significant reduction in HDL in the training group, but this change was not significantly different from the control group (-5.6% ±14.2 vs 1.5% ± 25.5, p>0.05; respectively). GROUP SBP (mm/Hg) DBP (mm/Hg) PRE POST PRE POST INT (n = 68) 153.5 ±20.5 148.1 ±20.7* 80.4 ±9.1 79.4 ±10.9 CON (n = 20) 145.9 ±20.6 142.8 ±16.5 79.1 ±10.4 78.1 ±12.1
  • 47.
    47 There was amain effect of group for HDL (F(1, 99) = 4.9, p<0.05) and TG (F(1, 99) = 8.9, p<0.01). Post hoc tests revealed that post-training HDL was significantly greater in the control group compared to the training group, and pre-training and post-training TG were significantly greater in the training group compared to the control group (Table 9). TABLE 9 – Lipid profile (mean ±standard deviation) for the training and control group. *p<0.05, **p<0.01 and ***p<0.001 denote significant differences over time. + p<0.05 denotes a significant difference between groups. GROUP Total cholesterol (mmol/L) HDL cholesterol (mmol/L) LDL cholesterol (mmol/L) Triglycerides (mmol/L) PRE POST PRE POST PRE POST PRE POST INT (n = 79) 5.7 ±1.1 5.4** ±1.0 1.7 ±0.5 1.6 *** ±0.4 3.7 ±0.9 3.7 ±0.9 1.4 ±0.7 1.4 ±0.7 CON (n = 22) 5.8 ±1.1 5.5* ±0.9 1.8 ±0.4 1.8+ ±0.4 3.6 ±0.9 3.4* ±0.8 1.1+ ±0.4 1.0+ ±0.7 5.4 Correlations There was a significant, inverse correlation between PRE 1RM and 1RM change (%) (r = - 0.585, p<0.001), PRE SBP and SBP change (%) (r = -0.439, p<0.001) (Figure 7), PRE glucose_120 and glucose_120 change (%) (r = -0.367, p<0.01) and PRE SBP and glucose_120 change (%) (r = -0.330, p<0.05). A significant, positive correlation between FM change (∆) and insulin_120 change (∆) (r = 0.340, p<0.01) (Figure 8) and AF change (∆) and insulin_120 change (∆) (r = 0.335, p<0.01) was found. In addition, there was a significant, positive correlation between FM change (%) and DBP change (∆) (r = 0.349, p<0.01) and AF change (%) and DBP change (∆) (r = 0.272, p<0.05).
  • 48.
    48 FIGURE 7 –Inverse correlation between PRE SBP and SBP change (%). FIGURE 8 – Positive correlation between FM change (∆) and insulin_120 change (∆).
  • 49.
    49 There was asignificant, positive correlation between PRE glucose_0 and PRE FM (r = 0.361, p<0.01), PRE glucose_0 and PRE AF (Figure 9) (r = 0.533, p<0.001), PRE glucose_0 and PRE SBP (r = 0.324, p<0.01) and PRE insulin_0 and PRE AF (r = 0.422, p<0.001). FIGURE 9 - Positive correlation between PRE glucose_0 and PRE AF.
  • 50.
    50 6 Discussion Lower-body strengthimproved by ~12% in the training group – a significant increase in comparison to the control group (~2%). This finding confirms the study hypothesis, demonstrating that RT is effective in improving strength, even in elderly populations lifting relatively light loads. There was a significant, inverse relationship (r = -0.585, p<0.001) between 1RM strength at baseline and the change in 1RM strength (%), suggesting that the subjects who were least strong prior to the study experienced the greatest increase in strength. The increase in strength seen presently is comparable to improvements reported in the literature. For instance, Cononie et al. (1991) reported that 12 weeks of RT (one set of 8-12 reps) performed 3 times a week increased strength by 12% in subjects aged 70-79 years old. Galvao et al. (2005) described a spectrum of strength improvements, ranging from approximately 6 - 25 % (depending on the exercise) following 20 weeks of RT performed 3 times a week in elderly women, although the increase in strength reported for the leg press exercise was 14%. Notably, there are studies that have reported improvements in strength of larger magnitude. For instance, Ryan et al. (2001) described a ~18% and ~28% increase in leg press strength in older men and women, respectively. However, the RT protocol used higher resistances (10RM for lower body exercises) and was considerably longer in duration (24 weeks) than the present protocol, which may explain the discrepancy in strength gains. Strength is strongly associated with functional capacity and independence in the elderly (Galvao & Taaffe 2005, DiFrancisco-Donoghue et al. 2007). Therefore, the increase in muscular strength in the training group likely had a profound effect on the day-to-day living and overall quality of life of these subjects, although functional capacity was not directly measured in the present study. Strength may also be related to the occurrence and prevalence of chronic disease. Evidence from cross-sectional studies reveal that poor muscle strength is associated with higher prevalences of cardiovascular risk factors and type 2 diabetes (Park et al. 2006, Fahs et al. 2010). This may simply be an indirect relationship however, related to the physical inactivity associated with those with chronic disease (i.e. an individual on bed rest), rather than a causal relationship.
  • 51.
    51 The ~2% increasein strength in the control group is likely attributable to a learning effect. While there was a familiarization session designed to introduce subjects to the 1RM test and develop their technique, improvements in technique may still have occurred from the PRE 1RM test to POST 1RM test. Alternatively, it may also be related to a change in psychological state. It is plausible that subjects felt more nervous during the PRE 1RM test than POST 1RM test, as they were less familiar with the test, the testers and the testing environment. There was a ~1.2% (~0.7 kg) increase in LM in the training group, accompanied by a ~2.5% (~0.6 kg) reduction in FM and a ~3.5% (~0.1 kg) reduction in AF – all of which were significant in comparison to the control group. This finding suggests that RT is effective in improving body composition, even in elderly populations. The improvements in body composition found presently are comparable to those reported in the literature. For instance, Schmitz et al. (2003) reported a significant increase in LM and a significant decrease in FM following 15 weeks of RT performed 2 times a week. Both these improvements in LM and FM were under 1 kg in terms of the magnitude of change, which is similar to what was reported currently. Campbell et al. (1994) found improvements in LM and FM following RT (+1.4 kg and -1.8 kg, respectively) that more than double the improvements reported currently, although the RT protocol used by Campbell et al. (1994) was longer in duration and higher in frequency than the one used presently. Additionally, the RT protocol was combined with dietary controls (diet that provided 0.8 or 1.6 g of protein per kg/day and adequate total energy to maintain baseline body weight) that may have emphasized the changes in body composition. Treuth et al. (1995) reported a 7.1% decrease in abdominal fat following RT that doubles the decrease seen presently (~3.5%). The fact that the RT protocol used by Treuth et al. (1995) had double the amount of training sessions as the present protocol (48 vs 24 sessions, respectively) may explain the discrepancy in the magnitude of abdominal fat reduction. It was noted in the literature review that all studies reporting a reduction in abdominal fat in the elderly following RT used protocols that were 16 weeks in length or longer. It appears that this is the first study to reveal a reduction in abdominal fat in the elderly following RT, using a protocol lasting less than 16 weeks.
  • 52.
    52 Skeletal muscle appearsto play an important role in the development of chronic disease. Skeletal muscle is a primary target for the disposal of triglycerides and glucose, and is an important component of RMR. Research suggests that maintaining a large, active muscle mass improves cardiometabolic risk factors, such as insulin resistance, obesity and hypertension (Strasser & Schobersberger 2011). The loss of skeletal muscle associated with aging put the elderly at increased risk of developing the metabolic syndrome and chronic disease. The significant increase in LM found presently confirms the study hypothesis, and suggests that RT can not only slow sarcopenia, but also reverse it, at least temporarily (over a 12-week period). The implications of this finding, in regards to the metabolic syndrome and chronic disease, are considerable, as discussed. As obesity is a powerful independent risk factor for the metabolic syndrome and chronic disease, and the prevalence of obesity is increasing globally, especially among the elderly, any method or treatment that reduces fat is worth consideration. In particular, it is visceral fat that is most linked to insulin resistance, the metabolic syndrome, cardiovascular disease, and type 2 diabetes (Bechtold et al. 2006). AF represents fat in the abdominal region and has been shown to be a legitimate surrogate measure of visceral fat (Miazgowski et al. 2014). Presently, reductions in both FM and AF were reported in the training group, suggesting that RT may be a viable method of preventing and/or treating obesity in elderly populations – a finding of considerable importance when considering the metabolic syndrome and chronic disease. It is possible that the improvements in FM and AF are not attributable to RT alone. Subjects in both the training and control groups were instructed to maintain their normal dietary habits, although this was not directly controlled or monitored. Therefore, it may be that the reductions in FM and AF were influenced by dietary changes. However, the fact that the reduction in FM and AF was accompanied by an increase in LM suggests otherwise. Calorie restrictions diets can be effective in inducing weight loss; however, they are typically associated with losses in LM (Tresierras & Balady 2009). Evidence from the literature has shown that LM can be preserved when calorie restriction diets are combined with RT (Ross & Rissanen 1994, Ross et al. 1996, Rice et al. 1999). However, it is unlikely for LM to be significantly increased in a state of calorie restriction. There was a significant increase in LM
  • 53.
    53 in the presentstudy, suggesting that improvements in FM and AF were not related to dietary changes, but rather, the imposed intervention. There was a significant reduction in 120-minute glucose (~0.5 mmol/L; ~5%) in the training group. There were no other significant changes in regards to the OGTT in either group. The reduction in 120-minute glucose seen presently following RT is comparable to other reductions reported in the literature. For example, Miller et al. (1994) reported a similar reduction in 120-minute glucose (~0.3 mmol/L) after 16 weeks of RT that did not reach significance, although this may have been related to the size of the study sample (11 subjects). Smutok et al. (1994) found a large reduction in 120-minute glucose (1.4 mmol/L) that more than doubles the current reduction, although their study employed a longer duration (20 weeks) and higher frequency (3 times a week) of training. Despite the improvement in glucose concentration at 120 minutes of the OGTT, RT did not appear to have a comprehensive effect on glucose tolerance. As there is a large body of evidence suggesting that RT improves glucose tolerance and insulin sensitivity, the lack of a comprehensive change in the OGTT is likely related to characteristics specific to the present study, rather than providing new evidence suggesting that RT has little effect on glucose tolerance. The lack of a comprehensive change in glucose tolerance may be related to the length of the RT protocol used. Snowling & Hopkins (2006) noted in their meta-analysis that RT resulted in significant improvements in glucose tolerance only when protocols lasted 12 weeks or longer. As the present RT protocol was only 12 weeks in length, it seems plausible that a longer lasting protocol would have resulted in more pronounced improvements in glucose tolerance. The lack of an extensive change in glucose tolerance may also be associated with the heterogeneity of the study sample used presently. There was a significant, inverse correlation between 120-minute glucose at baseline and the change (%) in 120-minute glucose (r = - 0.367, p<0.01), suggesting that subjects with impaired glucose tolerance at baseline experienced the greatest improvements in glucose tolerance. It is possible that if the current study had only investigated subjects with impaired glucose tolerance (or diabetics), the
  • 54.
    54 resulting improvements wouldhave been more distinct and comprehensive. When only examining the subjects in the training group with “impaired glucose tolerance” or worse (≥7.8 mmol/L – see Table 1) at 120 minutes of the OGTT at baseline (21 subjects), the resulting improvement in glucose tolerance of these subjects following RT is of greater magnitude (pre-training: 9.3 ±1.0 mmol/L vs. post-training: 8.2 ±1.9 mmol/L; -11.3% ±19.8) than when considering the whole training group together (pre-training: 7.1 ±1.7 mmol/L vs. post-training: 6.6 ±1.8 mmol/L; -4.9% ±21.5), supporting the proposition that more comprehensive changes in glucose tolerance would have been apparent if all subjects had impaired glucose tolerance at baseline. While there were no significant changes in insulin concentrations during the OGTT, this does not necessarily imply that there were no changes in insulin sensitivity following RT in the training group. After the training intervention, subjects in the training group were able to clear significantly more glucose from the blood into insulin-dependent cells, while using the same amount of insulin as before the training intervention. This finding may be explained by an increase in insulin sensitivity in the training group, but as the hyperinsulinemic- euglycemic clamp technique is the only method of assessing insulin sensitivity directly, it remains open to interpretation. At the very least, there appears to be a trend of improved glucose tolerance in the training group, suggesting that RT may be a viable method of improving glucose tolerance in elderly individuals, and supporting the conclusions of a large volume of literature. This finding is of considerable importance, when considering the development of the metabolic syndrome and chronic disease. There was a significant improvement in SBP (~3%) in the training group, while there were no other changes in BP in either group. The ~5.5 mmHg reduction in SBP in the training group suggests that RT may be a viable method of improving BP in the elderly – which is of considerable importance in terms of the metabolic syndrome and development of chronic disease. Two meta-analyses, from 2000 and 2005, reported an average reduction in SBP of 3mmHg and 3.2 mmHg, respectively, following RT (Kelley & Kelley 2000, Cornelissen & Fagard 2005). Therefore, the reduction in SBP reported presently nearly doubles the reduction
  • 55.
    55 reported in thesemeta-analyses. The meta-analysis of Strasser et al. (2010) however, reported a 6.2 mmHg reduction in SBP (based on eight trials), which better resembles the present reduction. These discrepancies in SBP reduction may be related to RT protocol variables or subject characteristics, or both. For example, Strasser et al. (2010) identified a possible relationship between RT volume and improvements in BP – they noted that RT protocols with higher volumes (which they defined as ≥9 sets per muscle group per week) resulted in the most effective reductions in SBP. While the RT protocol used presently does not meet the criteria for this definition of “high-volume”, due to its high-repetition nature, it approaches the likes of a “high-volume” protocol, and would certainly not qualify as “low-volume”. This may explain the larger magnitude of the SBP reduction reported currently in comparison to the meta-analyses of Kelley & Kelley (2000) and Cornelissen & Fagard (2005), which included studies that used true “low-volume” RT protocols (i.e. 1 rep per set, 1 set per exercise). Another explanation lies in the heterogeneity and baseline blood pressure of participating subjects. There was a significant, inverse correlation between SBP at baseline and the change (%) in SBP (r = -0.439, p<0.001), suggesting that those with high SBP at baseline experienced the greatest improvements in blood pressure. When only examining the subjects in the training group with stage 2 hypertension or worse (≥ 160 mmHg) at baseline (25 subjects), the resulting improvement in SBP of these subjects following RT is of greater magnitude (pre-training: 173.9 ±12.4 mmHg vs. post-training: 159.1 ±18.1 mmHg; -8.9% ±7.3) than when considering the whole training group together (pre-training: 153.5 ±20.5 mmHg vs. post-training: 148.1 ±20.7 mmHg; -2.6% ±11.2), supporting the hypothesis that the reduction in SBP would have been larger if only subjects with hypertension had been investigated. Further research is needed here however, as it has been noted that there is limited research examining the effects of RT on subjects with hypertension alone (Strasser et al 2010). The meta-analysis of Kelley and Kelley (2000) and Cornelissen & Fagard (2005) also reported improvements in DBP following RT. There were no significant reductions in DBP in the present study. The explanation for this finding is unclear, although genetics may play a role; in an unpublished study described in Hurley et al. (2011), older men and women with
  • 56.
    56 a specific genotypewithin their angiotensin II type 1 receptor and angiotensionogen gene experienced the greatest reduction in BP after RT, in comparison with those with other genotypes at this loci. There may be a relationship between RT frequency and improvements in BP (Strasser et al. 2010). The authors noted that higher frequency protocols (3 times a week versus 2 or less) resulted in the most effective reductions in BP. Although high-frequency RT protocols may be better suited for improving BP, the present study reported improvements in SBP after RT performed only 2 times a week – a relatively low frequency of RT when considering the majority of literature on the subject. However, it is possible that if a higher frequency protocol had been used, there would have been a significant reduction in DBP accompanying the reduction in SBP. The lack of a significant change in DBP in the present study may also be related to the baseline values of DBP in the training group. The average DBP in the training group was ~80 mmHg at baseline, which is on border between the “normal” classification and the “prehypertension” classification, according to the JNC7 (Table 3) (The Seventh Report of the Joint National Committee on Prevention, Detection, Evaluation, and Treatment of High Blood Pressure 2004). It is possible that significant reductions in DBP would have occurred if subjects were on average, pre-hypertensive or hypertensive at baseline, in terms of DBP. The question remains unclear however, as reductions in DBP have been reported after RT in normotensive subjects (Tsutsumi et al. 1997) The more recent meta-analysis of Strasser et al. (2010) concluded that RT has a positive influence on SBP, but not DBP; their analysis of 13 RCTs revealed no statistically significant effect of RT on DBP. The results of the present study support the results of this meta-analysis and suggest that RT may have little effect on DBP. The results of the lipid profile were unexpected. There was a reduction in HDL (~5%) in the training group, and a reduction in LDL (~6%) in the control group. Both groups experienced reductions in TC, and there were no significant changes in TG. HDL was significantly reduced in the training group and LDL was significantly reduced in the control group. These reductions in HDL and LDL presumably explain the reductions in
  • 57.
    57 TC in theirrespective groups. The difference in TG pre-training and post-training between groups is presumably related to the total fat content of the subjects in either group. At both pre-training and post-training, the intervention group had a higher total amount of fat than the control group (pre-training: 28.2 ±8.4 kg vs. 22.8 ±6.3 kg, p<0.01; post-training: 27.6 ±8.5 kg vs. 22.0 ±6.1 kg, p<0.05; respectively). Therefore, although there were no significant changes in TG in either group, total fat mass likely explains why the training group had significantly higher TG levels pre-training and post-training, compared to the control group. Based on the present results, it appears that RT does not positively influence the lipid profile, suggesting that RT may not be a viable method of improving this risk for the metabolic syndrome. In comparison to the control group, RT appeared to have a detrimental effect on the lipid profile (training group: reduced HDL, no change in LDL; control group: no change in HDL, reduced LDL). While these findings are somewhat unexpected, out of all the risk factors for the metabolic syndrome, the effect of RT on the lipid profile is the most controversial. For instance, the conclusion of three independent meta-analyses has been that RT does not improve the lipid profile in a significant manner (Hurley 1989, Braith & Stewart 2006, Strasser et al. 2010). Therefore, the present results still support a large body of evidence demonstrating that RT does not improve the lipid profile. Nevertheless, there is also a body of evidence that shows the opposite is true (Kelley & Kelley 2009, Mann et al. 2014). It is unclear whether the lack of improvement in the lipid profile seen presently was because RT has truly little influence on the lipid profile, or because there were other factors present. One factor that may have influenced the results is the influence of diet. Evidently, diet and dietary changes can affect lipid and lipoprotein levels. Certain diets (i.e. low fat) have been shown to improve the lipid profile (Huang et al. 2011). Although all subjects were instructed to maintain their normal dietary habits, this was not specifically controlled (i.e. with prepared meals, meal plans etc.). It is possible that the dietary habits of the training and/or control group changed during the study, affecting the response of the lipid profile. Research has shown that there is a considerable seasonal variation in blood lipid levels, namely where cholesterol levels (TC, HDL and LDL) are higher in the fall and winter, and lower in the spring and summer (Ockene et al. 2004). Importantly, it appears that this effect is most striking in regions with extreme climatic variations, including Finland (Keys et al.
  • 58.
    58 1958). This seasonalvariation may partially explain the reduction in HDL cholesterol in the training group and the reduction in LDL cholesterol in the control group, as baseline measurements were taking in the winter and post-training measurements were taken in the spring/early summer. However, as there was no corresponding reductions in HDL cholesterol in the control group or in LDL cholesterol in the training group, it is clear that this does not fully account for the unexpected lipid profile results found presently. Another factor to consider is the length and frequency of the RT protocol used in this study. As discussed, the vast majority of studies investigating the effects of RT on cardiometabolic risk factors use long lasting (≥16 weeks), high-frequency (≥3 times a week) RT protocols. One study using a short duration (8 weeks) and low frequency (2 times a week) protocol revealed that RT (16 sessions; 6-10 RM) did not alter lipid levels in young healthy males (Staron et al. 2000). There may be a minimum amount of RT needed to improve the lipid profile that was not reached in that of Staron et al. (2000), or in the current study. Further research is needed here. It has been suggested that there is a relationship between RT volume and improvements in the lipid profile (Strasser et al. 2010). This meta-analysis found that high-volume, low- intensity protocols appeared to best suited to induce improvements in HDL. As a moderately high-volume, low-intensity protocol was used presently, and there were no significant improvements in HDL, this hypothesis cannot be confirmed. Strasser et al. (2010) also noted a possible relationship between RT frequency and improvements in the lipid profile – they identified a study that found that improvements in LDL and TG were emphasized when subjects performed RT 2 times a week, rather than 3 (Honkola et al. 1997). Again, as the current protocol used a 2 times a week frequency, and no improvements in LDL or TG were found, this relationship cannot be confirmed. Clinical significance. The present study reported numerous significant changes following RT, including improvements in body composition, glucose tolerance and blood pressure, all of which play a primary role in the metabolic syndrome. However, it is important to ask whether these changes were meaningful, or in other words, did RT lead to clinically significant improvements?
  • 59.
    59 An approximately 12%increase in strength was found following RT. This finding appears to be clinically significant when considering the loss of strength associated with aging. Evidence indicates that maximum strength declines at a rate of approximately 5% per decade, from the age of 45 years old onwards (Aoyagi & Shephard 1992). Therefore, the increase in strength reported presently represents an offset of more than 2 decades of aging. Changes in body composition also appear to be clinically significant. In a similar manner to strength, aging is associated with losses in LM. Evidence suggests that from the 5th decade onwards, sarcopenia occurs at a rate of approximately 0.5 kg/year (Strasser & Schobersberger 2011). Thus, the ~0.6 kg increase in LM reported presently represents a counteraction of more than a year of aging. The only change in the OGTT following RT was a reduction in 120-minute glucose. However, 120-minute glucose appears to be the most clinically significant component of an OGTT. For instance, a study investigating the use of the OGTT as an indicator of mortality found that only higher 120-minute glucose was a significant independent risk factor for mortality (Metter et al. 2008). In addition, 120-minute OGTT hyperglycemia has been reported to be an independent risk factor for cardiovascular disease CVD (Meigs et al. 2002). Further, according to the cut-offs defined by the WHO (Table 1), the reduction in 120-minute glucose appears to be clinically significant. Pre-training, in the training group, there were two subjects classified as “diabetic” (≥11.1 mmol/L) and 19 classified as having “impaired glucose tolerance” (7.8-11.1 mmol/L). Post-training, there was only one subject classified as “diabetic” and 10 subjects classified as having “impaired glucose tolerance”. Caution must be taken when interpreting this result as the WHO bases their cut-offs on plasma samples of glucose, and serum samples were used in the present study. A 2012 study reported that there is a difference in glucose concentrations when taken from a plasma sample versus a serum sample, although the reported difference is small (plasma glucose values were on average 1.15% higher than plasma serum samples) (Frank et al. 2012). The only improvement in BP following RT was a reduction in SBP. However, this reduction appears to be clinically significant. Firstly, research shows that SBP is a stronger predictor of cardiovascular events than DBP (Mourad 2008). In addition, small reductions in SBP are associated with significant improvements in health outcomes; a 3 mmHg reduction in SBP is
  • 60.
    60 estimated to decreasethe risk of cardiac morbidity by 5 - 9%, stroke by 8 - 14% and all-cause mortality by ~4% (Whelton et al. 2002). There was a ~5.5 mmHg mean reduction in SBP following RT seen presently. Furthermore, when using the cut-off for stage 2 hypertension (≥ 160 mmHg) as defined by the JNC7 (Table 3), there were 25 subjects with stage 2 hypertension in the training group pre-training, and only 15 subjects with stage 2 hypertension post-training. Although there were no significant changes in DBP in the training group, there was a small, non-significant reduction that took the mean DBP of the training group from the “pre- hypertension” classification to the “normal” classification (pre-training: 80.4 ±9.1 mmHg vs. post-training: 79.4 ±10.9; p>0.05), as defined by the JNC7 (Table 3). Finally, although there were no improvements in the lipid profile following RT, the results suggest that this lack of improvement was not particularly clinically significant. For instance, in the training group pre-training, the average HDL concentration was ~1.7 mmol/L, which falls into the “high/optimal” classification according to the NCEP ATP-III (Table 2). While there was a significant reduction in HDL in the training group following RT, the mean HDL concentration in the training group (~1.6 mmol/L) was still in this “high/optimal” classification post-training, which is associated with a less than average risk of heart disease. Similarly, although there was a small, non-significant increase in TG in the training group, at both pre-training and post-training, the mean TG concentration in the training group was in the “normal/optimal” category. There was also a non-significant increase in LDL in the training group, but at both pre-training and post-training, the mean LDL concentration in the training group was in the “borderline high” category. Although RT did not appear to result in comprehensive changes in all the risk factors for the metabolic syndrome, it appears that improvements that did occur were clinically significant. The results of the present study strongly support the meta-analysis of Strasser et al. (2010), which concluded that RT has a statistically and clinically significant effect on risk factors for the metabolic syndrome including abdominal obesity, glucose tolerance and SBP, but not DBP and the lipid profile. Mechanisms. One of the secondary aims of this study was to investigate the mechanisms underlying improvements in cardiometabolic risk factors following RT. While RT did appear
  • 61.
    61 to improve riskfactors for the metabolic syndrome, the physiological mechanisms underlying these changes remain unclear and complex. When investigating relationships between variables at baseline, an association between fat (total FM and AF) and risk factors for the metabolic syndrome emerged. For instance, there was a significant, positive correlation between PRE glucose_0 and PRE AF (r = 0.533, p<0.001), PRE insulin_0 and PRE AF (r = 0.422, p<0.001) and PRE glucose_0 and PRE FM (r = 0.361, p<0.01). These findings suggest that fat, especially abdominal fat, is central to the development of glucose intolerance, insulin resistance and the metabolic syndrome, substantiating the common hypothesis described in the literature (Byrne & Wild 2011). Changes in fat (total FM and AF) also appeared to be related to improvements in cardiometabolic risk factors following RT. For example, there was a significant, positive correlation between FM change (∆) and insulin_120 change (∆) (r = 0.340, p<0.01) and AF change (∆) and insulin_120 change (∆) (r = 0.335, p<0.01). There was also a significant, positive correlation between FM change (%) and DBP change (∆) (r = 0.349, p<0.01) and AF change (%) and DBP change (∆) (r = 0.272, p<0.05). These findings suggest that reductions in fat may have been related to improvements in risk factors for the metabolic syndrome. These associations do not imply causation, and due to the relative weakness of the correlations, it is clear that there are other factors present. However, the findings do emphasize the role that fat and obesity play in the development of the metabolic syndrome, and suggest that reductions in fat may be related to improvements in risk factors for the metabolic syndrome. More research is needed to investigate the specific physiological mechanisms by which changes in fat content influence cardiometabolic risk factors. There were no significant correlations between changes in strength or LM, and risk factors for the metabolic syndrome, suggesting that changes in strength and LM may not have been related to these improvements in risk factors. However, the importance of strength and lean mass, in terms of the overall health of elderly populations, cannot be overlooked, as discussed. Changes in muscle quality, inflammatory biomarkers and adipocytokines have also been proposed as possible mechanisms. It is believed that adipocytokine dysregulation is the key link between abdominal obesity and the development of insulin resistance and the metabolic
  • 62.
    62 syndrome (Byrne &Wild 2011). It is possible that the currently reported reductions in abdominal fat caused changes in adipocytokine levels (i.e. increases in adiponectin and decreases in leptin and resistin), that resulted in increases in systemic insulin sensitivity. However, as adipocytokine levels were not measured in the current study, this remains unclear. Muscle quality and inflammatory biomarkers were not assessed either. Dose-response relationship. Another of the secondary aims of this study was to consider the results in terms of the dose-response relationship. It is important to consider how much RT is needed (in terms of the length, frequency, volume and duration of RT) to generate meaningful improvements in cardiometabolic risk factors. This point is especially important, as a lack of time is a major barrier to physical activity participation among the elderly (Chao et al. 2000). Knowing the minimum dose of RT needed to have a health promoting effect in regards to the metabolic syndrome is critical when considering exercise prescription. The vast majority of studies investigating the effects of RT on risk factors for the metabolic syndrome use RT protocols lasting 16 weeks or more in length (Brooks et al. 2006, Castaneda et al. 2002, Cauza et al. 2005, Sigal et al. 2007, Smutok et al. 1993, Cheung et al. 2009, Reynolds et al. 2004, Ryan et al. 2001, Pratley et al. 1994, Hunter et al. 2002, Schmitz et al. 2003, Treuth et al. 1994, Treuth et al. 1995, Balducci et al. 2004, Dunstan et al. 2002, LeMura et al. 2000, Kokkinos et al. 1991, Honkola et al. 1997, Cononie et al. 1991, Martel et al. 1999). Those using shorter lasting protocols typically use RT frequencies of 3 times a week or more (Baldi & Snowling 2003, Ishii et al. 1998, Bweir et al. 2009, Miller et al. 1984, Geirsdottir et al. 2012, Klimcakova et al. 2006, Campbell et al. 1994, Kwon et al. 2010, Manning et al. 1991, Fahlman et al. 2002, Misra et al. 2008, Harris & Holly 1987). Overall, in the literature, the total number of RT sessions per study ranges from approximately 27- 156 sessions, with the average being ~48 sessions. There appears to be only one study investigating the effects of short-term (<16 weeks), low frequency (<3 times a week) RT alone on risk factors for the metabolic syndrome (Staron et al. 2000). This study reported that 16 sessions of high-intensity RT (3 sets of 6-10RM to failure) did not alter lipid levels in young, healthy men. Therefore, to the author’s knowledge, this is the first study to report improvements in risk factors for the metabolic syndrome in elderly men and women following short-term (<16
  • 63.
    63 weeks), low frequency(<3 times a week) RT. Importantly, these improvements occurred after a total of only 24 training sessions – which is half the number typically used in the literature – demonstrating that low doses of RT can improve risk factors for the metabolic syndrome in the elderly in a meaningful way. Practical applications. The results of the present study have important practical implications, in terms of exercise participation and prescription. Above all, they suggest that RT is a viable method of preventing and treating chronic disease in the elderly. As a lack of time is the most commonly cited barrier to physical activity and exercise (Sallis JF 1999), the low-dosage nature of the present RT protocol will likely be attractive to older adults and the elderly. In addition, the low-intensity nature of the protocol also make it reasonable for this population. It is realistic to think many elderly individuals could incorporate a RT protocol like this one into their everyday life, without too much difficulty (only two hours of training per week). A theme that was identified consistently in the results was the relationship between baseline levels of variables and the change in these variables (PRE 1RM and 1RM change, r = -0.585, p<0.001; PRE SBP and SBP change, r = -0.439, p<0.001; PRE glucose_120 and glucose_120 change, r = -0.367, p<0.01 and PRE SBP and glucose_120 change, r = -0.330, p<0.05). This trend clearly has practical implications, and suggests that subjects in the present study that were most unhealthy at baseline benefited most from intervention used. It is possible that these results can be used to motivate sedentary, unhealthy individuals, demonstrating the positive impact of small amounts of RT. Overall, RT should be seen as a viable alternative, or supplement, to aerobic exercise, as a health-promoting tool to help prevent and treat chronic disease. It is important to note however that if the aim of an exercise intervention is to improve the lipid profile and/or DBP, the present findings suggest that RT may not be best suited to achieve these goals. Limitations. A limitation of the current study was that the training group was larger in size than the control group. This study was part of a larger project and the mismatch between the size of the training group and control group was to satisfy the future needs of the project.
  • 64.
    64 Two groups ofthe same size would have allowed for better comparison and analysis of the results. Another limitation of the study was related to the role of diet. Although all subjects were instructed to maintain their normal dietary habits, this was not specifically controlled (i.e. prepared meals, meal plans etc.). Dietary changes in either group throughout the study may have confounded the results and influenced the measured cardiometabolic risk factors. The gold standard of assessing insulin resistance is the hyperinsulinemic-euglycemic clamp method. This method is superior to an OGTT in assessing insulin resistance and would have led to a better understanding of what changes occurred in insulin following RT. However, it is not typically used in the clinical setting due to complexity and possible dangers. Similarly, a CT scan is the gold standard of assessing body composition, as it can differentiate between subcutaneous and visceral fat. This would have allowed for a better understanding of what occurred following RT in terms of abdominal adipose tissue. To investigate the underlying physiological mechanisms at play, a muscle biopsy would have provided important information regarding changes in muscle quality (i.e. changes in muscle fiber types, enzyme levels, protein concentrations etc.). Similarly, measuring inflammatory biomarker and adipocytokine levels may also have also provided insight into the physiological response to RT. None of these factors were measured presently.
  • 65.
    65 7 Conclusion This studydemonstrates that RT can have a positive effect on the overall health of elderly individuals. Further, the results suggest that RT can be used to improve risk factors for the metabolic syndrome in the elderly, namely reducing abdominal fat and systolic blood pressure while increasing glucose tolerance. Importantly, it appears that these improvements in cardiometabolic risk factors were clinically significant. It is unclear whether RT has a beneficial effect on DBP and the lipid profile – the present results suggest that it does not. The physiological mechanisms underlying improvements in the metabolic syndrome following RT have not been fully elucidated and remain complex. However, the results of this study emphasize the role of fat and obesity in both the development and the treatment/prevention of the metabolic syndrome The majority of studies in the literature use relatively long lasting, high-frequency protocols (~48 total training sessions) to investigate the effects of RT on cardiometabolic risk factors. The present study appears to be the first to show improvements in risk factors for the metabolic syndrome in the elderly following a short-term RT protocol with only 24 total training sessions. The present study should be considered when prescribing exercise for the elderly. The results suggest that small doses of RT can have a significant, health-promoting effect – an important point when considering that a lack of time is a major barrier to exercise participation. As the results suggest that elderly individuals who are unhealthy would benefit most from the present intervention, it is possible that this study can be used to motivate sedentary, unhealthy individuals, demonstrating the positive impact of small amounts of RT.
  • 66.
    66 8 References Ahmed, S.M., Clasen, M. E. & Donnelly, J. E. 1998. Management of dyslipidemia in adults. American Family Physician, 57 (9), 2192-2204, 2207-8. Alberti, K. G., Eckel, R. H., Grundy, S. M., Zimmet, P. Z., Cleeman, J. I., Donato, K. A., Fruchart, J. C., James, W. P., Loria, C. M. & Smith, S. C. 2009. Harmonizing the metabolic syndrome: a joint interim statement of the International Diabetes Federation Task Force on Epidemiology and Prevention; National Heart, Lung, and Blood Institute; American Heart Association; World Heart Federation; International Atherosclerosis Society; and International Association for the Study of Obesity. Circulation, 120 (16), 1640-1645. Alberti, K. G., Zimmet, P., Shaw, J. & IDF Epidemiology Task Force Consensus Group 2005. The metabolic syndrome - a new worldwide definition. Lancet, 366 (9491), 1059-1062. Alberti, K. G. & Zimmet, P. Z. 1998. Definition, diagnosis and classification of diabetes mellitus and its complications. Part 1: diagnosis and classification of diabetes mellitus provisional report of a WHO consultation. Diabetic Medicine: A Journal of the British Diabetic Association, 15 (7), 539-553. Aoyagi, Y. & Shephard, R. J. 1992. Aging and muscle function. Sports Medicine, (6), 376- 396. Ayala, J. E., Bracy, D. P., Malabanan, C., James, F. D., Ansari, T., Fueger, P. T., McGuinness, O. P. & Wasserman, D. H. 2011. Hyperinsulinemic-euglycemic clamps in conscious, unrestrained mice. Journal of Visualized Experiments, 57, 3188 Baldi, J. C. & Snowling, N. 2003. Resistance training improves glycaemic control in obese type 2 diabetic men. International Journal of Sports Medicine, 24 (6), 419-423. Balducci, S., Leonetti, F., Di Mario, U. & Fallucca, F. 2004. Is a long-term aerobic plus resistance training program feasible for and effective on metabolic profiles in type 2 diabetic patients? Diabetes Care, 27 (3), 841-842. Barter, P., Gotto, A. M., LaRosa, J. C., Maroni, J., Szarek, M., Grundy, S. M., Kastelein, J. J., Bittner, V., Fruchart, J. C. & Treating to New Targets Investigators 2007. HDL cholesterol, very low levels of LDL cholesterol, and cardiovascular events. The New England Journal of Medicine, 357 (13), 1301-1310. Bechtold, M., Palmer, J., Valtos, J., Iasiello, C. & Sowers, J. 2006. Metabolic syndrome in the elderly. Current Diabetes Reports, 6 (1), 64-71.
  • 67.
    67 Boden, G. &Shulman, G. I. 2002. Free fatty acids in obesity and type 2 diabetes: defining their role in the development of insulin resistance and beta-cell dysfunction. European Journal of Clinical Investigation, 32(3), 14-23. Braith, R. W. & Stewart, K. J. 2006. Resistance exercise training: its role in the prevention of cardiovascular disease. Circulation, 113 (22), 2642-2650. Brooks, N., Layne, J. E., Gordon, P. L., Roubenoff, R., Nelson, M. E. & Castaneda-Sceppa, C. 2006. Strength training improves muscle quality and insulin sensitivity in Hispanic older adults with type 2 diabetes. International Journal of Medical Sciences, 4 (1), 19- 27. Bweir, S., Al-Jarrah, M., Almalty, A. M., Maayah, M., Smirnova, I. V., Novikova, L. & Stehno-Bittel, L. 2009. Resistance exercise training lowers HbA1c more than aerobic training in adults with type 2 diabetes. Diabetology & Metabolic Syndrome, 1, 27 Byrne, C. D. & Wild, S. H. 2011. The metabolic syndrome (Second edition). Chichester, West Sussex: Wiley-Blackwell. Byrne, H. K. & Wilmore, J. H. 2000. The effects of resistance training on resting blood pressure. The Journal of Strength & Conditioning Research, 14(4). Cai, D., Yuan, M., Frantz, D. F., Melendez, P. A., Hansen, L., Lee, J. & Shoelson, S. E. 2005. Local and systemic insulin resistance resulting from hepatic activation of IKK- beta and NF-kappaB. Nature Medicine, 11 (2), 183-190. Campbell, W. W., Crim, M. C., Young, V. R. & Evans, W. J. 1994. Increased energy requirements and changes in body composition with resistance training in older adults. The American Journal of Clinical Nutrition, 60 (2), 167-175. Castaneda, C., Layne, J. E., Munoz-Orians, L., Gordon, P. L., Walsmith, J., Foldvari, M., Roubenoff, R., Tucker, K. L. & Nelson, M. E. 2002. A randomized controlled trial of resistance exercise training to improve glycemic control in older adults with type 2 diabetes. Diabetes Care 25 (12), 2335-2341. Cauza, E., Hanusch-Enserer, U., Strasser, B., Ludvik, B., Metz-Schimmerl, S., Pacini, G., Wagner, O., Georg, P., Prager, R., Kostner, K., Dunky, A. & Haber, P. 2005. The relative benefits of endurance and strength training on the metabolic factors and muscle function of people with type 2 diabetes mellitus. Archives of Physical Medicine and Rehabilitation, 86 (8), 1527-1533. Chao, D., Foy, C. G. & Farmer, D. 2000. Exercise adherence among older adults: challenges and strategies. Controlled Clinical Trials, 21 (5), 212-217. Chen, Z., Wang, Z., Lohman, T., Heymsfield, S. B., Outwater, E., Nicholas, J. S., Bassford, T., LaCroix, A., Sherrill, D., Punyanitya, M., Wu, G. & Going, S. 2007. Dual-energy
  • 68.
    68 X-ray absorptiometry isa valid tool for assessing skeletal muscle mass in older women. The Journal of Nutrition, 137 (12), 2775-2780. Cheung, N. W., Cinnadaio, N., Russo, M. & Marek, S. 2009. A pilot randomised controlled trial of resistance exercise bands in the management of sedentary subjects with type 2 diabetes. Diabetes Research and Clinical Practice, 83 (3), 68-71. Clarkson, P. M., Hintermister, R., Fillyaw, M. & Stylos, L. 1981. High density lipoprotein cholesterol in young adult weight lifters, runners and untrained subjects. Human Biology, 53 (2), 251-257. Collier, S. R., Kanaley, J. A., Carhart, R., Frechette, V., Tobin, M. M., Hall, A. K., Luckenbaugh, A. N. & Fernhall, B. 2008. Effect of 4 weeks of aerobic or resistance exercise training on arterial stiffness, blood flow and blood pressure in pre- and stage-1 hypertensives. Journal of Human Hypertension 22 (10), 678-686. Cononie, C. C., Graves, J. E., Pollock, M. L., Phillips, M. I., Sumners, C. & Hagberg, J. M. 1991. Effect of exercise training on blood pressure in 70- to 79-yr-old men and women. Medicine and Science in Sports and Exercise 23 (4), 505-511. Cornelissen, V. A. & Fagard, R. H. 2005. Effect of resistance training on resting blood pressure: a meta-analysis of randomized controlled trials. Journal of Hypertension, 23 (2), 251-259. Crook, M.A. 2012. Clinical biochemistry and metabolic medicine (Eight edition). London: Hodder Education. Dandona, P., Aljada, A. & Bandyopadhyay, A. 2004. Inflammation: the link between insulin resistance, obesity and diabetes. Trends in Immunology, 25 (1), 4-7. DeFronzo, R. A. & Ferrannini, E. 1991. Insulin resistance. A multifaceted syndrome responsible for NIDDM, obesity, hypertension, dyslipidemia, and atherosclerotic cardiovascular disease. Diabetes Care, 14 (3), 173-194. DeFronzo, R. A., Ferrannini, E., Sato, Y., Felig, P. & Wahren, J. 1981. Synergistic interaction between exercise and insulin on peripheral glucose uptake. Journal of Clinical Investigation, 68 (6), 1468-1474. DiFrancisco-Donoghue, J., Werner, W. & Douris, P. C. 2007. Comparison of once-weekly and twice-weekly strength training in older adults. British Journal of Sports Medicine 41 (1), 19-22. Dunstan, D. W., Daly, R. M., Owen, N., Jolley, D., De Courten, M., Shaw, J. & Zimmet, P. 2002. High-intensity resistance training improves glycemic control in older patients with type 2 diabetes. Diabetes Care, 25 (10), 1729-1736.
  • 69.
    69 Expert Panel onDetection, Evaluation, and Treatment of High Blood Cholesterol in Adults. 2001. Executive summary of the third report of the national cholesterol education program (NCEP) expert panel on detection, evaluation, and treatment of high blood cholesterol in adults (Adult Treatment Panel III). Journal of American Medical Association, 285 (19), 2486-2497. Egger, A., Niederseer, D., Diem, G., Finkenzeller, T., Ledl-Kurkowski, E., Forstner, R., Pirich, C., Patsch, W., Weitgasser, R. & Niebauer, J. 2013. Different types of resistance training in type 2 diabetes mellitus: effects on glycaemic control, muscle mass and strength. European Journal of Preventive Cardiology, 20 (6), 1051-1060. Fahlman, M. M., Boardley, D., Lambert, C. P. & Flynn, M. G. 2002. Effects of endurance training and resistance training on plasma lipoprotein profiles in elderly women. Biological Sciences and Medical Sciences, 57 (2), 54-60. Fahs, C. A., Heffernan, K. S., Ranadive, S., Jae, S. Y. & Fernhall, B. 2010. Muscular strength is inversely associated with aortic stiffness in young men. Medicine and Science in Sports and Exercise, 42 (9), 1619-1624. Fisher, M. M. 2001. The effect of resistance exercise on recovery blood pressure in normotensive and borderline hypertensive women. Journal of Strength and Conditioning Research, 15 (2), 210-216. Fleck, S. J. & Falkel, J. E. 1986. Value of resistance training for the reduction of sports injuries. Sports Medicine, 3 (1), 61-68. Flegal, K. M., Carroll, M. D., Ogden, C. L. & Johnson, C. L. 2002. Prevalence and trends in obesity among US adults, 1999-2000. Journal of American Medical Association, 288 (14), 1723-1727. Ford, E. S., Giles, W. H. & Dietz, W. H. 2002. Prevalence of the metabolic syndrome among US adults: findings from the third National Health and Nutrition Examination Survey. Journal of American Medical Association, 287 (3), 356-359. Frank, E. A., Shubha, M. C. & D'Souza, C. J. 2012. Blood glucose determination: plasma or serum? Journal of Clinical Laboratory Analysis, 26 (5), 317-320. Galvao, D. A. & Taaffe, D. R. 2005. Resistance exercise dosage in older adults: single- versus multiset effects on physical performance and body composition. Journal of the American Geriatrics Society, 53 (12), 2090-2097. Geirsdottir, O. G., Arnarson, A., Briem, K., Ramel, A., Jonsson, P. V. & Thorsdottir, I. 2012. Effect of 12-week resistance exercise program on body composition, muscle strength, physical function, and glucose metabolism in healthy, insulin-resistant, and diabetic elderly Icelanders. Biological Sciences and Medical Sciences, 67 (11), 1259- 1265.
  • 70.
    70 Glickman, S. G.,Marn, C. S., Supiano, M. A. & Dengel, D. R. 2004. Validity and reliability of dual-energy X-ray absorptiometry for the assessment of abdominal adiposity. Journal of Applied Physiology, 97 (2), 509-514. Goldberg, A. P. 1989. Aerobic and resistive exercise modify risk factors for coronary heart disease. Medicine and Science in Sports and Exercise, 21 (6), 669-674. Goldberg, L., Elliot, D. L., Schutz, R. W. & Kloster, F. E. 1984. Changes in lipid and lipoprotein levels after weight training. Journal of American Medical Association, 252 (4), 504-506. Gutierrez-Fisac, J. L., Banegas Banegas, J. R., Artalejo, F. R. & Regidor, E. 2000. Increasing prevalence of overweight and obesity among Spanish adults, 1987-1997. Journal of the International Association for the Study of Obesity, 24 (12), 1677-1682. Hagberg, J. M., Ehsani, A. A., Goldring, D., Hernandez, A., Sinacore, D. R. & Holloszy, J. O. 1984. Effect of weight training on blood pressure and hemodynamics in hypertensive adolescents. The Journal of Pediatrics, 104 (1), 147-151. Halliwell, B. 1995. Antioxidant characterization. Methodology and mechanism. Biochemical Pharmacology, 49 (10), 1341-1348. Hardy, D. O. & Tucker, L. A. 1998. The effects of a single bout of strength training on ambulatory blood pressure levels in 24 mildly hypertensive men. American Journal of Health Promotion, 13 (2), 69-72. Harris, K. A. & Holly, R. G. 1987. Physiological response to circuit weight training in borderline hypertensive subjects. Medicine and Science in Sports and Exercise, 19 (3), 246-252. Honkola, A., Forsen, T. & Eriksson, J. 1997. Resistance training improves the metabolic profile in individuals with type 2 diabetes. Acta Diabetologica, 34 (4), 245-248. Hooper, L., Abdelhamid, A., Moore, H. J., Douthwaite, W., Skeaff, C. M. & Summerbell, C. D. 2012. Effect of reducing total fat intake on body weight: systematic review and meta-analysis of randomised controlled trials and cohort studies. British Medical Journal, 345. Huang, J., Frohlich, J. & Ignaszewski, A. P. 2011. The impact of dietary changes and dietary supplements on lipid profile. The Canadian Journal of Cardiology, 27 (4), 488- 505. Hunter, G. R., Brock, D. W., Byrne, N. M., Chandler-Laney, P. C., Del Corral, P. & Gower, B. A. 2010. Exercise training prevents regain of visceral fat for 1 year following weight loss. Obesity, 18 (4), 690-695.
  • 71.
    71 Hunter, G. R.,Bryan, D. R., Wetzstein, C. J., Zuckerman, P. A. & Bamman, M. M. 2002. Resistance training and intra-abdominal adipose tissue in older men and women. Medicine and Science in Sports and Exercise, 34 (6), 1023-1028. Hunter, G. R., Wetzstein, C. J., Fields, D. A., Brown, A. & Bamman, M. M. 2000. Resistance training increases total energy expenditure and free-living physical activity in older adults. Journal of Applied Physiology, 89 (3), 977-984. Hurley, B. F. 1989. Effects of resistive training on lipoprotein-lipid profiles: a comparison to aerobic exercise training. Medicine and Science in Sports and Exercise, 21 (6), 689- 693. Hurley, B. F., Hagberg, J. M., Goldberg, A. P., Seals, D. R., Ehsani, A. A., Brennan, R. E. & Holloszy, J. O. 1988. Resistive training can reduce coronary risk factors without altering VO2max or percent body fat. Medicine and Science in Sports and Exercise, 20 (2), 150-154. Hurley, B. F., Hanson, E. D. & Sheaff, A. K. 2011. Strength training as a countermeasure to aging muscle and chronic disease. Sports Medicine, 41 (4), 289-306. Ibanez, J., Izquierdo, M., Arguelles, I., Forga, L., Larrion, J. L., Garcia-Unciti, M., Idoate, F. & Gorostiaga, E. M. 2005. Twice-weekly progressive resistance training decreases abdominal fat and improves insulin sensitivity in older men with type 2 diabetes. Diabetes Care, 28 (3), 662-667. Ilanne-Parikka, P., Eriksson, J. G., Lindstrom, J., Hamalainen, H., Keinanen-Kiukaanniemi, S., Laakso, M., Louheranta, A., Mannelin, M., Rastas, M., Salminen, V., Aunola, S., Sundvall, J., Valle, T., Lahtela, J., Uusitupa, M., Tuomilehto, J. & Finnish Diabetes Prevention Study Group. 2004. Prevalence of the metabolic syndrome and its components: findings from a Finnish general population sample and the Diabetes Prevention Study cohort. Diabetes Care, 27 (9), 2135-2140. Ishii, T., Yamakita, T., Sato, T., Tanaka, S. & Fujii, S. 1998. Resistance training improves insulin sensitivity in NIDDM subjects without altering maximal oxygen uptake. Diabetes Care, 21 (8), 1353-1355. Kaminsky, L., Ozemek, C., Williams, K. & Byun, W. 2014. Precision of total and regional body fat estimates from dual-energy X-ray absorptiometer measurements. The Journal of Nutrition, Health and Aging, 18(6), 591-594. Kanda, H., Tateya, S., Tamori, Y., Kotani, K., Hiasa, K., Kitazawa, R., Kitazawa, S., Miyachi, H., Maeda, S., Egashira, K. & Kasuga, M. 2006. MCP-1 contributes to macrophage infiltration into adipose tissue, insulin resistance, and hepatic steatosis in obesity. The Journal of Clinical Investigation, 116 (6), 1494-1505.
  • 72.
    72 Kang, S. M.,Yoon, J. W., Ahn, H. Y., Kim, S. Y., Lee, K. H., Shin, H., Choi, S. H., Park, K. S., Jang, H. C. & Lim, S. 2011. Android fat depot is more closely associated with metabolic syndrome than abdominal visceral fat in elderly people. Public Library of Science ONE, 6 (11), e27694. Kannel, W. B. 1996. Blood pressure as a cardiovascular risk factor: prevention and treatment. Journal of American Medical Association, 275 (20), 1571-1576. Kaul, S., Rothney, M. P., Peters, D. M., Wacker, W. K., Davis, C. E., Shapiro, M. D. & Ergun, D. L. 2012. Dual-energy X-ray absorptiometry for quantification of visceral fat. Obesity, 20 (6), 1313-1318. Kaur, J. 2014. A comprehensive review on metabolic syndrome. Cardiology Research and Practice, 2014 (2014). Kelley, G. A. & Kelley, K. S. 2009. Impact of progressive resistance training on lipids and lipoproteins in adults: a meta-analysis of randomized controlled trials. Preventive Medicine, 48 (1), 9-19. Kelley, G. A. & Kelley, K. S. 2000. Progressive resistance exercise and resting blood pressure : A meta-analysis of randomized controlled trials. Hypertension, 35 (3), 838- 843. Keys, A., Karvonen, M. J. & Fidanza, F. 1958. Serum-cholesterol studies in Finland. The Lancet, 272 (7039), 175-178. Khamaisi, M., Potashnik, R., Tirosh, A., Demshchak, E., Rudich, A., Tritschler, H., Wessel, K. & Bashan, N. 1997. Lipoic acid reduces glycemia and increases muscle GLUT4 content in streptozotocin-diabetic rats. Metabolism: Clinical and Experimental, 46 (7), 763-768. Klimcakova, E., Polak, J., Moro, C., Hejnova, J., Majercik, M., Viguerie, N., Berlan, M., Langin, D. & Stich, V. 2006. Dynamic strength training improves insulin sensitivity without altering plasma levels and gene expression of adipokines in subcutaneous adipose tissue in obese men. The Journal of Clinical Endocrinology and Metabolism, 91 (12), 5107-5112. Kokkinos, P. F., Hurley, B. F., Smutok, M. A., Farmer, C., Reece, C., Shulman, R., Charabogos, C., Patterson, J., Will, S. & Devane-Bell, J. 1991. Strength training does not improve lipoprotein-lipid profiles in men at risk for CHD. Medicine and Science in Sports and Exercise, 23 (10), 1134-1139. Komi, P. V. 2003. Strength and power in sport. (Second edition). Osney Mead, Oxford: Blackwell Science.
  • 73.
    73 Konrad, T., Vicini,P., Kusterer, K., Hoflich, A., Assadkhani, A., Bohles, H. J., Sewell, A., Tritschler, H. J., Cobelli, C. & Usadel, K. H. 1999. alpha-Lipoic acid treatment decreases serum lactate and pyruvate concentrations and improves glucose effectiveness in lean and obese patients with type 2 diabetes. Diabetes Care, 22 (2), 280-287. Kraemer, W. J. & Ratamess, N. A. 2004. Fundamentals of resistance training: progression and exercise prescription. Medicine and Science in Sports and Exercise, 36 (4), 674- 688. Kwon, H. R., Han, K. A., Ku, Y. H., Ahn, H. J., Koo, B. K., Kim, H. C. & Min, K. W. 2010. The effects of resistance training on muscle and body fat mass and muscle strength in type 2 diabetic women. Korean Diabetes Journal, 34 (2), 101-110. Layne, J. E. & Nelson, M. E. 1999. The effects of progressive resistance training on bone density: a review. Medicine and Science in Sports and Exercise 31 (1), 25-30. Lechleitner, M. 2008. Obesity and the metabolic syndrome in the elderly-a mini-review. Gerontology, 54 (5), 253-259. LeMura, L. M., von Duvillard, S. P., Andreacci, J., Klebez, J. M., Chelland, S. A. & Russo, J. 2000. Lipid and lipoprotein profiles, cardiovascular fitness, body composition, and diet during and after resistance, aerobic and combination training in young women. European Journal of Applied Physiology, 82 (5), 451-458. Levinger, I., Goodman, C., Hare, D. L., Jerums, G. & Selig, S. 2007. The effect of resistance training on functional capacity and quality of life in individuals with high and low numbers of metabolic risk factors. Diabetes Care 30 (9), 2205-2210. Levinger, I., Goodman, C., Hare, D. L., Jerums, G., Toia, D. & Selig, S. 2009. The reliability of the 1RM strength test for untrained middle-aged individuals. Sports Medicine Australia, 12 (2), 310-316. Lira, F. S., Yamashita, A. S., Uchida, M. C., Zanchi, N. E., Gualano, B., Martins, E., Caperuto, E. C. & Seelaender, M. 2010. Low and moderate, rather than high intensity strength exercise induces benefit regarding plasma lipid profile. Diabetology & Metabolic Syndrome, 2 (1), 31. Malik, S., Wong, N. D., Franklin, S. S., Kamath, T. V., L'Italien, G. J., Pio, J. R. & Williams, G. R. 2004. Impact of the metabolic syndrome on mortality from coronary heart disease, cardiovascular disease, and all causes in United States adults. Circulation, 110 (10), 1245-1250. Mann, S., Beedie, C. & Jimenez, A. 2014. Differential effects of aerobic exercise, resistance training and combined exercise modalities on cholesterol and the lipid profile: review, synthesis and recommendations. Sports Medicine, 44 (2), 211-221.
  • 74.
    74 Manning, J. M.,Dooly-Manning, C. R., White, K., Kampa, I., Silas, S., Kesselhaut, M. & Ruoff, M. 1991. Effects of a resistive training program on lipoprotein--lipid levels in obese women. Medicine and Science in Sports and Exercise, 23 (11), 1222-1226. Martel, G. F., Hurlbut, D. E., Lott, M. E., Lemmer, J. T., Ivey, F. M., Roth, S. M., Rogers, M. A., Fleg, J. L. & Hurley, B. F. 1999. Strength training normalizes resting blood pressure in 65- to 73-year-old men and women with high normal blood pressure. Journal of the American Geriatrics Society, 47 (10), 1215-1221. Meigs, J. B., Nathan, D. M., D'Agostino RB, S., Wilson, P. W. & Framingham Offspring Study 2002. Fasting and postchallenge glycemia and cardiovascular disease risk: the Framingham Offspring Study. Diabetes Care, 25 (10), 1845-1850. Metter, E. J., Windham, B. G., Maggio, M., Simonsick, E. M., Ling, S. M., Egan, J. M. & Ferrucci, L. 2008. Glucose and insulin measurements from the oral glucose tolerance test and mortality prediction. Diabetes Care, 31 (5), 1026-1030. Miazgowski, T., Krzyzanowska-Swiniarska, B., Dziwura-Ogonowska, J. & Widecka, K. 2014. The associations between cardiometabolic risk factors and visceral fat measured by a new dual-energy X-ray absorptiometry-derived method in lean healthy Caucasian women. Endocrine, 47 (2), 500-505. Miller, J. P., Pratley, R. E., Goldberg, A. P., Gordon, P., Rubin, M., Treuth, M. S., Ryan, A. S. & Hurley, B. F. 1994. Strength training increases insulin action in healthy 50- to 65- yr-old men. Journal of Applied Physiology, 77 (3), 1122-1127. Miller, W. J., Sherman, W. M. & Ivy, J. L. 1984. Effect of strength training on glucose tolerance and post-glucose insulin response. Medicine and Science in Sports and Exercise 16 (6), 539-543. Misra, A., Alappan, N. K., Vikram, N. K., Goel, K., Gupta, N., Mittal, K., Bhatt, S. & Luthra, K. 2008. Effect of supervised progressive resistance-exercise training protocol on insulin sensitivity, glycemia, lipids, and body composition in Asian Indians with type 2 diabetes. Diabetes Care 31 (7), 1282-1287. Miura, H., Takahashi, Y., Maki, Y. & Sugino, M. 2015. Effects of exercise training on arterial stiffness in older hypertensive females. European Journal of Applied Physiology, 115, 1847-1854. Mooradian, A. D. 2009. Dyslipidemia in type 2 diabetes mellitus. Endocrinology & Metabolism 5 (3), 150-159. Mourad, J. J. 2008. The evolution of systolic blood pressure as a strong predictor of cardiovascular risk and the effectiveness of fixed-dose ARB/CCB combinations in lowering levels of this preferential target. Vascular Health and Risk Management, 4 (6), 1315-1325.
  • 75.
    75 Obici, S., Feng,Z., Karkanias, G., Baskin, D. G. & Rossetti, L. 2002a. Decreasing hypothalamic insulin receptors causes hyperphagia and insulin resistance in rats. Nature Neuroscience, 5 (6), 566-572. Obici, S., Feng, Z., Morgan, K., Stein, D., Karkanias, G. & Rossetti, L. 2002b. Central administration of oleic acid inhibits glucose production and food intake. Diabetes, 51 (2), 271-275. Ockene, I. S., Chiriboga, D. E., Stanek, E. J., Harmatz, M. G., Nicolosi, R., Saperia, G., Well, A. D., Freedson, P., Merriam, P. A., Reed, G., Ma, Y., Matthews, C. E. & Hebert, J. R. 2004. Seasonal variation in serum cholesterol levels: treatment implications and possible mechanisms. Archives of Internal Medicine, 164 (8), 863- 870. Ozawa, K., Miyazaki, M., Matsuhisa, M., Takano, K., Nakatani, Y., Hatazaki, M., Tamatani, T., Yamagata, K., Miyagawa, J., Kitao, Y., Hori, O., Yamasaki, Y. & Ogawa, S. 2005. The endoplasmic reticulum chaperone improves insulin resistance in type 2 diabetes. Diabetes, 54 (3), 657-663. Ozcan, U., Cao, Q., Yilmaz, E., Lee, A. H., Iwakoshi, N. N., Ozdelen, E., Tuncman, G., Gorgun, C., Glimcher, L. H. & Hotamisligil, G. S. 2004. Endoplasmic reticulum stress links obesity, insulin action, and type 2 diabetes. Science, 306 (5695), 457-461. Park, S. W., Goodpaster, B. H., Lee, J. S., Kuller, L. H., Boudreau, R., de Rekeneire, N., Harris, T. B., Kritchevsky, S., Tylavsky, F. A., Nevitt, M., Cho, Y. W., Newman, A. B. & Health, Aging,and Body Composition Study 2009. Excessive loss of skeletal muscle mass in older adults with type 2 diabetes. Diabetes Care, 32 (11), 1993-1997. Park, S. W., Goodpaster, B. H., Strotmeyer, E. S., de Rekeneire, N., Harris, T. B., Schwartz, A. V., Tylavsky, F. A. & Newman, A. B. 2006. Decreased muscle strength and quality in older adults with type 2 diabetes: the health, aging, and body composition study. Diabetes, 55 (6), 1813-1818. Park, S. W., Goodpaster, B. H., Strotmeyer, E. S., Kuller, L. H., Broudeau, R., Kammerer, C., de Rekeneire, N., Harris, T. B., Schwartz, A. V., Tylavsky, F. A., Cho, Y. W., Newman, A. B. & Health, Aging,and Body Composition Study 2007. Accelerated loss of skeletal muscle strength in older adults with type 2 diabetes: the health, aging, and body composition study. Diabetes Care, 30 (6), 1507-1512. Petersen, K. F., Befroy, D., Dufour, S., Dziura, J., Ariyan, C., Rothman, D. L., DiPietro, L., Cline, G. W. & Shulman, G. I. 2003. Mitochondrial dysfunction in the elderly: possible role in insulin resistance. Science, 300 (5622), 1140-1142. Petersen, K. F. & Shulman, G. I. 2006. Etiology of insulin resistance. The American Journal of Medicine, 119 (5), 10-16.
  • 76.
    76 Pollex, R. L.& Hegele, R. A. 2006. Genetic determinants of the metabolic syndrome. Cardiovascular Medicine, 3 (9), 482-489. Pratley, R., Nicklas, B., Rubin, M., Miller, J., Smith, A., Smith, M., Hurley, B. & Goldberg, A. 1994. Strength training increases resting metabolic rate and norepinephrine levels in healthy 50- to 65-yr-old men. Journal of Applied Physiology, 76 (1), 133-137. Qatanani, M. & Lazar, M. A. 2007. Mechanisms of obesity-associated insulin resistance: many choices on the menu. Genes & Development, 21 (12), 1443-1455. Rader, D. J. 2007. Effect of insulin resistance, dyslipidemia, and intra-abdominal adiposity on the development of cardiovascular disease and diabetes mellitus. The American Journal of Medicine 120 (3), 12-18. Reaven, G. M. 1988. Banting lecture 1988. Role of insulin resistance in human disease. Diabetes, 37 (12), 1595-1607. Reynolds, T. H., Supiano, M. A. & Dengel, D. R. 2004. Resistance training enhances insulin-mediated glucose disposal with minimal effect on the tumor necrosis factor- alpha system in older hypertensives. Metabolism: Clinical and Experimental 53 (3), 397-402. Rice, B., Janssen, I., Hudson, R. & Ross, R. 1999. Effects of aerobic or resistance exercise and/or diet on glucose tolerance and plasma insulin levels in obese men. Diabetes Care, 22 (5), 684-691. Ross, R., Rissanen, J., Pedwell, H., Clifford, J. & Shragge, P. 1996. Influence of diet and exercise on skeletal muscle and visceral adipose tissue in men. Journal of Applied Physiology, 81 (6), 2445-2455. Ryan, A. S., Hurlbut, D. E., Lott, M. E., Ivey, F. M., Fleg, J., Hurley, B. F. & Goldberg, A. P. 2001. Insulin action after resistive training in insulin resistant older men and women. Journal of the American Geriatrics Society, 49 (3), 247-253. Sallis JF, O. N. 1999. Determinants of physical activity: physical activity and behavioral medicine. Thousand Oaks: Sage Publications. Salvetti, A., Brogi, G., Di Legge, V. & Bernini, G. P. 1993. The inter-relationship between insulin resistance and hypertension. Drugs, 46 (2), 149-159. Scherzer, R., Shen, W., Bacchetti, P., Kotler, D., Lewis, C. E., Shlipak, M. G., Punyanitya, M., Heymsfield, S. B., Grunfeld, C. & Study of Fat Redistribution Metabolic Change in HIV Infection 2008. Comparison of dual-energy X-ray absorptiometry and magnetic resonance imaging-measured adipose tissue depots in HIV-infected and control subjects. The American Journal of Clinical Nutrition, 88 (4), 1088-1096.
  • 77.
    77 Schmitz, K. H.,Jensen, M. D., Kugler, K. C., Jeffery, R. W. & Leon, A. S. 2003. Strength training for obesity prevention in midlife women. Journal of the International Association for the Study of Obesity, 27 (3), 326-333. Schumann, M., Kuusmaa, M., Newton, R. U., Sirparanta, A. I., Syvaoja, H., Hakkinen, A. & Hakkinen, K. 2014. Fitness and lean mass increases during combined training independent of loading order. Medicine and Science in Sports and Exercise, 46 (9), 1758-1768. Shoelson, S. E., Lee, J. & Goldfine, A. B. 2006. Inflammation and insulin resistance. The Journal of Clinical Investigation, 116 (7), 1793-1801. Sigal, R. J., Kenny, G. P., Boule, N. G., Wells, G. A., Prud'homme, D., Fortier, M., Reid, R. D., Tulloch, H., Coyle, D., Phillips, P., Jennings, A. & Jaffey, J. 2007. Effects of aerobic training, resistance training, or both on glycemic control in type 2 diabetes: a randomized trial. Annals of Internal Medicine, 147 (6), 357-369. Singh, I. M., Shishehbor, M. H. & Ansell, B. J. 2007. High-density lipoprotein as a therapeutic target: a systematic review. Journal of American Medical Association, 298 (7), 786-798. Smutok, M. A., Reece, C., Kokkinos, P. F., Farmer, C., Dawson, P., Shulman, R., DeVane- Bell, J., Patterson, J., Charabogos, C. & Goldberg, A. P. 1993. Aerobic versus strength training for risk factor intervention in middle-aged men at high risk for coronary heart disease. Metabolism: Clinical and Experimental, 42 (2), 177-184. Snowling, N. J. & Hopkins, W. G. 2006. Effects of different modes of exercise training on glucose control and risk factors for complications in type 2 diabetic patients: a meta- analysis. Diabetes Care, 29 (11), 2518-2527. Staron, R. S., Murrax, T. E., Gilders, R. M., Hagerman, F. C., Hikida, R. S. & Ragg, K. E. 2000. Influence of resistance training on serum lipid and lipoprotein concentrations in young men and women. The Journal of Strength & Conditioning Research, 14(1). Steinberger, J., Moorehead, C., Katch, V. & Rocchini, A. P. 1995. Relationship between insulin resistance and abnormal lipid profile in obese adolescents. The Journal of Pediatrics, 126 (5), 690-695. Strasser, B. & Schobersberger, W. 2011. Evidence for resistance training as a treatment therapy in obesity. Journal of Obesity, 2011 (2011). Strasser, B., Siebert, U. & Schobersberger, W. 2010. Resistance training in the treatment of the metabolic syndrome: a systematic review and meta-analysis of the effect of resistance training on metabolic clustering in patients with abnormal glucose metabolism. Sports Medicine, 40 (5), 397-415.
  • 78.
    78 Stratton, I. M.,Adler, A. I., Neil, H. A., Matthews, D. R., Manley, S. E., Cull, C. A., Hadden, D., Turner, R. C. & Holman, R. R. 2000. Association of glycaemia with macrovascular and microvascular complications of type 2 diabetes: prospective observational study. British Medical Journal, 321 (7258), 405-412. Stults-Kolehmainen, M. A., Stanforth, P. R., Bartholomew, J. B., Lu, T., Abolt, C. J. & Sinha, R. 2013. DXA estimates of fat in abdominal, trunk and hip regions varies by ethnicity in men. Nutrition & Diabetes, 3(3), e64. Sundell, J. 2011. Resistance Training Is an Effective Tool against Metabolic and Frailty Syndromes. Advances in Preventive Medicine, 2011, 1-7. National High Blood Pressure Education Program Coordinating Committee. 2004. The seventh report of the Joint National Committee (JNC) on prevention, detection, evaluation, and treatment of high blood pressure. Hypertension, 42(6): 1206-1252. Tresierras, M. A. & Balady, G. J. 2009. Resistance training in the treatment of diabetes and obesity: mechanisms and outcomes. Journal of Cardiopulmonary Rehabilitation and Prevention, 29 (2), 67-75. Treuth, M. S., Hunter, G. R., Kekes-Szabo, T., Weinsier, R. L., Goran, M. I. & Berland, L. 1995. Reduction in intra-abdominal adipose tissue after strength training in older women. Journal of Applied Physiology, 78 (4), 1425-1431. Treuth, M. S., Ryan, A. S., Pratley, R. E., Rubin, M. A., Miller, J. P., Nicklas, B. J., Sorkin, J., Harman, S. M., Goldberg, A. P. & Hurley, B. F. 1994. Effects of strength training on total and regional body composition in older men. Journal of Applied Physiology, 77 (2), 614-620. Tsutsumi, T., Don, B. M., Zaichkowsky, L. D. & Delizonna, L. L. 1997. Physical fitness and psychological benefits of strength training in community dwelling older adults. Journal of Physiological Anthropology, 16 (6), 257-266. United Nations Population Division. 2013. World population ageing report 2013. New York. Verdijk, L. B., van Loon, L., Meijer, K. & Savelberg, H. H. 2009. One-repetition maximum strength test represents a valid means to assess leg strength in vivo in humans. Journal of Sports Sciences, 27 (1), 59-68. Walker, S., Peltonen, H. & Hakkinen, K. 2015. Medium-intensity, high-volume "hypertrophic" resistance training did not induce improvements in rapid force production in healthy older men. Age, 37 (3). Westcott, W. L. 2012. Resistance training is medicine: effects of strength training on health. Current Sports Medicine Reports, 11 (4), 209-216.
  • 79.
    79 Whelton, S. P.,Chin, A., Xin, X. & He, J. 2002. Effect of aerobic exercise on blood pressure: a meta-analysis of randomized, controlled trials. Annals of Internal Medicine, 136 (7), 493-503. Wu, S. H., Liu, Z. & Ho, S. C. 2010. Metabolic syndrome and all-cause mortality: a meta- analysis of prospective cohort studies. European Journal of Epidemiology, 25 (6), 375- 384. Yki-Jarvinen, H., Koivisto, V. A., Taskinen, M. R. & Nikkila, E. 1984. Glucose tolerance, plasma lipoproteins and tissue lipoprotein lipase activities in body builders. European Journal of Applied Physiology and Occupational Physiology, 53 (3), 253-259.