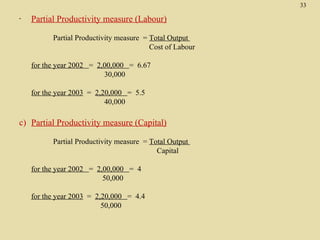
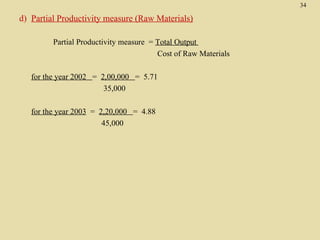
1


Operations Strategy
       and
 Competitiveness
2

          Operations Strategy as a
            competitive weapon
    One of the key objectives of any business
    organization is to reach a position where it is able to
    attract more customers than it’s competitors
•   Shorter Product Cycle / Pioneer status advantage
•   Production flexibility
•   Low-cost process (e.g. Outsourcing)
•   Convenience and Location (e.g. Courier services)
•   Product variety and Facility size (e.g. super markets)
•   Quality (e.g. MNCs’ producing cars in India for
    Exports)
Competitive                           3


                Dimensions
•   Cost or Price
    Make the Product or Deliver the Service Cheap
•   Quality
    Make a Great Product or Deliver a Great Service
•   Delivery Speed
    Make the Product or Deliver the Service Quickly
•   Delivery Reliability
    Deliver It When Promised
•   Coping with Changes in Demand
    Change Its Volume
•   Flexibility and New Product Introduction Speed
    Change It
•   Other Product-Specific Criteria
    Support It
Order Qualifiers and                      4


Winners
Defined
  Order   qualifiers are the basic
  criteria that permit the firms
  products to be considered as
  candidates for purchase by
  customers

  Order  winners are the criteria that
  differentiates the products and
  services of one firm from another
5


Service Breakthroughs

   A brand name car can be an
    “order qualifier”


•Repair services can be “order
winners”
    Examples: Warranty, Roadside Assistance,
    Leases, etc
6


    Operations Strategy
Strategy Process                  Example

 Customer Needs                  More Products


Corporate Strategy            Increase Org. Size


Operations Strategy        Increase Production Capacity


  Decisions on Processes
     and Infrastructure        Build New Factory
7


     Strategy Design Process

      Strategy Map                    What it is about!
     Financial Perspective        Improve Shareholder Value


    Customer Perspective          Customer Value Proposition


     Internal Perspective          Build-Increase-Achieve


Learning and Growth Perspective    A Motivated and Prepared
                                          Workforce
8


The Balanced Scorecard

 Judicious mix of financial and operational
 measures for measuring the performance

• Customer perspective
• Business process perspective
• Innovation and learning perspective
• Financial perspective
Balanced Scorecard Model for Measuring
Operations Performance How do
                       stakeholders view
                                     Operations?
                        Financial Perspective

                        Goals        Measures
 How do customers                               At which
 view the                                       Operations tasks
 Operations?                                    must we excel
 Customer Perspective
                                                   Internal / Process
 Goals       Measures                              Perspective
                                                   Goals        measures


                        Innovation & Learning
                        Perspective
                        Goals       Measures
10


Kaplan and Norton’s Generic
       Strategy Map
  In the Kaplan and Norton’s Generic Strategy
  Map, under the Financial Perspective, the
  Productivity Strategy is generally made up from
  two components:


  1. Improve cost structure: Lower direct and
     indirect costs
  2. Increase asset utilization: Reduce working
     and fixed capital
Kaplan and Norton’s                           11


  Generic Strategy Map
      (Continued)
  In the Kaplan and Norton’s Generic Strategy
   Map, under the Financial Perspective, the
   Revenue Growth Strategy is generally made
   up from two components:

• Build the franchise: Develop new sources of
  revenue
• Increase customer value: Work with
  existing customers to expand relationships
  with company
Kaplan and Norton’s                           12


  Generic Strategy Map
      (Continued)
  In the Kaplan and Norton’s Generic Strategy
  Map, under the Customer Perspective, there
  are three ways suggested as means of
  differentiating a company from others in a
  marketplace:

1. Product leadership
2. Customer intimacy
3. Operational excellence
13


Kaplan and Norton’s Generic
 Strategy Map (Continued)
     In the Kaplan and Norton’s Generic Strategy
    Map, under the Learning and Growth
    Perspective, there are three principle
    categories of intangible assets needed for
    learning:

    1. Strategic competencies
    2. Strategic technologies
    3. Climate for action
Developing an Operations Strategy
                                    Corporate
                                    Objectives
                                                                     Functional Areas
Business Plan
                                                                   Operations
                                                                   Marketing
Marketing Plan                 Business Strategies                 Financing/Accounting
                                                                   Research & Dev.
Budget                                    Strengths and Weaknesses Human Capital
                                  Operations
                                  Objectives
Production Plan


Other Plan
                              Operation Strategies


                 Long-range Decisions about
                 Products, Processes and Facilities
                 Position the Production System
                 Focus of Factories or Service Facilities
                 Product / Service Design and Development
                 Allocation of Resources to Alternatives
                 Facility Planning : Capacity, Location and Layout
15


 Steps in Developing a
Manufacturing Strategy


   1. Segment the market according to the
    product group
   2. Identify product requirements, demand
    patterns, and profit margins of each group
   3. Determine order qualifiers and winners for
    each group
   4. Convert order winners into specific
    performance requirements
16


Service Strategy Capacity
       Capabilities
 •   Process-based
     Capacities that transforms material or information and
       provide advantages on dimensions of cost and
       quality

 •   Systems-based
     Capacities that are broad-based involving the entire
       operating system and provide advantages of short
       lead times and customize on demand

 •   Organization-based
     Capacities that are difficult to replicate and provide
       abilities to master new technologies
17


What is Productivity?
Defined

Productivity is a common measure
on how well resources are being
used. In the broadest sense, it can
be defined as the following ratio:
                Outputs
                 Inputs
Productivity – Introduction &
                 Definition
•   Productivity primarily is an attitude of mind – an attitude of
    looking at the scope for improvement

•   It stands for the elimination of MUDA( Japanese ) or Waste
    in all forms

•   It is the function of providing more and more of everything,
    for more and more people with less and less consumption of
    Resources

•   The essence of productivity lies in producing the same
    volume with less resources or producing more output with
    proportionately less increase in inputs
Factors affecting Productivity
External Factors


  •    Beyond the control of individual Enterprise
  •    External Infrastructure
  •    Non- availability of Funds, Water, Power,
      Transportation
  •    Raw Material Supply constraints
  •    Government Policies ( Emission Laws etc.)
  •    Social / Political / Economic Environment
Factors affecting Productivity ( contd.)
Internal Factors


   • Hard Factors – Products / Technology / Plant & Eqpt.
     / Raw Materials


   • Soft Factors – People / Work Methods / Systems &
     Procedures / Organisation Structure / Management
     Practices
21

      Total Measure
       Productivity
Total Measure Productivity = Outputs
                               Inputs


                          or
          = Goods and services produced
                All resources used
22


       Partial Measure
        Productivity

   Partial measures of productivity =

   Output or Output or Output or Output
     Labor    Capital   Materials   Energy
23


    Multifactor Measure
        Productivity

   Multifactor measures of productivity =

                     Output                 .
          Labor   +   Capital   +   Energy

                        or

                     Output                 .
          Labor   +   Capital   +   Materials
Example of Productivity
                                                          24


         Measurement
   You have just determined that your service
    employees have used a total of 2400 hours of labor
    this week to process 560 insurance forms. Last
    week the same crew used only 2000 hours of labor
    to process 480 forms.
   Which productivity measure should be used?
   Answer: Could be classified as a Total Measure or
    Partial Measure.
   Is productivity increasing or decreasing?
   Answer: Last week’s productivity = 480/2000 = 0.24,
    and this week’s productivity is = 560/2400 = 0.23.
    So, productivity is decreasing slightly.
25


     Question Bowl
An operations strategy is concerned
    with which of the following?
b. Setting specific policies and plans
c. Short-term competitive strategies
d. Coordination of operational goals
e. All of the above
f. None of the above
  Answer: c. Coordination of operational
  goals
26


      Question Bowl
Typically a strategy breaks down
   into what major components?
b. Operations effectiveness
c. Customer management
d. Production innovation
e. All of the above
f. None of the above


Answer: d. All of the above
27


         Question Bowl
A criterion that differentiates the
   products and services of one firm
   from another can be which of the
   following?
b. An order qualifier
c. An order winner
d. PWP
e. KPI
f. None of the above
Answer: b. An order winner
28


             Question Bowl
     A travel agency processed 240 customers on Day 1
      with a staff of 12, and 360 customers the on Day 2
      with a staff of 15. What can be said about the
      productivity shift from Day 1 to Day 2?
↑     An increase in productivity from Day 1 to Day 2
↑     A decrease in productivity from Day 1 to Day 2
↑     The same productivity from Day 1 to Day 2
↑     Can not be computed from data above
↑     None of the above
    Answer: a. An increase in productivity from Day 1 to
       Day 2(Day 1 productivity = 240/12=20
    Day 2 productivity = 360/15=24)
29


       Question Bowl
In addition to traditional financial measures, what
    critical questions can a Balanced Scorecard
    help a company answer?
b.  How do customers see us?
c.  What must we excel at?
d.  How can we continue to improve and create
    value?
e.  All of the above
f.  None of the above

Answer: d. All of the above
30


              Solved Problems – OPERATIONS MANAGEMENT
                                 (Class of 2010)

  Q3. d) Various financial data for 2002 & 2003 follow. Calculate the total productivity
   measure and the partial measure for labour, capital and raw materials for this company
          for both years. What do these measures tell you about this company?
                           2002       2003
    Output      Sales        $      $2,20,000
                         2,00,000
     Input     Labour
                          30,000     40,000
               Raw
              Material    35,000     45,000

              Energy
                           5,000      6,000
               Capital
                          50,000     50,000
               Others
                           2,000      3,000
Answer :-         Total Productivity = Output
                                      Input
31


   Output           2002        2003
                     2,00,000    2,20,000


   Input            2002        2003

    Labour           30,000      40,000
    Raw Materials    35,000      45,000
    Energy            5,000       6,000
    Capital          50,000      50,000
    Others            2,000       3,000

    Total Inputs    1,22,000    1,44,000
32

a)   Total Productivity measure

     Year 2002

          Total Productivity = Output
                                Input

                            = 2,00,000
                              1,22,000

                            =   1.66
     Year 2003

          Total Productivity = 2,20,000
                              1,44,000

                             = 1.53
33

-   Partial Productivity measure (Labour)

          Partial Productivity measure = Total Output
                                         Cost of Labour

    for the year 2002 = 2,00,000 = 6.67
                          30,000

    for the year 2003 = 2,20,000 = 5.5
                           40,000

c) Partial Productivity measure (Capital)

          Partial Productivity measure = Total Output
                                           Capital

    for the year 2002 = 2,00,000 = 4
                          50,000

    for the year 2003 = 2,20,000 = 4.4
                          50,000
34

d) Partial Productivity measure (Raw Materials)

         Partial Productivity measure = Total Output
                                        Cost of Raw Materials

   for the year 2002 = 2,00,000 = 5.71
                        35,000

   for the year 2003 = 2,20,000 = 4.88
                        45,000

Ch2 op.str & comp.

  • 1.
    1 Operations Strategy and Competitiveness
  • 2.
    2 Operations Strategy as a competitive weapon One of the key objectives of any business organization is to reach a position where it is able to attract more customers than it’s competitors • Shorter Product Cycle / Pioneer status advantage • Production flexibility • Low-cost process (e.g. Outsourcing) • Convenience and Location (e.g. Courier services) • Product variety and Facility size (e.g. super markets) • Quality (e.g. MNCs’ producing cars in India for Exports)
  • 3.
    Competitive 3 Dimensions • Cost or Price Make the Product or Deliver the Service Cheap • Quality Make a Great Product or Deliver a Great Service • Delivery Speed Make the Product or Deliver the Service Quickly • Delivery Reliability Deliver It When Promised • Coping with Changes in Demand Change Its Volume • Flexibility and New Product Introduction Speed Change It • Other Product-Specific Criteria Support It
  • 4.
    Order Qualifiers and 4 Winners Defined Order qualifiers are the basic criteria that permit the firms products to be considered as candidates for purchase by customers Order winners are the criteria that differentiates the products and services of one firm from another
  • 5.
    5 Service Breakthroughs  A brand name car can be an “order qualifier” •Repair services can be “order winners” Examples: Warranty, Roadside Assistance, Leases, etc
  • 6.
    6 Operations Strategy Strategy Process Example Customer Needs More Products Corporate Strategy Increase Org. Size Operations Strategy Increase Production Capacity Decisions on Processes and Infrastructure Build New Factory
  • 7.
    7 Strategy Design Process Strategy Map What it is about! Financial Perspective Improve Shareholder Value Customer Perspective Customer Value Proposition Internal Perspective Build-Increase-Achieve Learning and Growth Perspective A Motivated and Prepared Workforce
  • 8.
    8 The Balanced Scorecard Judicious mix of financial and operational measures for measuring the performance • Customer perspective • Business process perspective • Innovation and learning perspective • Financial perspective
  • 9.
    Balanced Scorecard Modelfor Measuring Operations Performance How do stakeholders view Operations? Financial Perspective Goals Measures How do customers At which view the Operations tasks Operations? must we excel Customer Perspective Internal / Process Goals Measures Perspective Goals measures Innovation & Learning Perspective Goals Measures
  • 10.
    10 Kaplan and Norton’sGeneric Strategy Map In the Kaplan and Norton’s Generic Strategy Map, under the Financial Perspective, the Productivity Strategy is generally made up from two components: 1. Improve cost structure: Lower direct and indirect costs 2. Increase asset utilization: Reduce working and fixed capital
  • 11.
    Kaplan and Norton’s 11 Generic Strategy Map (Continued) In the Kaplan and Norton’s Generic Strategy Map, under the Financial Perspective, the Revenue Growth Strategy is generally made up from two components: • Build the franchise: Develop new sources of revenue • Increase customer value: Work with existing customers to expand relationships with company
  • 12.
    Kaplan and Norton’s 12 Generic Strategy Map (Continued) In the Kaplan and Norton’s Generic Strategy Map, under the Customer Perspective, there are three ways suggested as means of differentiating a company from others in a marketplace: 1. Product leadership 2. Customer intimacy 3. Operational excellence
  • 13.
    13 Kaplan and Norton’sGeneric Strategy Map (Continued) In the Kaplan and Norton’s Generic Strategy Map, under the Learning and Growth Perspective, there are three principle categories of intangible assets needed for learning: 1. Strategic competencies 2. Strategic technologies 3. Climate for action
  • 14.
    Developing an OperationsStrategy Corporate Objectives Functional Areas Business Plan Operations Marketing Marketing Plan Business Strategies Financing/Accounting Research & Dev. Budget Strengths and Weaknesses Human Capital Operations Objectives Production Plan Other Plan Operation Strategies Long-range Decisions about Products, Processes and Facilities Position the Production System Focus of Factories or Service Facilities Product / Service Design and Development Allocation of Resources to Alternatives Facility Planning : Capacity, Location and Layout
  • 15.
    15 Steps inDeveloping a Manufacturing Strategy  1. Segment the market according to the product group  2. Identify product requirements, demand patterns, and profit margins of each group  3. Determine order qualifiers and winners for each group  4. Convert order winners into specific performance requirements
  • 16.
    16 Service Strategy Capacity Capabilities • Process-based Capacities that transforms material or information and provide advantages on dimensions of cost and quality • Systems-based Capacities that are broad-based involving the entire operating system and provide advantages of short lead times and customize on demand • Organization-based Capacities that are difficult to replicate and provide abilities to master new technologies
  • 17.
    17 What is Productivity? Defined Productivityis a common measure on how well resources are being used. In the broadest sense, it can be defined as the following ratio: Outputs Inputs
  • 18.
    Productivity – Introduction& Definition • Productivity primarily is an attitude of mind – an attitude of looking at the scope for improvement • It stands for the elimination of MUDA( Japanese ) or Waste in all forms • It is the function of providing more and more of everything, for more and more people with less and less consumption of Resources • The essence of productivity lies in producing the same volume with less resources or producing more output with proportionately less increase in inputs
  • 19.
    Factors affecting Productivity ExternalFactors • Beyond the control of individual Enterprise • External Infrastructure • Non- availability of Funds, Water, Power, Transportation • Raw Material Supply constraints • Government Policies ( Emission Laws etc.) • Social / Political / Economic Environment
  • 20.
    Factors affecting Productivity( contd.) Internal Factors • Hard Factors – Products / Technology / Plant & Eqpt. / Raw Materials • Soft Factors – People / Work Methods / Systems & Procedures / Organisation Structure / Management Practices
  • 21.
    21 Total Measure Productivity Total Measure Productivity = Outputs Inputs or = Goods and services produced All resources used
  • 22.
    22 Partial Measure Productivity  Partial measures of productivity =  Output or Output or Output or Output Labor Capital Materials Energy
  • 23.
    23 Multifactor Measure Productivity  Multifactor measures of productivity =  Output . Labor + Capital + Energy or  Output . Labor + Capital + Materials
  • 24.
    Example of Productivity 24 Measurement  You have just determined that your service employees have used a total of 2400 hours of labor this week to process 560 insurance forms. Last week the same crew used only 2000 hours of labor to process 480 forms.  Which productivity measure should be used?  Answer: Could be classified as a Total Measure or Partial Measure.  Is productivity increasing or decreasing?  Answer: Last week’s productivity = 480/2000 = 0.24, and this week’s productivity is = 560/2400 = 0.23. So, productivity is decreasing slightly.
  • 25.
    25 Question Bowl An operations strategy is concerned with which of the following? b. Setting specific policies and plans c. Short-term competitive strategies d. Coordination of operational goals e. All of the above f. None of the above Answer: c. Coordination of operational goals
  • 26.
    26 Question Bowl Typically a strategy breaks down into what major components? b. Operations effectiveness c. Customer management d. Production innovation e. All of the above f. None of the above Answer: d. All of the above
  • 27.
    27 Question Bowl A criterion that differentiates the products and services of one firm from another can be which of the following? b. An order qualifier c. An order winner d. PWP e. KPI f. None of the above Answer: b. An order winner
  • 28.
    28 Question Bowl A travel agency processed 240 customers on Day 1 with a staff of 12, and 360 customers the on Day 2 with a staff of 15. What can be said about the productivity shift from Day 1 to Day 2? ↑ An increase in productivity from Day 1 to Day 2 ↑ A decrease in productivity from Day 1 to Day 2 ↑ The same productivity from Day 1 to Day 2 ↑ Can not be computed from data above ↑ None of the above Answer: a. An increase in productivity from Day 1 to Day 2(Day 1 productivity = 240/12=20 Day 2 productivity = 360/15=24)
  • 29.
    29 Question Bowl In addition to traditional financial measures, what critical questions can a Balanced Scorecard help a company answer? b. How do customers see us? c. What must we excel at? d. How can we continue to improve and create value? e. All of the above f. None of the above Answer: d. All of the above
  • 30.
    30 Solved Problems – OPERATIONS MANAGEMENT (Class of 2010) Q3. d) Various financial data for 2002 & 2003 follow. Calculate the total productivity measure and the partial measure for labour, capital and raw materials for this company for both years. What do these measures tell you about this company? 2002 2003 Output Sales $ $2,20,000 2,00,000 Input Labour 30,000 40,000 Raw Material 35,000 45,000 Energy 5,000 6,000 Capital 50,000 50,000 Others 2,000 3,000 Answer :- Total Productivity = Output Input
  • 31.
    31  Output 2002 2003 2,00,000 2,20,000  Input 2002 2003 Labour 30,000 40,000 Raw Materials 35,000 45,000 Energy 5,000 6,000 Capital 50,000 50,000 Others 2,000 3,000 Total Inputs 1,22,000 1,44,000
  • 32.
    32 a) Total Productivity measure Year 2002 Total Productivity = Output Input = 2,00,000 1,22,000 = 1.66 Year 2003 Total Productivity = 2,20,000 1,44,000 = 1.53
  • 33.
    33 - Partial Productivity measure (Labour) Partial Productivity measure = Total Output Cost of Labour for the year 2002 = 2,00,000 = 6.67 30,000 for the year 2003 = 2,20,000 = 5.5 40,000 c) Partial Productivity measure (Capital) Partial Productivity measure = Total Output Capital for the year 2002 = 2,00,000 = 4 50,000 for the year 2003 = 2,20,000 = 4.4 50,000
  • 34.
    34 d) Partial Productivitymeasure (Raw Materials) Partial Productivity measure = Total Output Cost of Raw Materials for the year 2002 = 2,00,000 = 5.71 35,000 for the year 2003 = 2,20,000 = 4.88 45,000