Downloaded 44 times


![Promo Programs Popular
IN-STORE RETAILER [NET]
64%
ONLINE RETAIL STORE [NET]
53%
83% plan to take part in a promo
program when shopping for tech products](https://image.slidesharecdn.com/2016holidayoutlook-160921202644/85/2016-Holiday-Outlook-53-320.jpg)


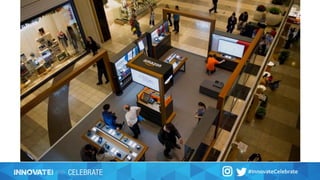


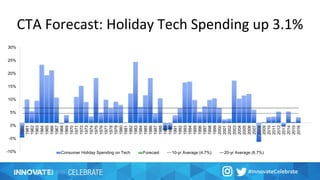
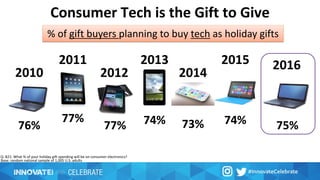
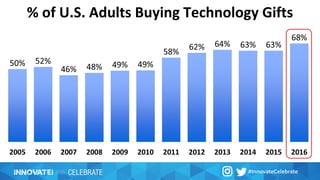
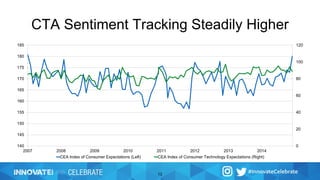
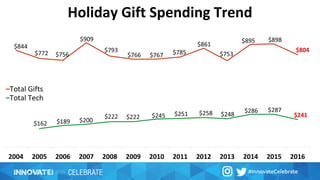
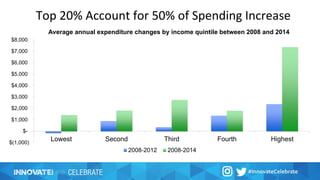
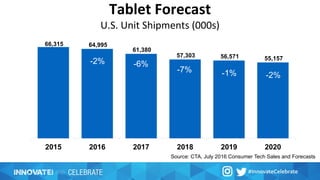
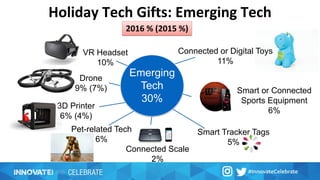
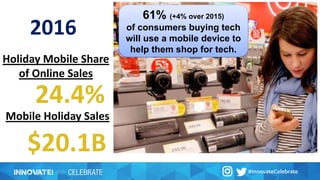
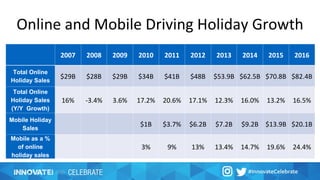
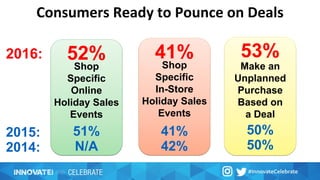
The CTA's 23rd annual holiday outlook predicts mixed signals for consumer spending during the 2016 holiday season, with overall retail sales projected to grow by 3.8%. While mobile sales are expected to increase significantly, electronics retailers anticipate a decline of 2.9% in sales. Additionally, consumer sentiment is steadily improving, with 75% of adults planning to buy technology gifts this year.


![2013 Holiday Shopping Intentions [Google+ Ipsos]](https://cdn.slidesharecdn.com/ss_thumbnails/2013-holiday-shopper-intentionsarticles-131106044614-phpapp02-thumbnail.jpg?width=640&height=640&fit=bounds)


![5G Explained! A High Level Overview [Introduction]](https://cdn.slidesharecdn.com/ss_thumbnails/5gexplainedahighleveloverview-260119165306-cc137a3e-thumbnail.jpg?width=640&height=640&fit=bounds)


