Download to read offline


![Telecom Italia S.p.A.
Report on Operations
Social and environmental impacts of operations and their economic aspects 120
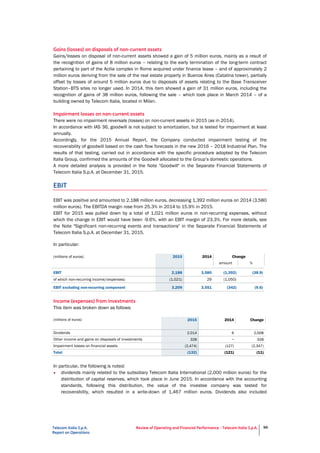
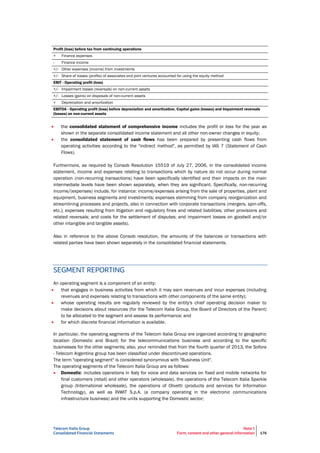
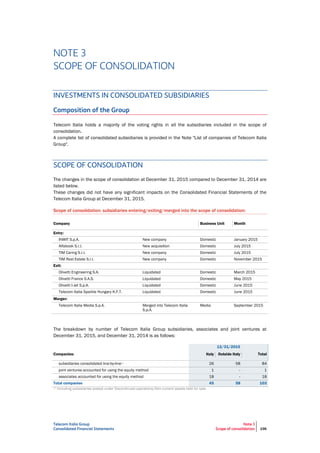
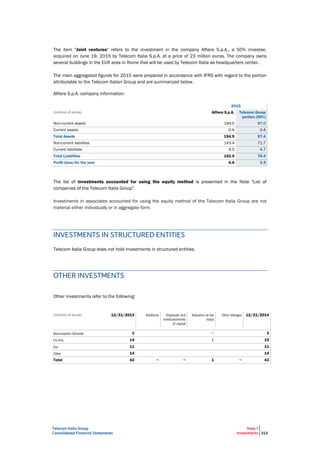
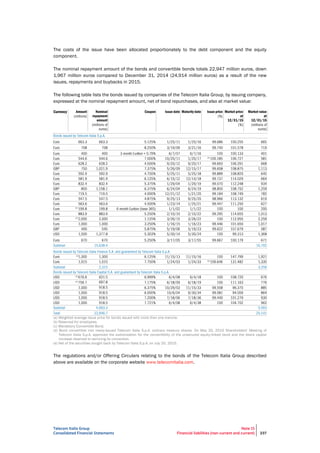
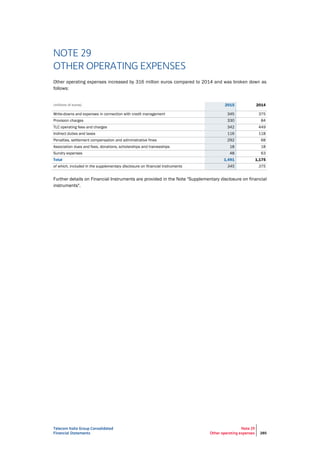
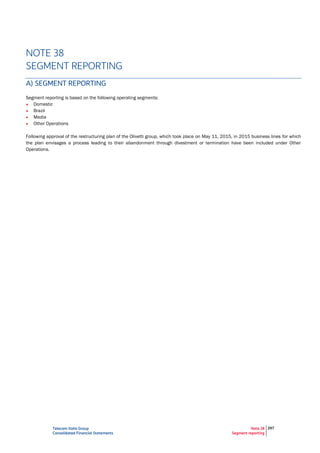
The increase in the demand for energy in 2015 was estimated to be approximately 165 GWh, 21% (35
GWh) of which was associated with the increase in temperatures. This increase was offset by the
savings made possible by a series of energy efficiency improvement measures undertaken and
completed in 2013 and 2014, as well as new measures undertaken and completed during 2015,
including, in particular, projects involving the replacement of obsolete equipment with new, more
efficient systems. A significant boost to electricity generation has been achieved by co- and tri-
generation - resulting in an estimated increase of 45 GWh on 2014 - implementing measures to improve
the efficiency of currently operating systems and bringing a further 6 into service, in addition to existing
ones. Overall, these measures have offset the increased demand from technological implementations
and achieved a 2 GWh reduction in consumption. The saving can be estimated to be around 10 million
euros over the course of the year.
Two ISO 50001 certified sites and one ISO 14064 certified site were confirmed in 2015.
The energy efficiency of Telecom Italia was also recognised by the award in 2015 of White Certificates
(TEE) for 34 projects, corresponding to around 40,000 TOE (Tonnes of Oil Equivalent) per year saved
and an estimated economic value at current prices of around 40 million euros over 5 years.
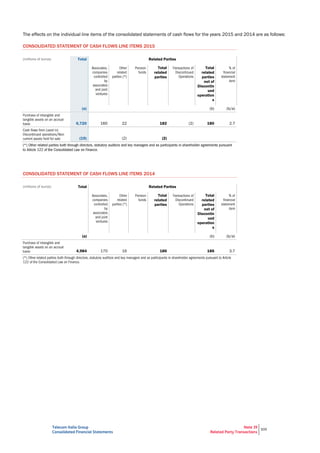
EFFICIENCY IMPROVEMENT PROCESS, SOCIAL COST
OPTIMISATION - ENGAGEMENT WITH WORKERS'
REPRESENTATIVES
Telecom Italia pays great attention to listening and involving workers' representatives in many areas of
work, including reorganisation processes. This allows agreements to be reached for the implementation
of efficiency improvement plans that can mediate between the needs of the workers and those of the
company. In particular, a complex negotiation process involving the leading trade union organisations
was completed in late 2015 with the signing of a new framework agreement, which will apply from the
beginning of 2016, for the management of expected redundancies. The willingness to search for
dialogue between the parties guided this discussion too, and is tangibly demonstrated by the agreement
reached.
Like its predecessors, this Agreement also provides for the use of instruments that are not socially and
economically traumatic, including the use of Defensive Solidarity Contracts, as required by the Jobs Act,
combined with the strategic role of the training lever, as a pivotal element to encourage professional
retraining and requalification in order to counteract redundancies. Defensive Solidarity Contracts are
agreements that provide for working hours to be reduced in order to avoid downsizing. For the workers
to whom the contract will be applied, provision is made for INPS [social security] to make up part of the
remuneration not received due to the reduction in working hours. Furthermore, in order to alleviate the
economic hardship caused by the loss of remuneration, Telecom Italia has provided for company loans
to be granted at very favourable interest rates. Finally, the Agreement provides for Telecom Italia to pay
a variable one-off amount to workers covered by the Solidarity Contract at the end of the period and on
achievement of specific objectives associated with the redundancy plan.
The other instruments agreed between the Parties will allow redundancies to be minimised structurally
with early and voluntary departures under the mobility provisions of law 223/91 and article 4 of the so-
called Fornero Law.
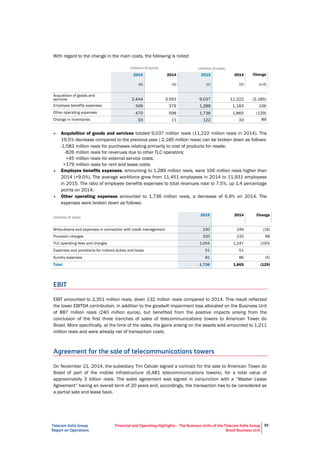
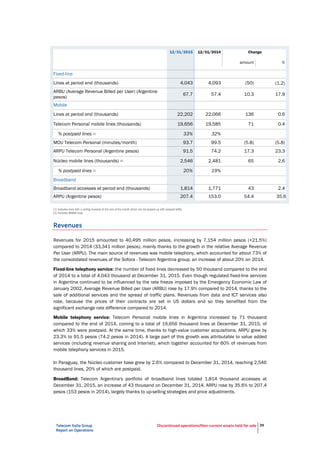
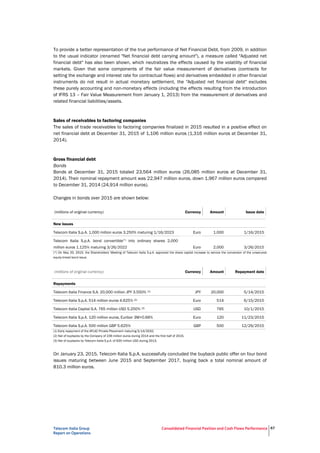
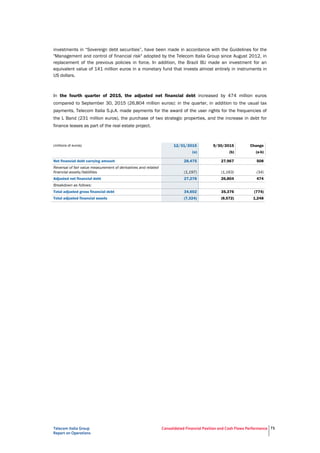
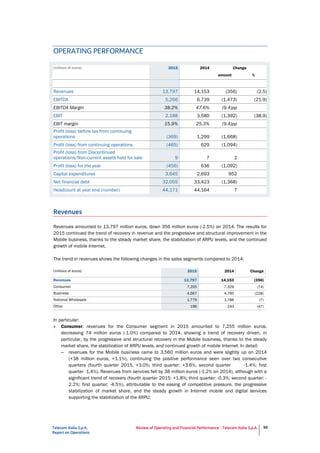
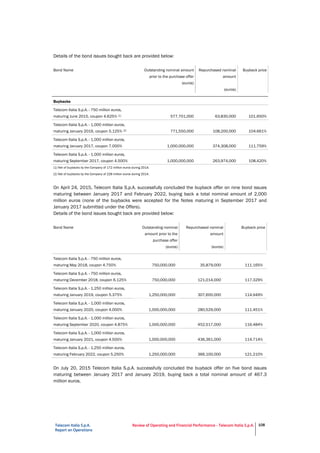
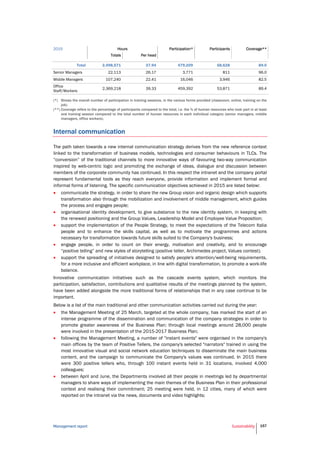
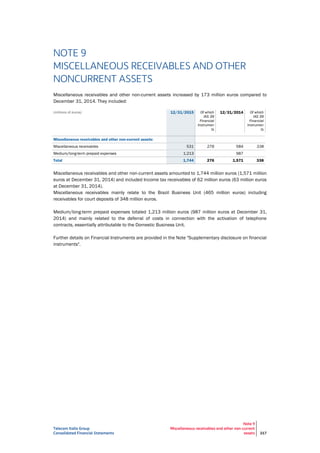
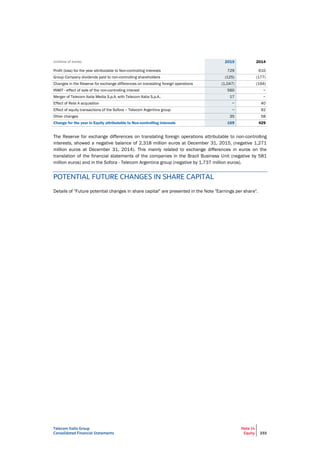
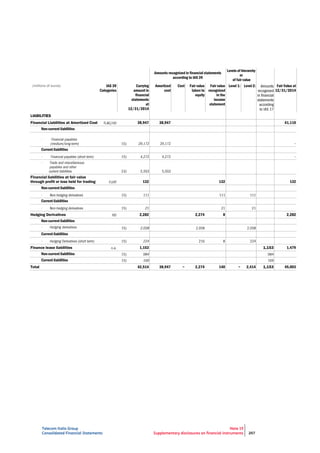
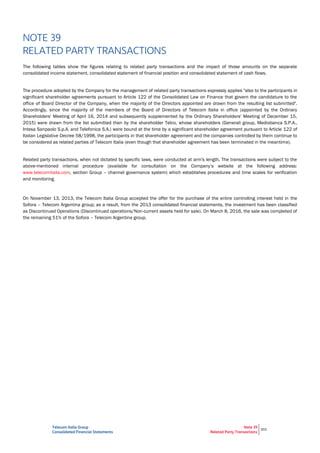
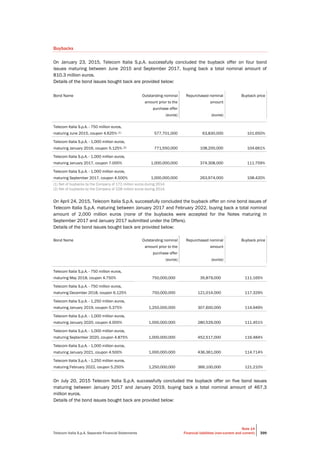
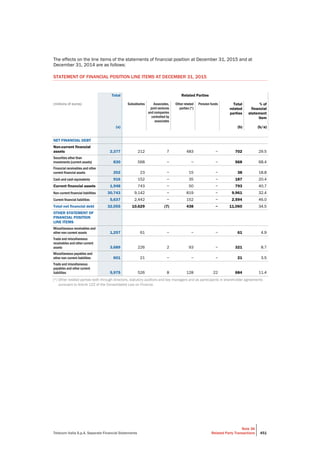
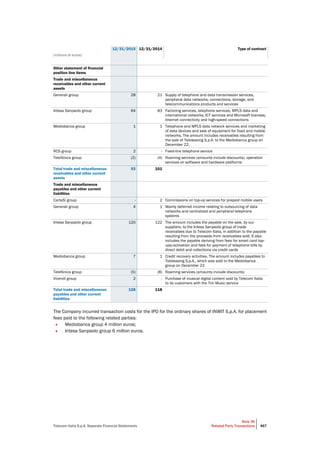
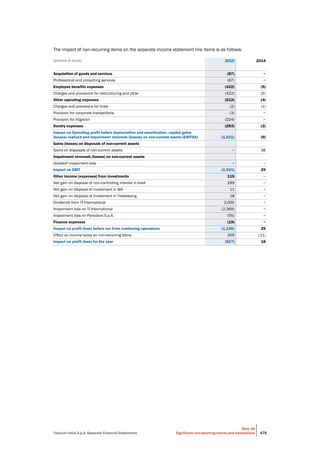
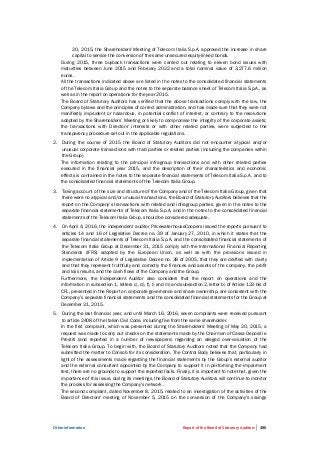
The previous solidarity contracts expired in April 2015. The benefit on the cost of labour for 2015 was
44 million euros for the Group as a whole (145 million euros in 2014) and around 34 million euros for
Telecom Italia S.p.A. (121 million euros in 2014).](https://image.slidesharecdn.com/annualreport-160407153437/85/Annual-report-2015-122-320.jpg)
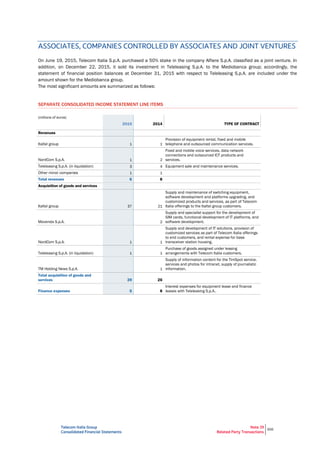
![Management report Sustainability 150
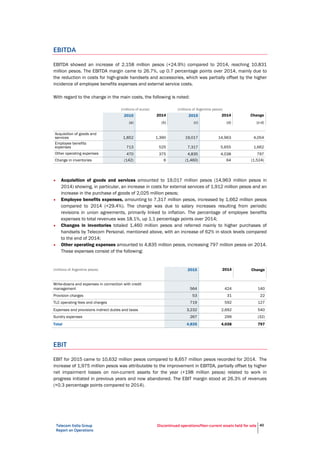
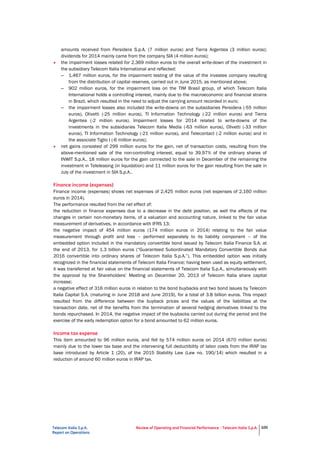
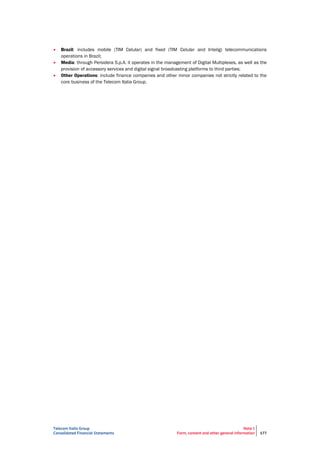
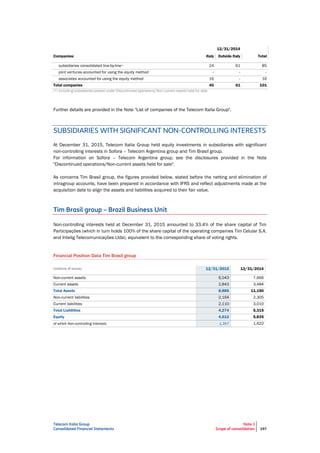
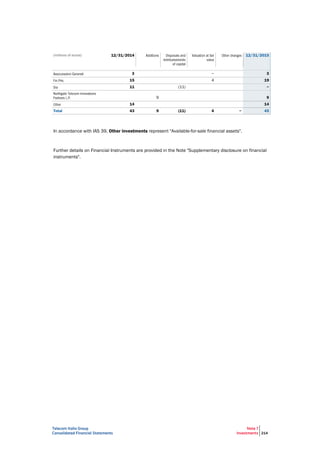
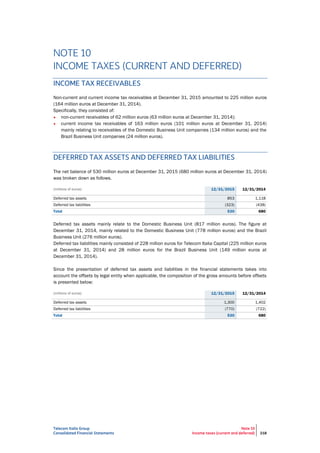
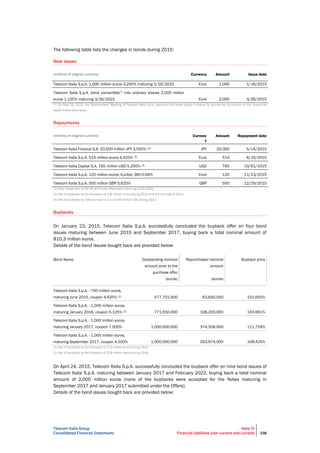
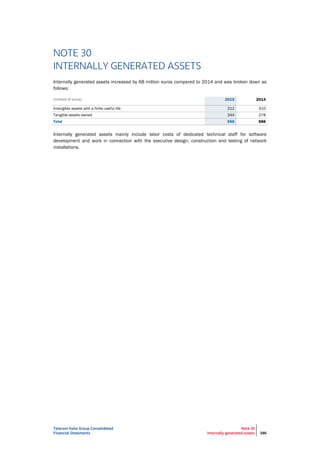
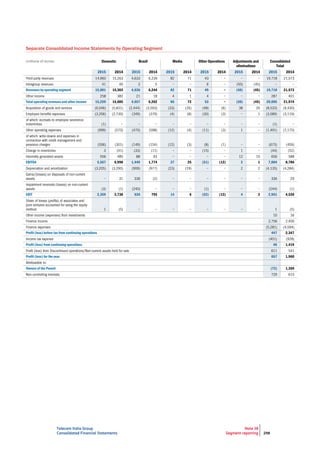
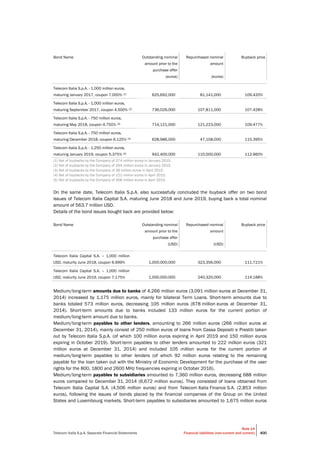
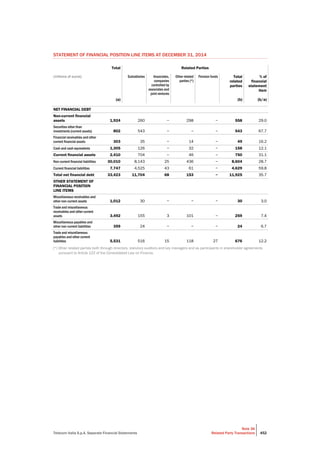
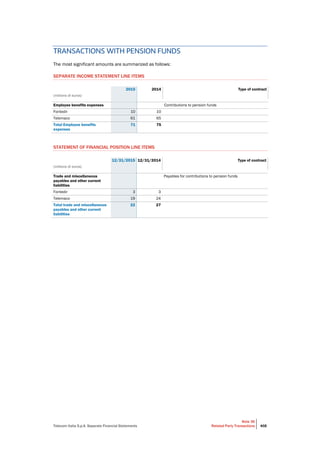
called “La Buona Scuola” [The Good School]. EducaTI is a multi-annual programme which plans the
implementation of a series of complementary initiatives carried out in collaboration with the Ministry of
Education, Universities and Research (MIUR) and with some institutional partners of excellence. In
detail:
A Social Life: during 2015 the Group renewed its collaboration with the Postal and Communication
Police to run the second edition of the road show across the country (55 cities and 500,000
students involved) aimed at raising awareness among young people on the topic of online security
and the dangers connected with being uninformed about the use of the Internet and Social
Networks. During the tour the “Handbook for Young Surfers: The Rules for Safe Browsing” was
distributed, which lists the 10 virtuous behaviours that a “social” teenager should follow on the
Internet.
Programme the Future: a MIUR initiative - which sees Telecom Italia as the Founding Sponsor
Partner - to encourage the introduction of computational thought and coding to primary school
students. The project, implemented by CINI (Consorzio Interuniversitario Nazionale per Informatica -
National Inter-University Consortium for Information Technology) and Telecom Italia is contributing in
three ways: economic support, high visibility in the editorial planning of the Group's social and web
properties, and company volunteering, with over 400 voluntary employees offering support and
tutoring to teachers and students.
YouTeach: a creative contest set up by Telecom Italia in collaboration with MIUR for high schools
throughout the country involving the creation of videos in which students conduct a lesson for their
teachers on the use of social networks. Among the 120 films received, the contest rewarded those
which best conveyed the learning process of the social tool and its value as regards the digital
culture to be disseminated at school.
TIM WebRulez is also a digital education campaign of Telecom Italia starring ten webstars who will act as
ambassadors of the booklet developed by the Company in collaboration with the National Police to
disseminate the responsible use of the Internet among teenagers. Each webstar performs, in an original
way, one of the rules in the booklet through an image disseminated on his/her social channels inviting
fans and followers to share it.
The digital culture is also the scope of projects aimed at bringing high quality cultural content and digital
languages together, making the most of the interaction opportunities offered by the Web. In so doing,
the Company is asserting itself as an innovative partner in the Italian cultural and artistic world,
assuming a role recognised by stakeholders who work alongside it in the various cultural sectors in
which digital dissemination initiatives are run.
The partnership with Accademia Nazionale di Santa Cecilia takes the form of the PappanoinWeb project.
Conceived for the purpose of bringing great classical music to the web. The initiative, in its fifth year in
2015, was enhanced by the experience offered by “360° overview” filming technologies. Over the five
years of the programme, the concerts offered have been watched by over 200,000 users in streaming
on telecomitalia.com/pappanoinweb, thanks to the listening guides, exclusive interviews and the
opportunities to interact with an expert musicologist at the Accademia during direct broadcasts. A big
open air rehearsal also allowed around 2,000 colleagues to experience the excitement backstage, with
the protagonists, and to view the real difficulties of a high level musical performance.
As regards writing we should mention the collaboration with the Eutopia webzine (resulting from a
partnership between the Company and Editori Laterza) and the partnership with Scuola Holden, Turin,
founded by Alessandro Baricco. The first fulfils the aim of drawing the public, particularly the young, into
the debate about the prospects for a new European model of society. The second experiments with new
ways of teaching and sharing ideas, knowledge and creativity through digital technology. The Web
becomes a vehicle to allow the public to participate in master classes and special events happening in
the School. The collaboration has allowed a pioneering multimedia laboratory to be set up, implementing
original dissemination projects, including the #wehaveadream social writing experiment. Scuola Holden
also supports, with a working group formed by the best students, communication of all the stages in the
travelling Digital Championship project, promoted by the Company and the Digital Champions
association.
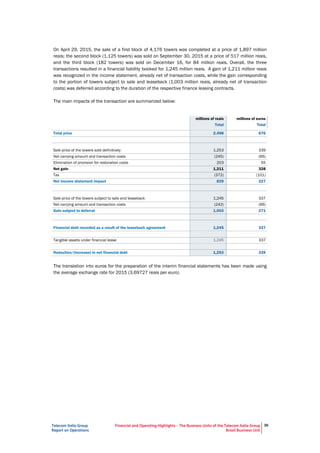
On the Brazilian front, in 2013, the TIM Institute was founded with the aim of defining strategies and
providing resources for the dissemination of science and innovation to support the community,
particularly by means of mobile technology. Four areas of activity were identified:
education/teaching](https://image.slidesharecdn.com/annualreport-160407153437/85/Annual-report-2015-152-320.jpg)
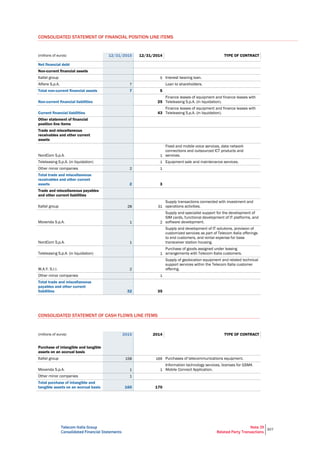
![Management report Sustainability 162
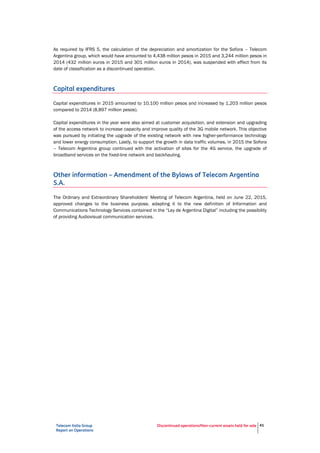
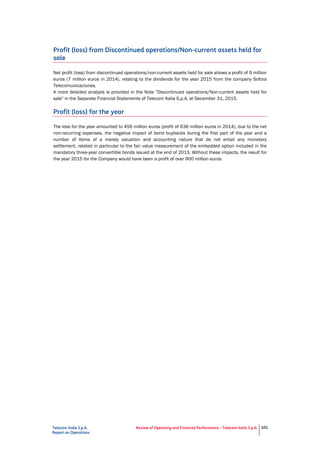
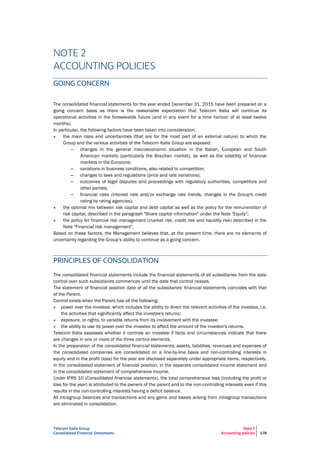
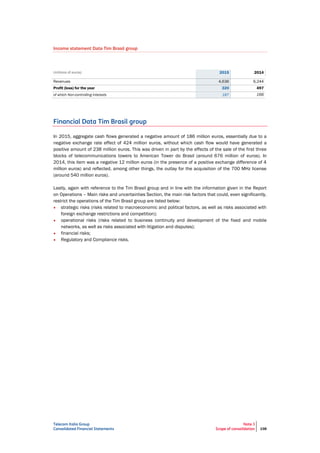
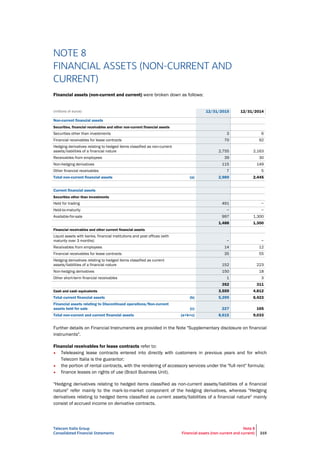
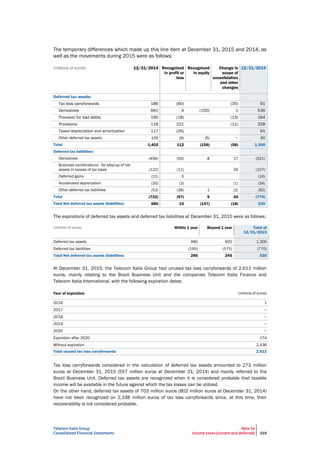
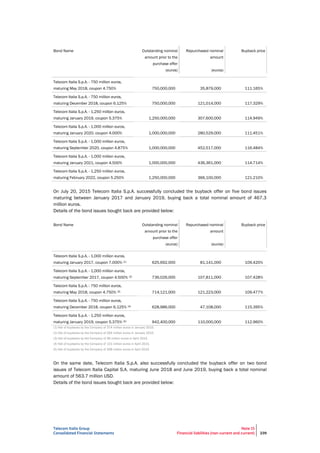
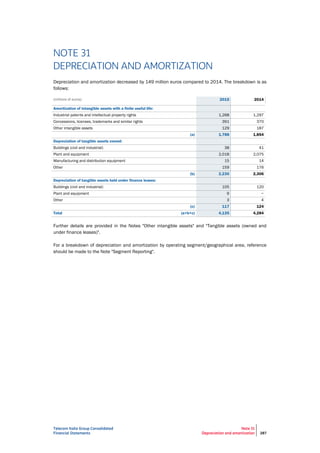
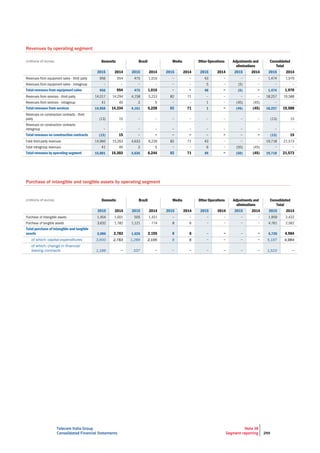
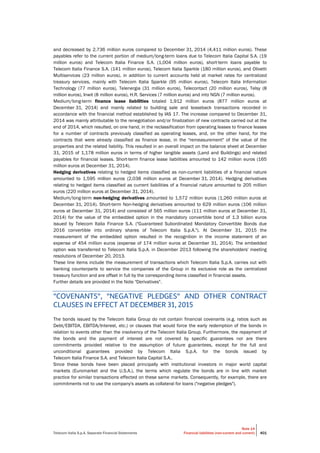
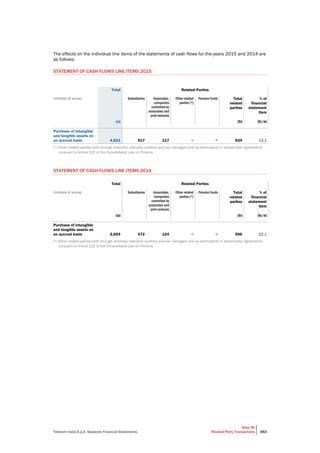
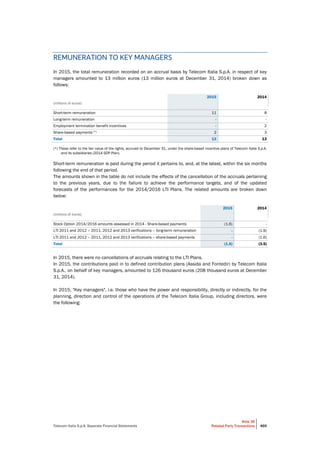
In 2015, the implementation of Total Rewarding principles is confirmed and extended for the purpose of
allow the flexible use of multiple instruments, which are no longer only monetary but include welfare,
training, professional and development paths. The 2015 remuneration policy therefore intends to
consolidate the process that began in 2014, making flexible use of five pillars, the first two of a financial
nature, the remaining ones associated with a broader system of rewards: salary increases, bonuses,
cars, job levels and training. Finally, possible instruments of the remuneration policy include the Broad-
Based Share Ownership Plan or PAD (Piano di Azionariato Diffuso), a system for sharing in the risks and
profits of the company, aimed at supporting employee motivation and reinforcing a sense of belonging.
In June 2014, the company launched a new PAD under which all permanent employees of Telecom Italia
S.p.A and its subsidiaries with registered office in Italy could buy shares with a 10% discount on the
market price. In August 2015, one year after allocation, if ownership of the shares had been retained
and the owner remained in employment, one free share (bonus share) was awarded for every three
shares subscribed.
FONDAZIONE TELECOM ITALIA COMMITMENT
The mission of the Fondazione Telecom Italia (FTI) is to promote the culture of digital change and
innovation, promoting integration, communication, economic and social growth.
FTI can operate, in Italy and abroad, by the methods and with the tools that are considered appropriate
in each case for it to achieve its statutory purposes.
In accordance with this mission, four areas of intervention have been identified:
Education: innovation in teaching and education, promoting initiatives aimed at updating the
technology in Italian schools and introducing radical innovations in educational methods and tools.
Innovation culture: becoming a reference point for innovation culture through an annual
international conference, two university lectures and research publications on topics related to
business and the history of innovation.
Social empowerment: promoting the processes of change taking place in society through new
technologies for social enterprises, to help them "do good well".
Historic and artistic heritage: contributing to protecting a world-famous heritage, allowing it to be
enjoyed, particularly by innovative means, to make our country ever more competitive.
In the area of education three important projects were launched: "Curriculum Mapping", "I linguaggi
della contemporaneità" [Contemporary languages] and "MirRobot".
The "Curriculum Mapping" project involves the creation of a platform to map curricula: it is a useful tool
to facilitate the sharing of programmes between teachers of the same subject and between schools in
the same education network, their supervision by head teachers, the orderly and integrated use of
digital educational content by students. Mapping the curriculum means making the school curriculum
and its component parts intelligible, shareable and transparent.
The "I linguaggi della contemporaneità" [Contemporary languages] project is intended to reinvigorate
and update the teaching of contemporary history in secondary schools, moving beyond the combination
of text book and classroom lesson to integrate narrative strategies drawn from sources including
television, cinema, theatre, photography and literature. The 15 classes involved in the project produced
a multimedia proposal connected with a specific modern conflict, making the most of the opportunities
for interaction and complementarity offered by a digital social platform.
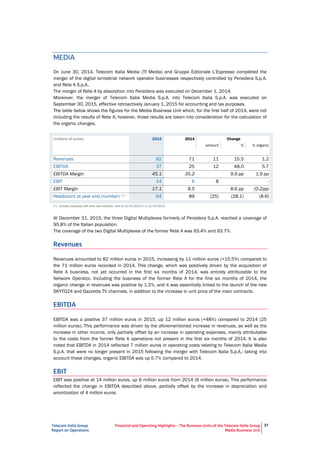
The “MirRobot” project consists of equipping the ITS (Biomedical Secondary School) of Mirandola, a city
that was destroyed by the 2012 earthquake, with an automation and robotics laboratory in the
biomedical sector, to offer students the opportunity to train in a growing technological sector and
develop specific skills that are useful to their inclusion in the world of work. The laboratory organises
robotics lessons and practice for ITS course participants. It will be useful for the ongoing training of
company technicians and will be available to local students to introduce them to the world of
technological innovation.](https://image.slidesharecdn.com/annualreport-160407153437/85/Annual-report-2015-164-320.jpg)


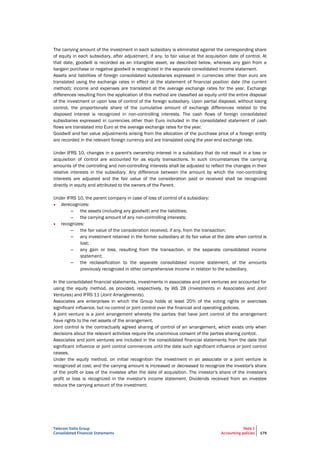
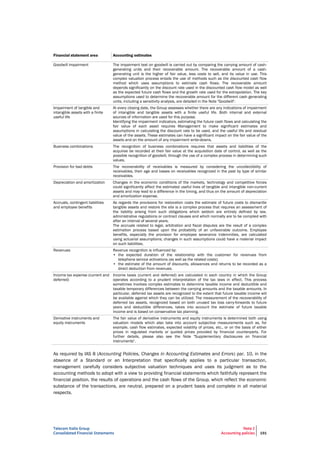
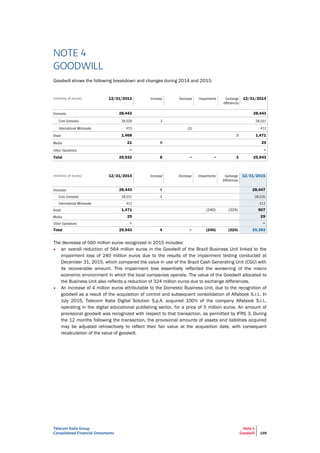

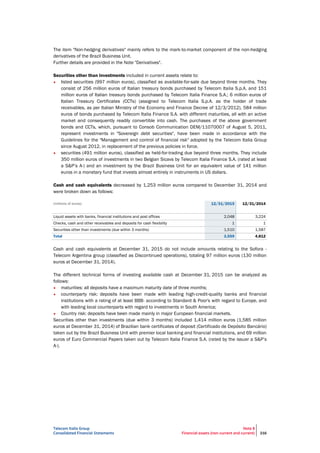
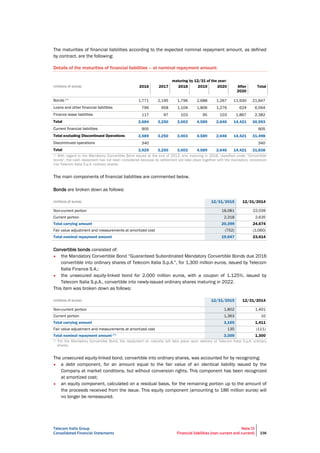
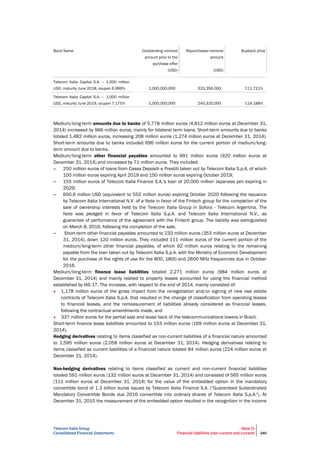
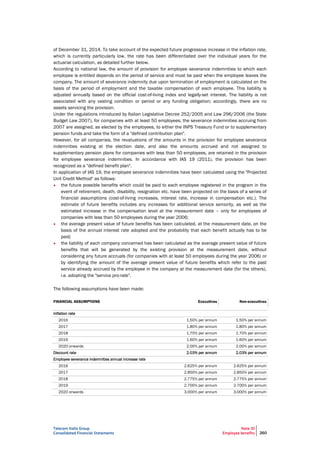
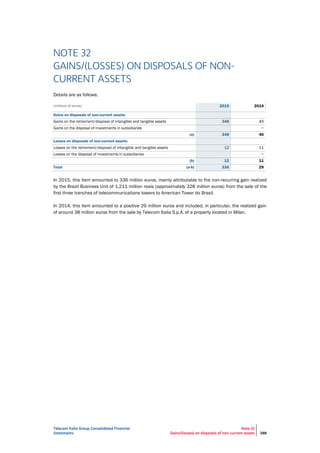
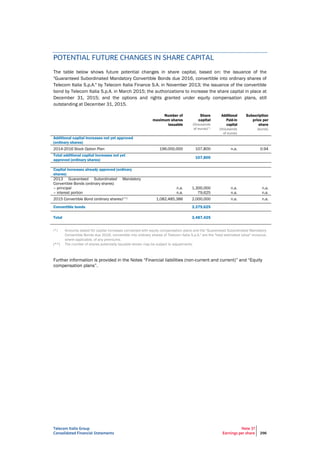
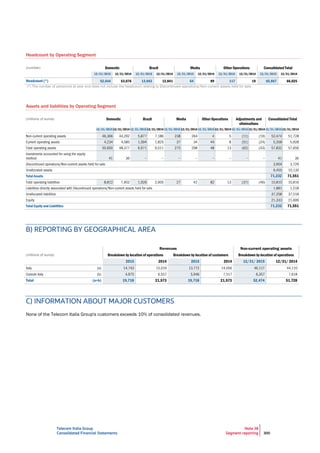
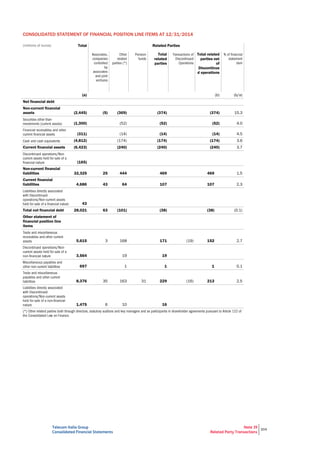
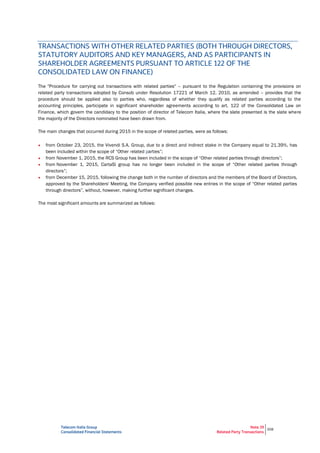


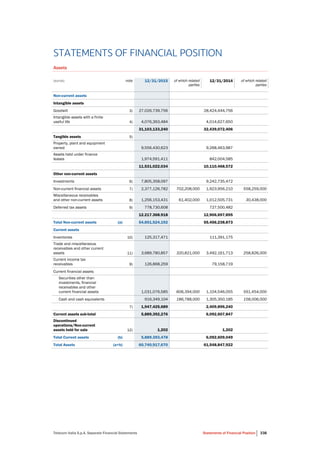
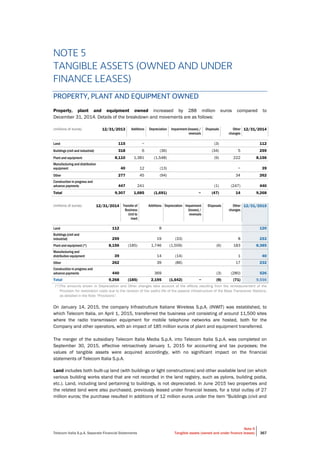
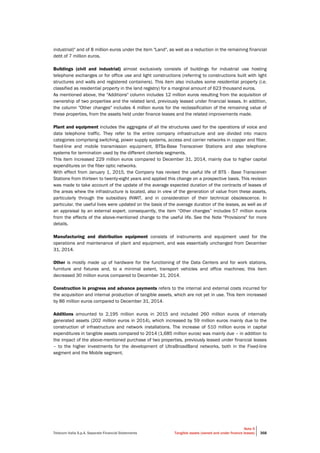
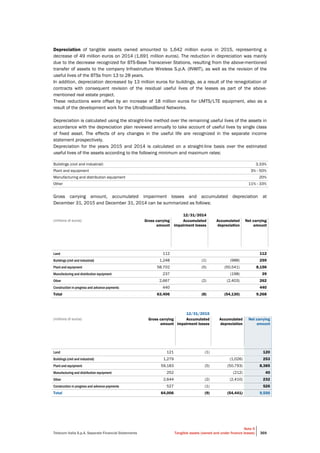
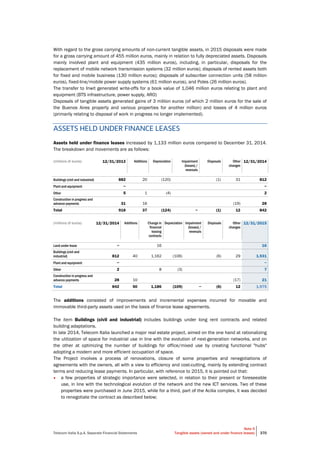
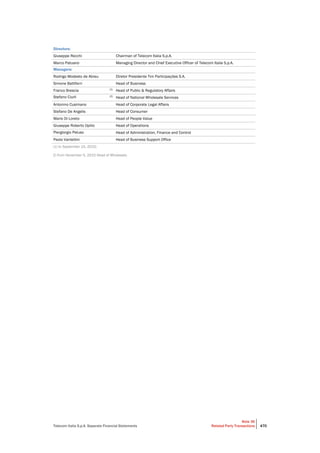


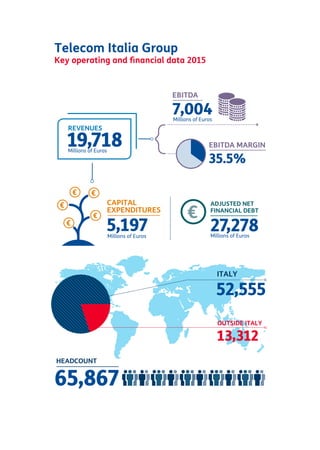
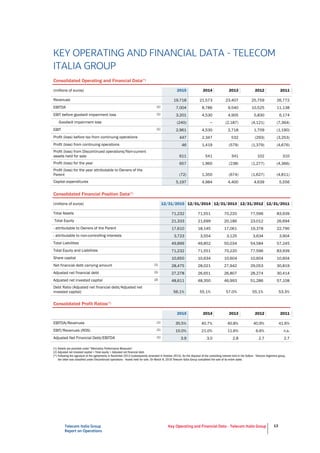
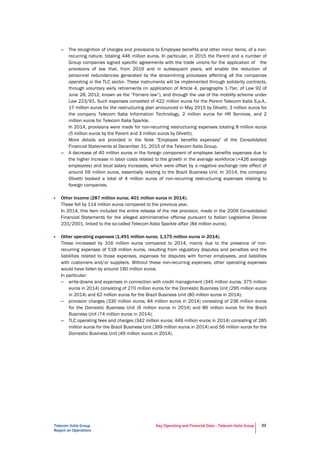
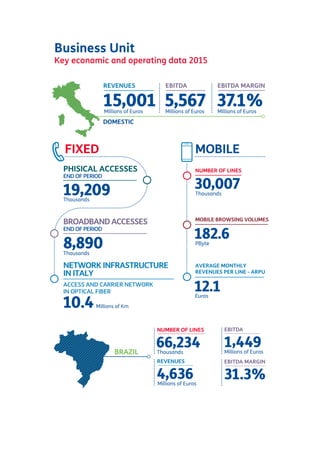
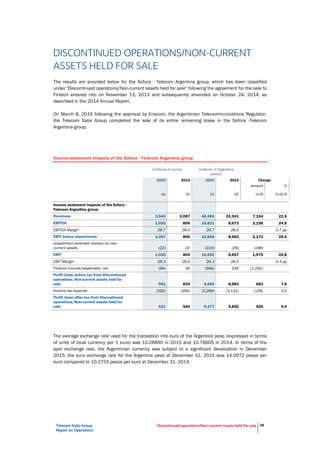
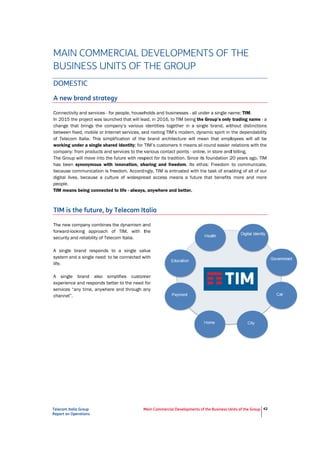
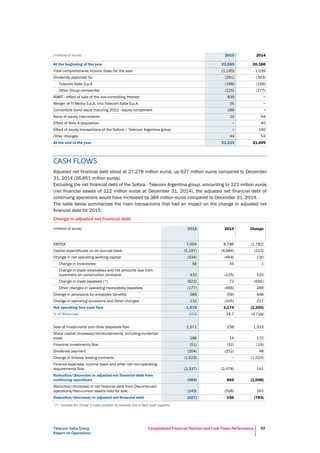
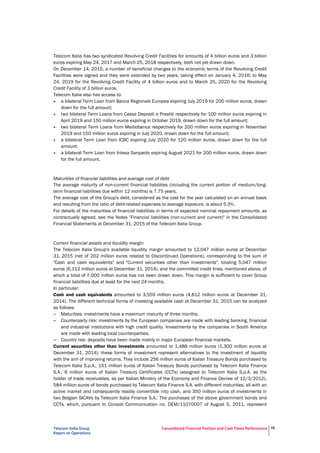
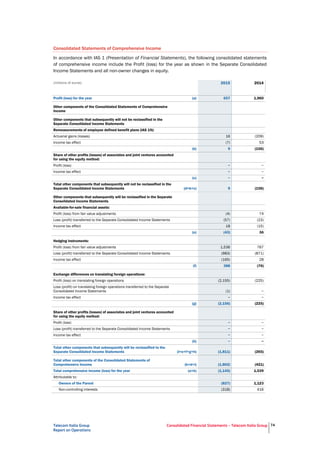
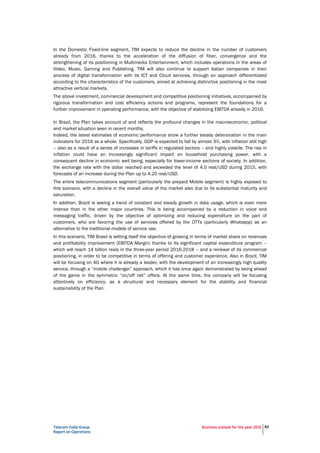
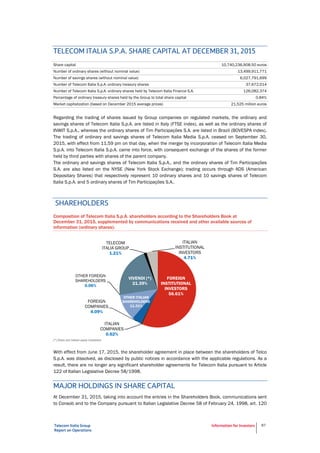
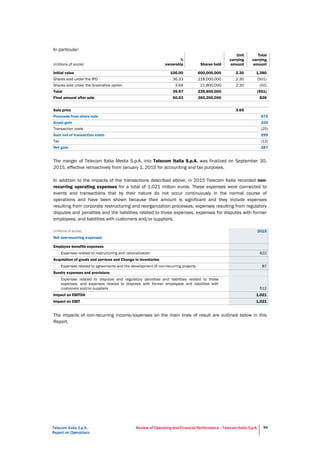
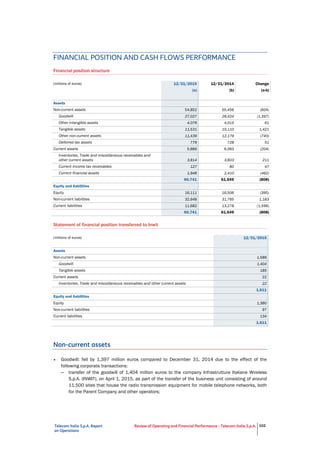
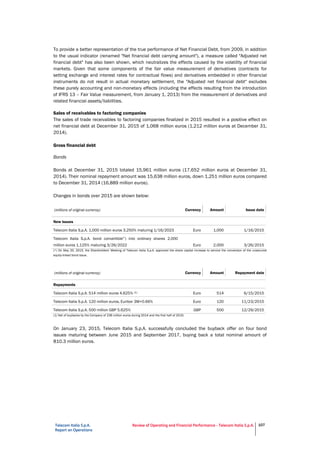
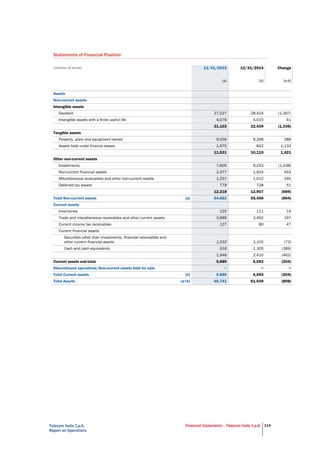
This document provides key operating and financial data for the Telecom Italia Group for the years 2011-2015. It shows that revenues declined from €26.8 billion in 2011 to €19.7 billion in 2015 while EBITDA fell from €11.1 billion to €7 billion over the same period. Capital expenditures remained around €5 billion annually while adjusted net financial debt increased from €30.4 billion in 2011 to €27.3 billion in 2015.


